| Param | Original file | Final file |
|---|---|---|
| Filename | modeM0/AS1A11_080T02_9000004768_33194cztM0_level2.evt | modeM0/AS1A11_080T02_9000004768_33194cztM0_level2_quad_clean.evt |
| Size (bytes) | 575,334,720 | 54,714,240 |
| Size | 548.7 MB | 52.2 MB |
| Events in quadrant A | 2,401,574 | 330,873 |
| Events in quadrant B | 6,069,721 | 322,726 |
| Events in quadrant C | 4,090,041 | 331,456 |
| Events in quadrant D | 4,519,097 | 315,197 |
| Mode M9 | |||
|---|---|---|---|
| Quadrant | BADHDUFLAG | Total packets | Discarded packets |
| A | 0 | 20 | 0 |
| B | 0 | 20 | 0 |
| C | 0 | 20 | 0 |
| D | 0 | 20 | 0 |
| Mode SS | |||
|---|---|---|---|
| Quadrant | BADHDUFLAG | Total packets | Discarded packets |
| A | 0 | 102 | 0 |
| B | 0 | 102 | 0 |
| C | 0 | 102 | 0 |
| D | 0 | 102 | 0 |
| Mode M0 | |||
|---|---|---|---|
| Quadrant | BADHDUFLAG | Total packets | Discarded packets |
| A | 0 | 10255 | 2 |
| B | 0 | 21600 | 1 |
| C | 0 | 15455 | 1 |
| D | 0 | 17241 | 1 |
| Quadrant | Total seconds | Saturated seconds | Saturation percentage |
|---|---|---|---|
| A | 5087 | 7 | 0.137606% |
| B | 5087 | 894 | 17.574209% |
| C | 5087 | 583 | 11.460586% |
| D | 5087 | 139 | 2.732455% |
Noise dominated data is calculated using 1-second bins in cleaned event files. If a bin has >2000 counts, and if more than 50% of those come from <1% of pixels, then it is considered to be noise-dominated and hence unusable.
| Quadrant | # 1 sec bins | Bins with >0 counts | Bins with >2000 counts | High rate bins dominated by noise | Noise dominated (total time) | Noise dominated (detector-on time) | Marked lightcurve |
|---|---|---|---|---|---|---|---|
| A | 7059 | 5088 | 0 | 0 | 0.00% | 0.00% |  |
| B | 7059 | 5088 | 577 | 577 | 8.17% | 11.34% |  |
| C | 7059 | 5088 | 535 | 535 | 7.58% | 10.51% |  |
| D | 7059 | 5088 | 116 | 116 | 1.64% | 2.28% |  |
Top three noisy pixels from each quadrant. If the there are fewer than three noisy pixels in the level2.evt file, extra rows are filled as -1
| Pixel properties | Quadrant properties | ||||||
|---|---|---|---|---|---|---|---|
| Quadrant | DetID | PixID | Counts | Sigma | Mean | Median | Sigma |
| A | 13 | 254 | 9176 | 68.82 | 618 | 606 | 124.5 |
| A | 13 | 6 | 8814 | 65.92 | 618 | 606 | 124.5 |
| A | 0 | 31 | 5645 | 40.47 | 618 | 606 | 124.5 |
| B | 5 | 31 | 1565171 | 14131.2 | 589 | 576 | 110.7 |
| B | 5 | 15 | 748115 | 6751.67 | 589 | 576 | 110.7 |
| B | 5 | 14 | 553525 | 4994.16 | 589 | 576 | 110.7 |
| C | 9 | 187 | 1642415 | 12608.77 | 564 | 568 | 130.2 |
| C | 0 | 10 | 126406 | 966.38 | 564 | 568 | 130.2 |
| C | 1 | 241 | 96363 | 735.67 | 564 | 568 | 130.2 |
| D | 8 | 195 | 1124700 | 7647.05 | 596 | 584 | 147.0 |
| D | 12 | 218 | 315666 | 2143.42 | 596 | 584 | 147.0 |
| D | 2 | 250 | 216516 | 1468.93 | 596 | 584 | 147.0 |
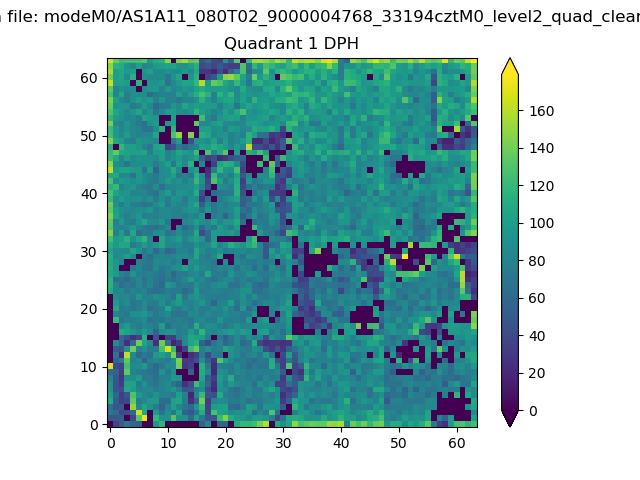
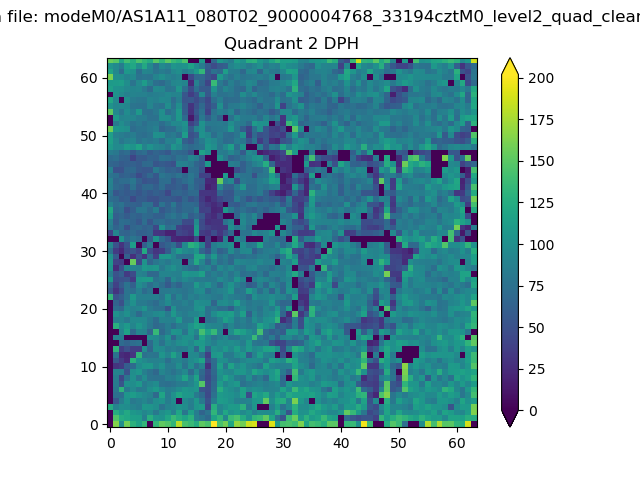
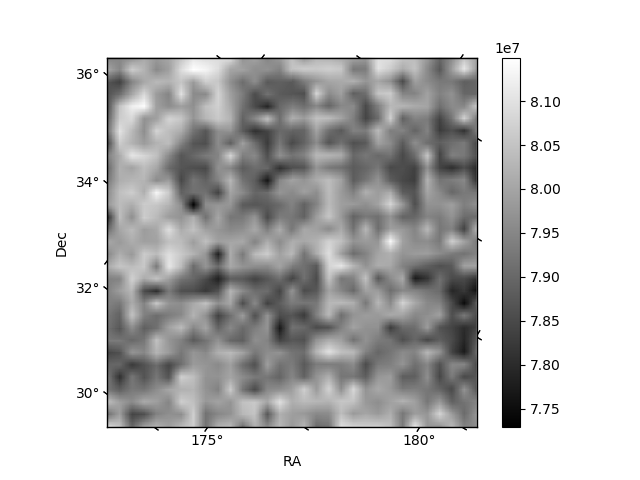
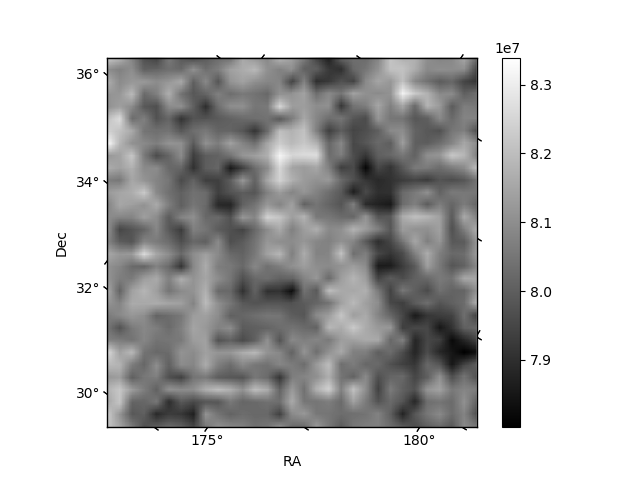
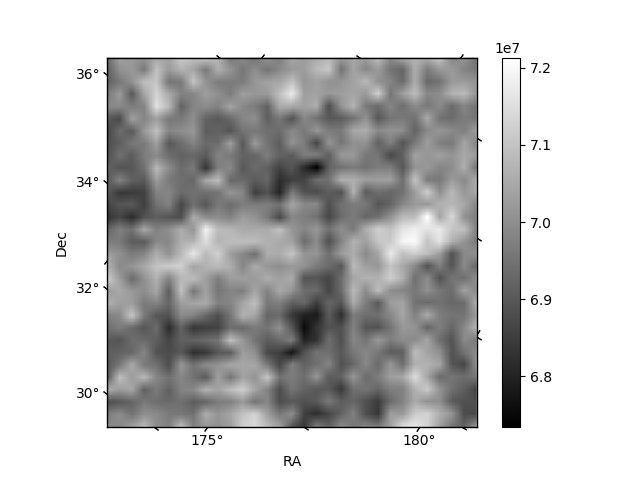
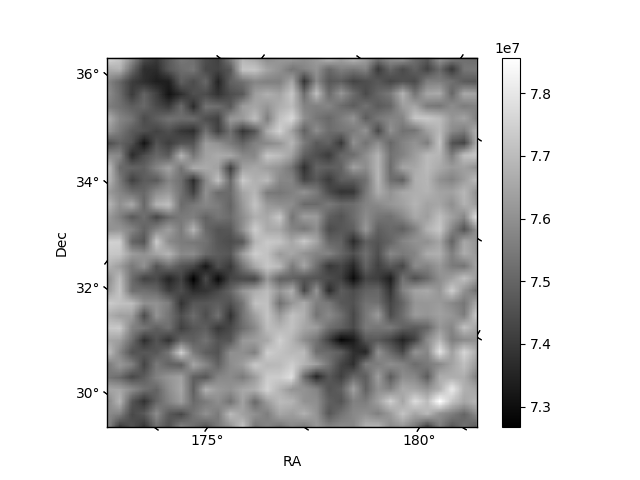
Histogram calculated using DETX and DETY for each event in the final _common_clean file
| Quadrant A |  |
 |
Quadrant B |
|---|---|---|---|
| Quadrant D |  |
 |
Quadrant C |
| Plot type | Count rate plots | Images |
|---|---|---|
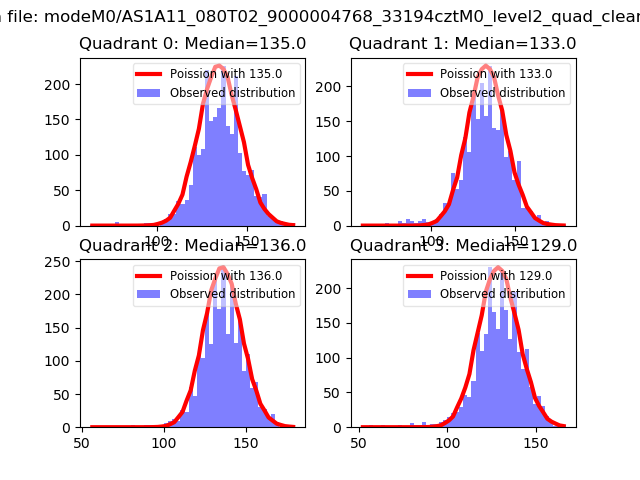
| Comparison with Poisson distribution Blue bars denote a histogram of data divided into 1 sec bins. Red curve is a Poisson curve with rate = median count rate of data. |
 |
 |
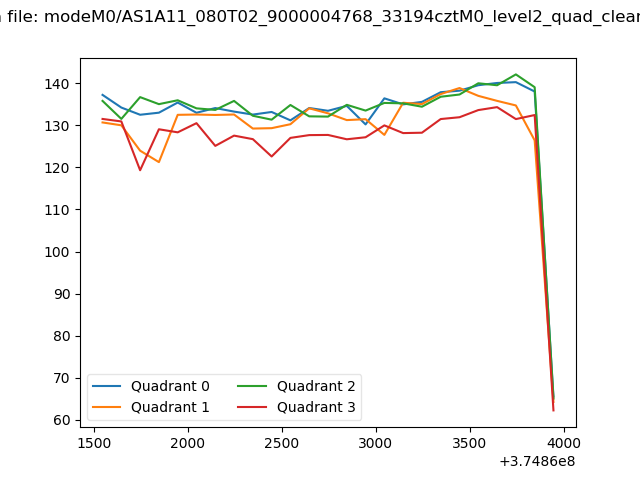
| Quadrant-wise count rates Data is divided into 100 sec bins |
 |
|
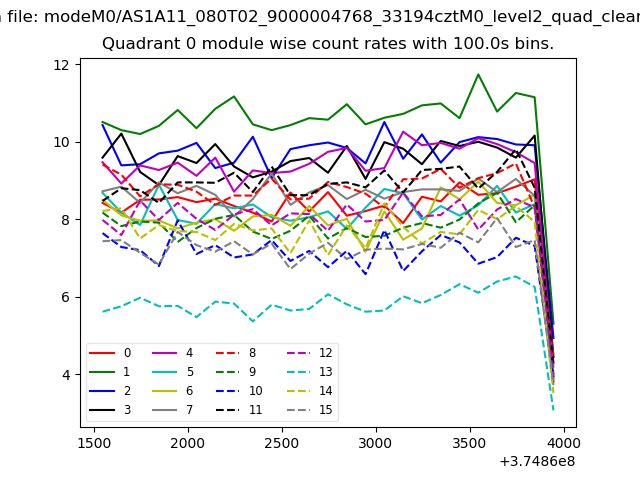
| Module-wise count rates for Quadrant A Data is divided into 100 sec bins |
 |
 |
| Module-wise count rates for Quadrant B Data is divided into 100 sec bins |
 |
 |
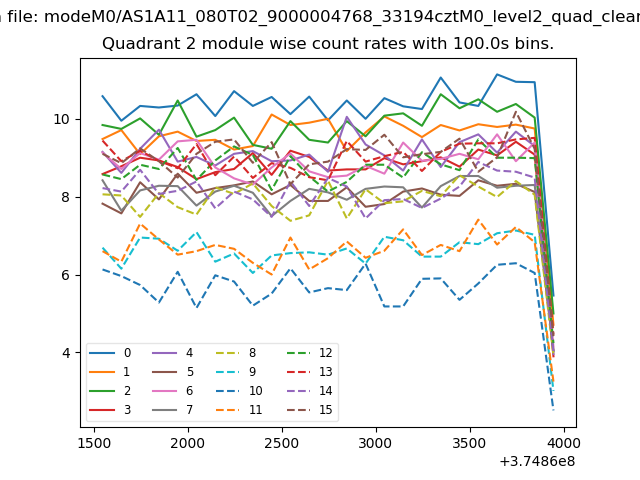
| Module-wise count rates for Quadrant C Data is divided into 100 sec bins |
 |
 |
| Module-wise count rates for Quadrant D Data is divided into 100 sec bins |
 |
 |
| Parameter | Plot |
|---|---|
| CZT HV Monitor |  |
| D_VDD | 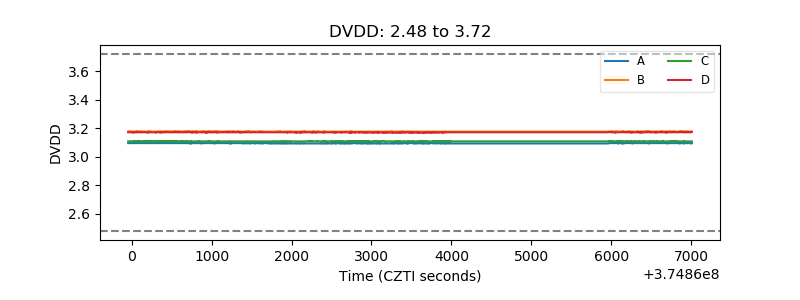 |
| Temperature 1 | 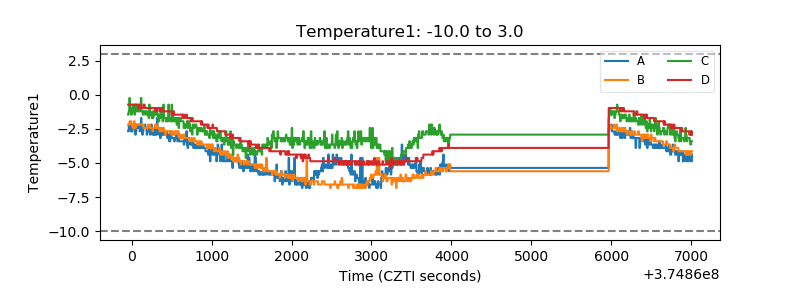 |
| Veto HV Monitor | 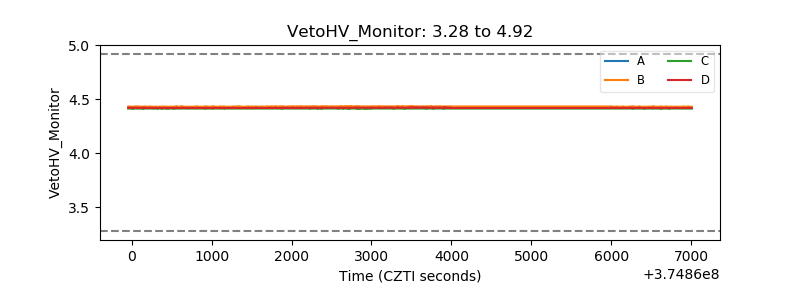 |
| Veto LLD |  |
| Alpha Counter | 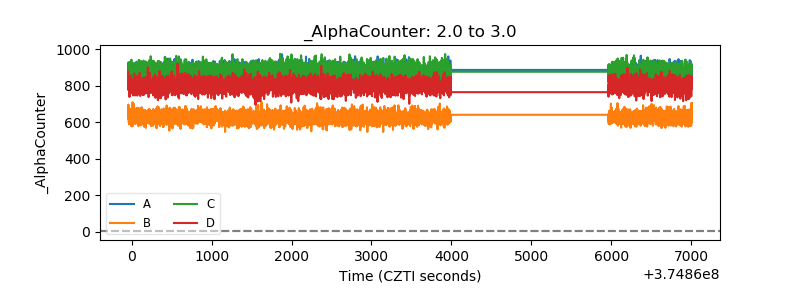 |
| _CPM_Rate | 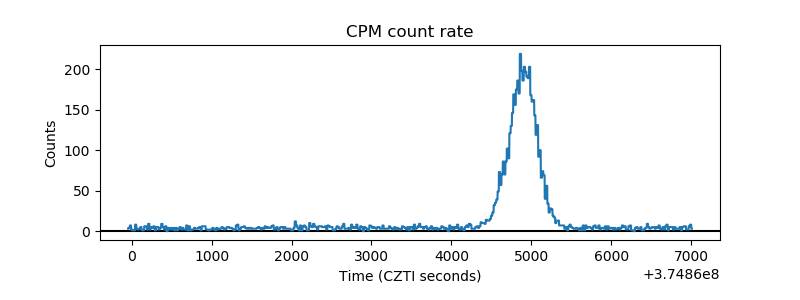 |
| CZT Counter |  |
| +2.5 Volts monitor |  |
| +5 Volts monitor |  |
| _ROLL_ROT | 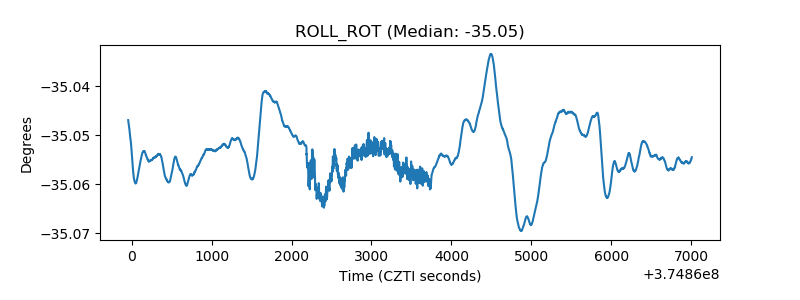 |
| _Roll_DEC | 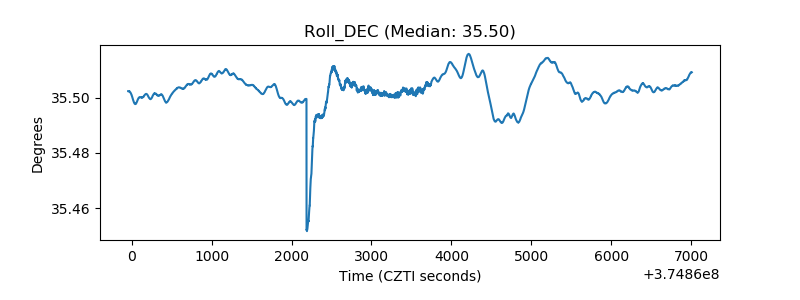 |
| _Roll_RA | 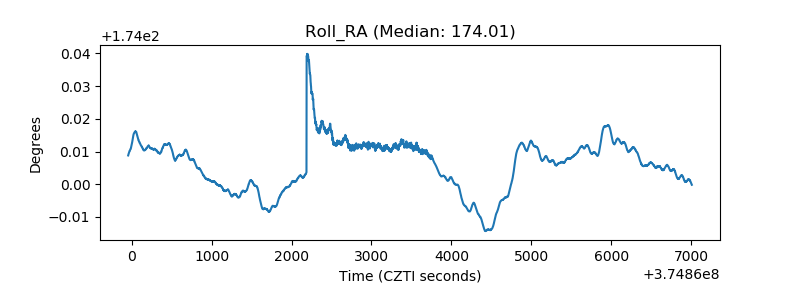 |
| Veto Counter | 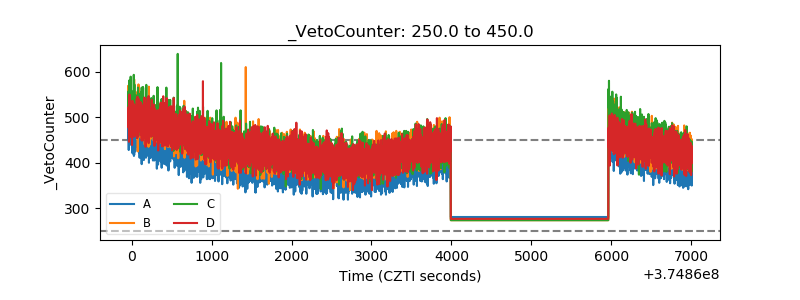 |