| Param | Original file | Final file |
|---|---|---|
| Filename | modeM0/AS1A11_080T02_9000004768_33195cztM0_level2.evt | modeM0/AS1A11_080T02_9000004768_33195cztM0_level2_quad_clean.evt |
| Size (bytes) | 394,920,000 | 48,709,440 |
| Size | 376.6 MB | 46.5 MB |
| Events in quadrant A | 1,735,363 | 311,788 |
| Events in quadrant B | 4,908,684 | 284,174 |
| Events in quadrant C | 2,102,614 | 307,144 |
| Events in quadrant D | 2,950,457 | 298,173 |
| Mode M9 | |||
|---|---|---|---|
| Quadrant | BADHDUFLAG | Total packets | Discarded packets |
| A | 0 | 7 | 0 |
| B | 0 | 7 | 0 |
| C | 0 | 7 | 0 |
| D | 0 | 8 | 0 |
| Mode SS | |||
|---|---|---|---|
| Quadrant | BADHDUFLAG | Total packets | Discarded packets |
| A | 0 | 78 | 0 |
| B | 0 | 78 | 0 |
| C | 0 | 78 | 0 |
| D | 0 | 78 | 0 |
| Mode M0 | |||
|---|---|---|---|
| Quadrant | BADHDUFLAG | Total packets | Discarded packets |
| A | 0 | 7759 | 1 |
| B | 0 | 17246 | 1 |
| C | 0 | 8860 | 1 |
| D | 0 | 11456 | 1 |
| Quadrant | Total seconds | Saturated seconds | Saturation percentage |
|---|---|---|---|
| A | 3863 | 3 | 0.077660% |
| B | 3863 | 1063 | 27.517473% |
| C | 3863 | 93 | 2.407455% |
| D | 3863 | 40 | 1.035465% |
Noise dominated data is calculated using 1-second bins in cleaned event files. If a bin has >2000 counts, and if more than 50% of those come from <1% of pixels, then it is considered to be noise-dominated and hence unusable.
| Quadrant | # 1 sec bins | Bins with >0 counts | Bins with >2000 counts | High rate bins dominated by noise | Noise dominated (total time) | Noise dominated (detector-on time) | Marked lightcurve |
|---|---|---|---|---|---|---|---|
| A | 3863 | 3863 | 0 | 0 | 0.00% | 0.00% | 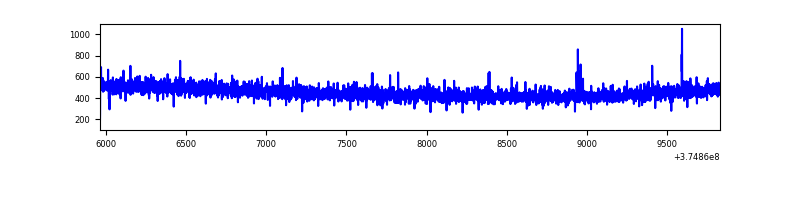 |
| B | 3863 | 3863 | 822 | 822 | 21.28% | 21.28% | 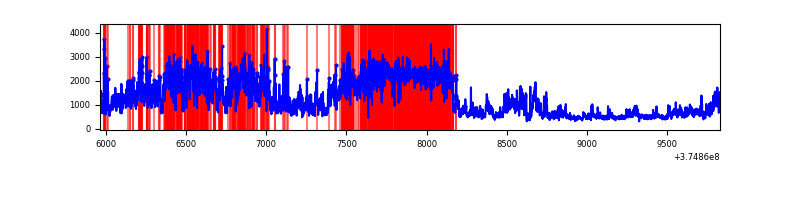 |
| C | 3863 | 3863 | 80 | 80 | 2.07% | 2.07% | 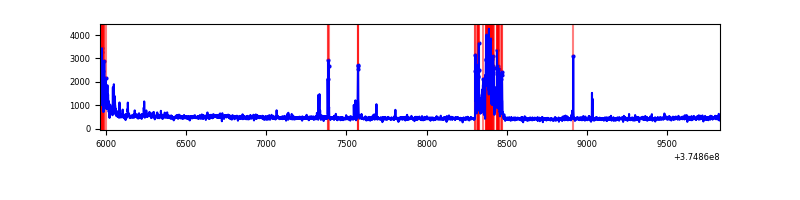 |
| D | 3863 | 3863 | 26 | 26 | 0.67% | 0.67% | 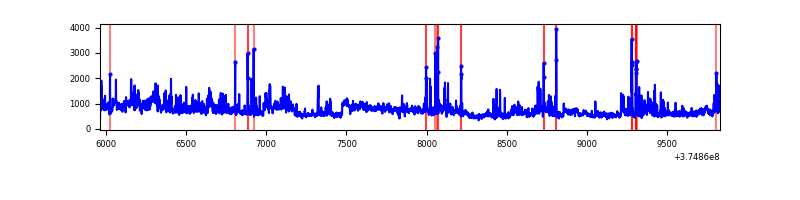 |
Top three noisy pixels from each quadrant. If the there are fewer than three noisy pixels in the level2.evt file, extra rows are filled as -1
| Pixel properties | Quadrant properties | ||||||
|---|---|---|---|---|---|---|---|
| Quadrant | DetID | PixID | Counts | Sigma | Mean | Median | Sigma |
| A | 13 | 6 | 7478 | 77.33 | 445 | 434 | 91.1 |
| A | 13 | 254 | 6951 | 71.54 | 445 | 434 | 91.1 |
| A | 12 | 227 | 4599 | 45.72 | 445 | 434 | 91.1 |
| B | 5 | 200 | 1146828 | 14385.16 | 414 | 403 | 79.7 |
| B | 5 | 31 | 877490 | 11005.55 | 414 | 403 | 79.7 |
| B | 5 | 15 | 428058 | 5366.14 | 414 | 403 | 79.7 |
| C | 1 | 241 | 237867 | 2382.82 | 429 | 432 | 99.6 |
| C | 0 | 10 | 114597 | 1145.72 | 429 | 432 | 99.6 |
| C | 9 | 187 | 50825 | 505.72 | 429 | 432 | 99.6 |
| D | 8 | 195 | 702460 | 6473.27 | 430 | 420 | 108.5 |
| D | 2 | 250 | 175859 | 1617.66 | 430 | 420 | 108.5 |
| D | 10 | 203 | 161617 | 1486.34 | 430 | 420 | 108.5 |
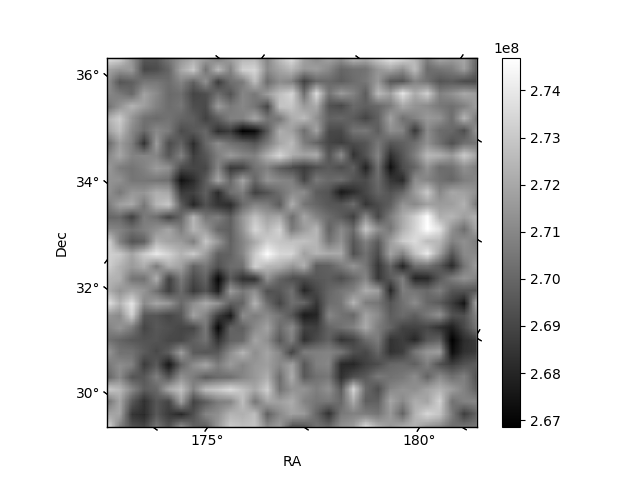
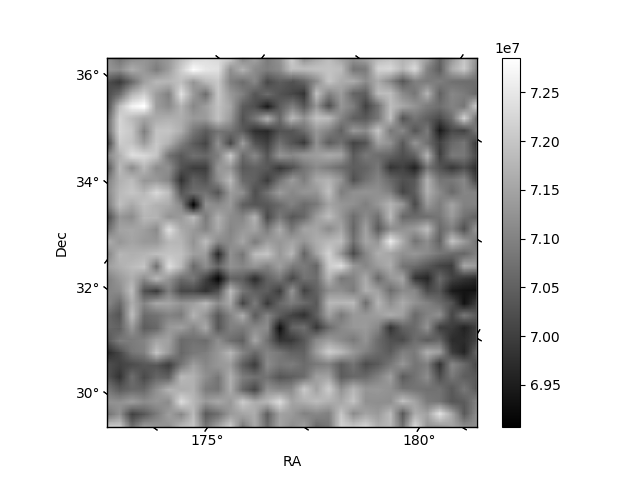
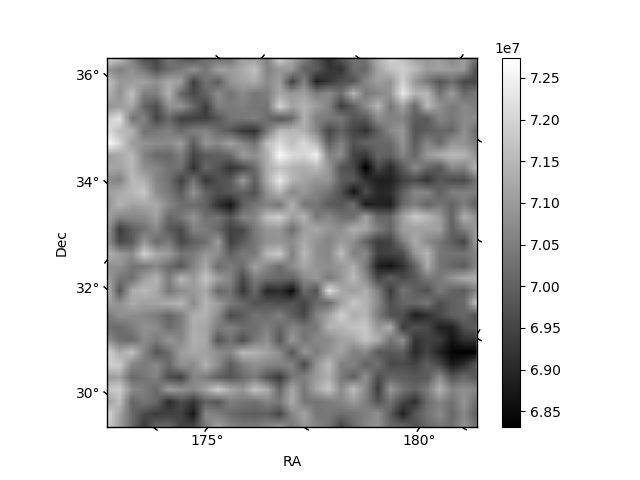
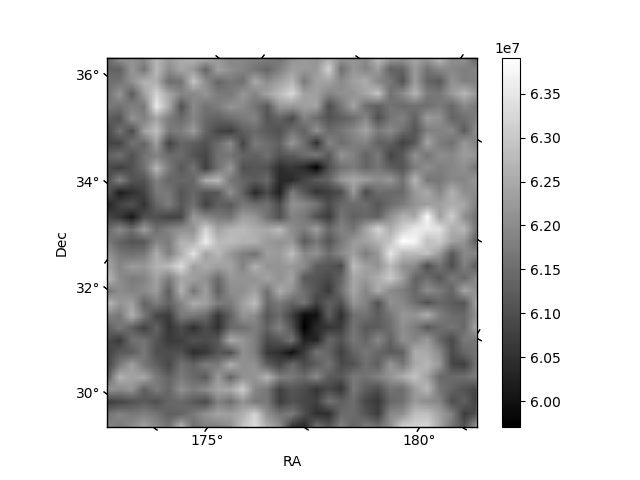
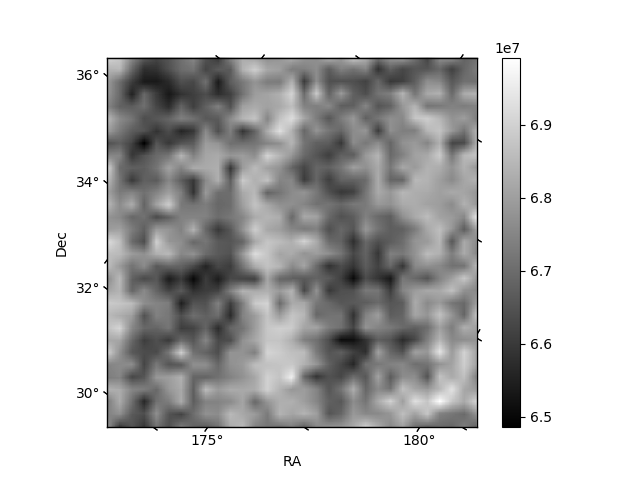
Histogram calculated using DETX and DETY for each event in the final _common_clean file
| Quadrant A | 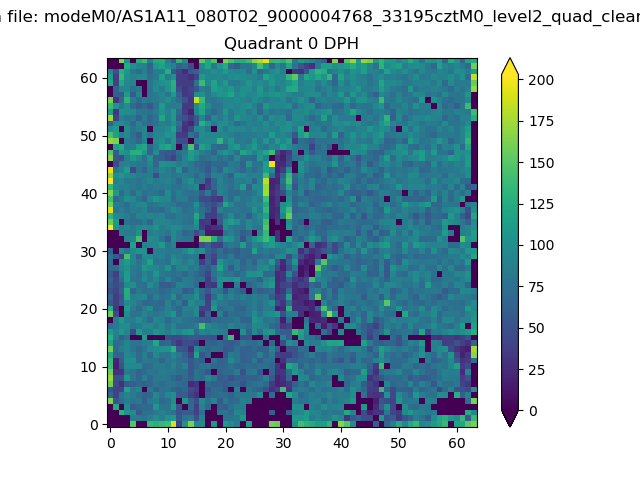 |
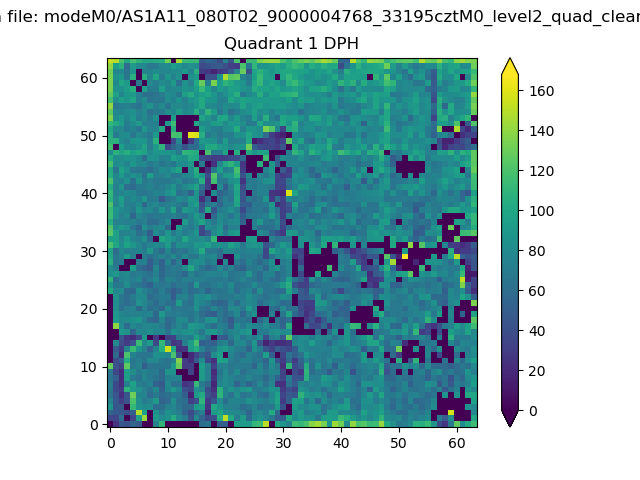 |
Quadrant B |
|---|---|---|---|
| Quadrant D |  |
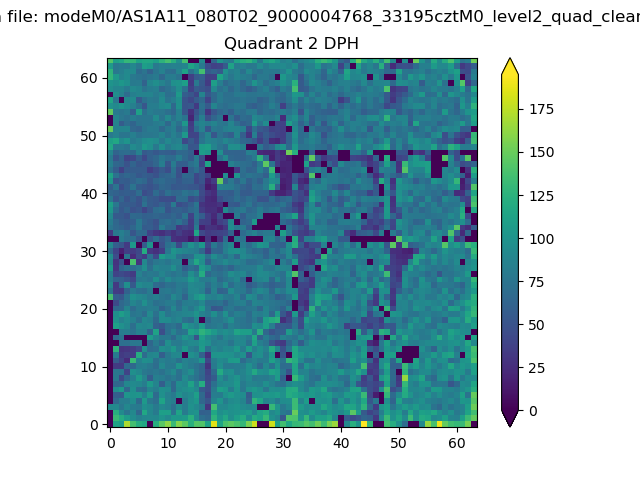 |
Quadrant C |
| Plot type | Count rate plots | Images |
|---|---|---|
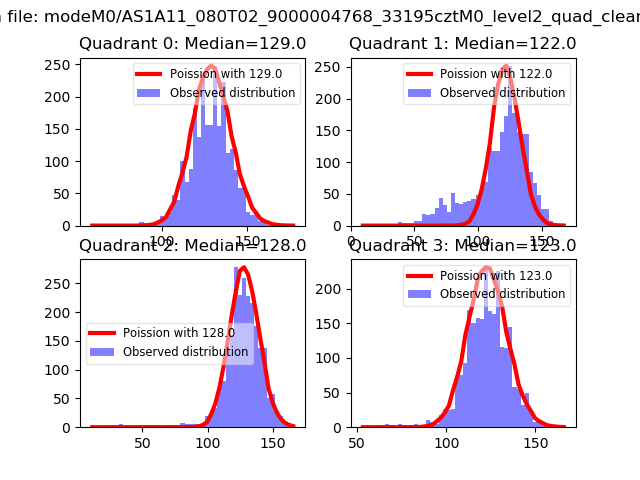
| Comparison with Poisson distribution Blue bars denote a histogram of data divided into 1 sec bins. Red curve is a Poisson curve with rate = median count rate of data. |
 |
 |
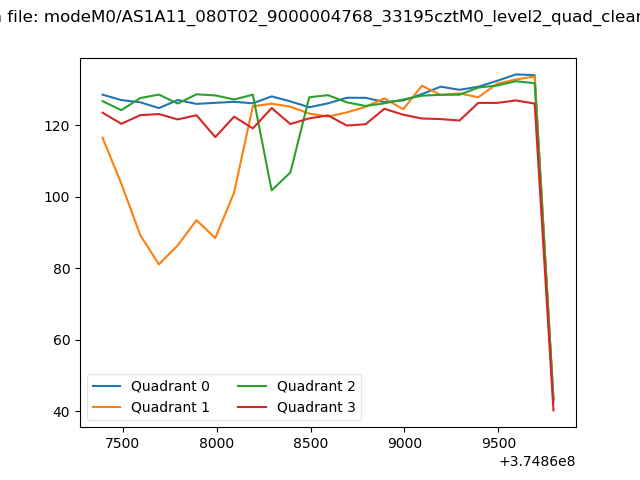
| Quadrant-wise count rates Data is divided into 100 sec bins |
 |
|
| Module-wise count rates for Quadrant A Data is divided into 100 sec bins |
 |
 |
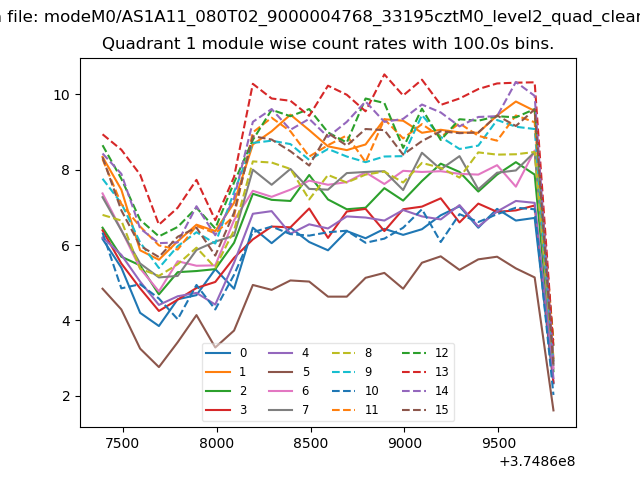
| Module-wise count rates for Quadrant B Data is divided into 100 sec bins |
 |
 |
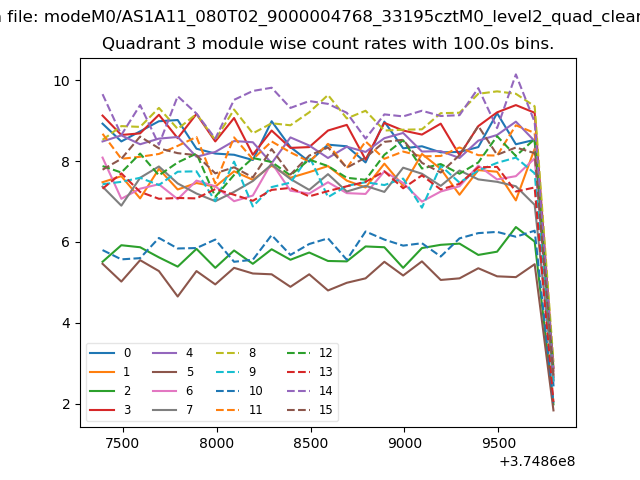
| Module-wise count rates for Quadrant C Data is divided into 100 sec bins |
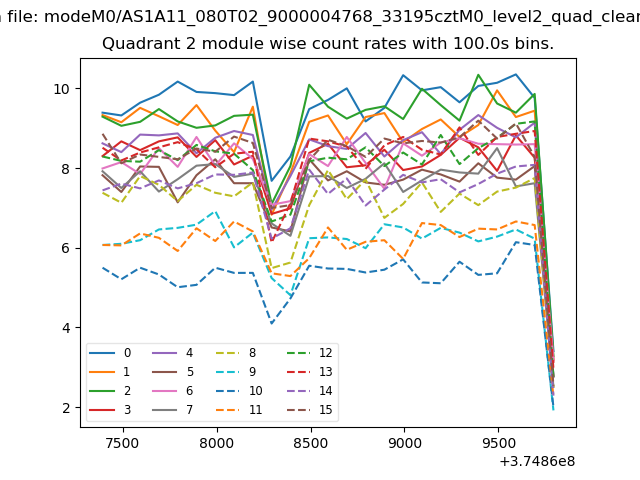 |
 |
| Module-wise count rates for Quadrant D Data is divided into 100 sec bins |
 |
 |
| Parameter | Plot |
|---|---|
| CZT HV Monitor | 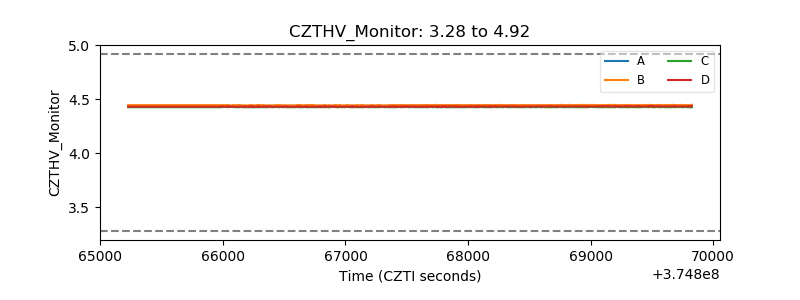 |
| D_VDD | 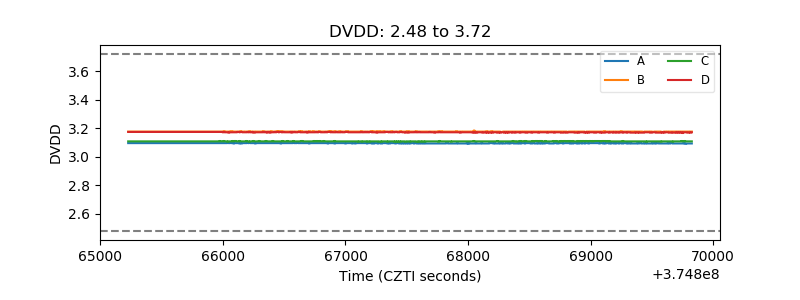 |
| Temperature 1 | 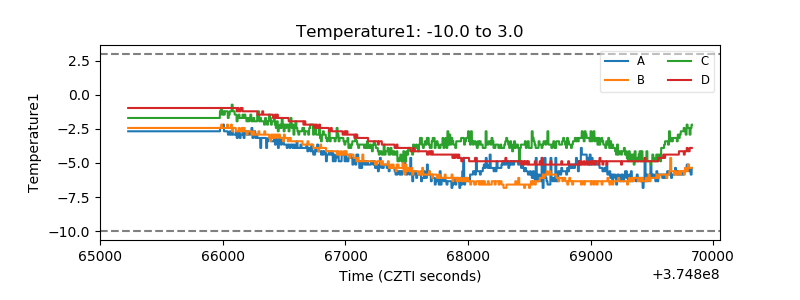 |
| Veto HV Monitor | 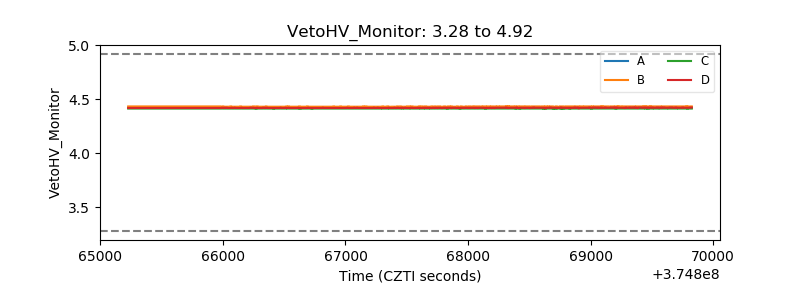 |
| Veto LLD | 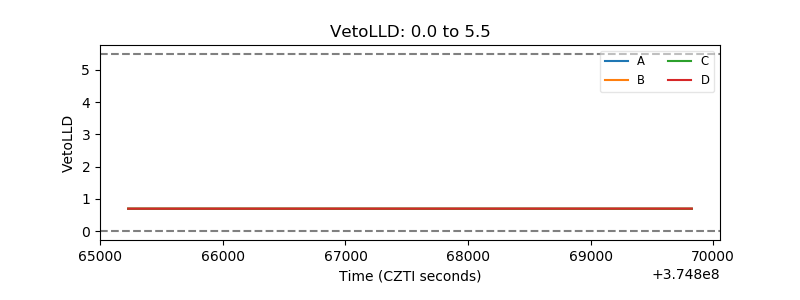 |
| Alpha Counter | 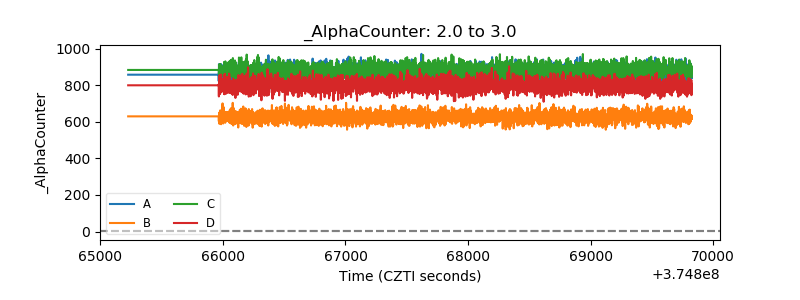 |
| _CPM_Rate | 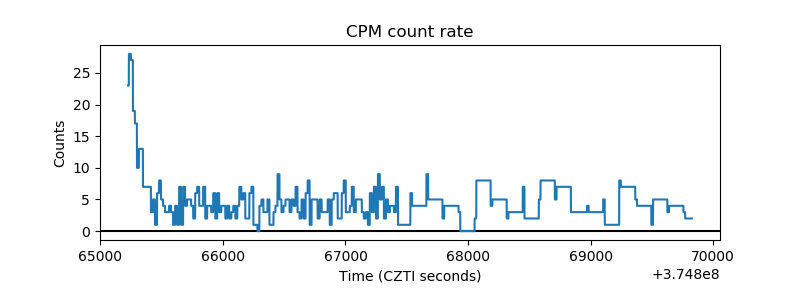 |
| CZT Counter | 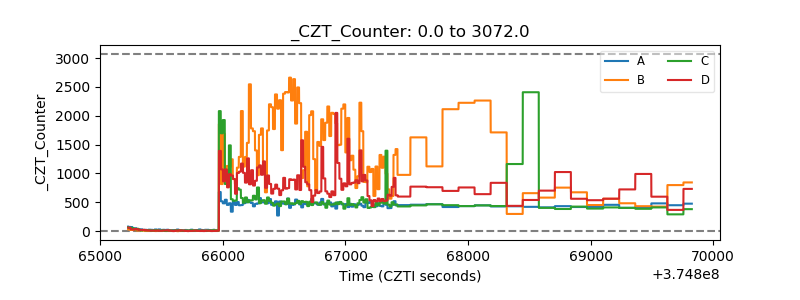 |
| +2.5 Volts monitor |  |
| +5 Volts monitor |  |
| _ROLL_ROT | 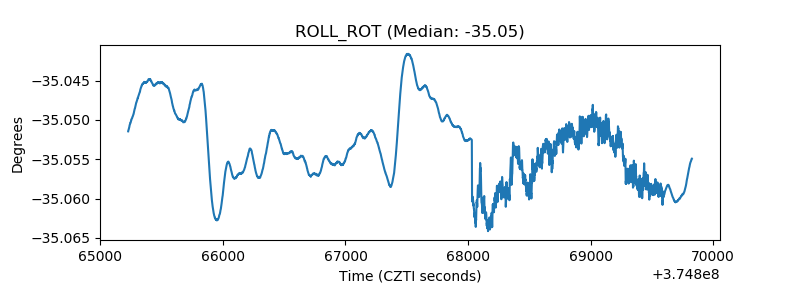 |
| _Roll_DEC | 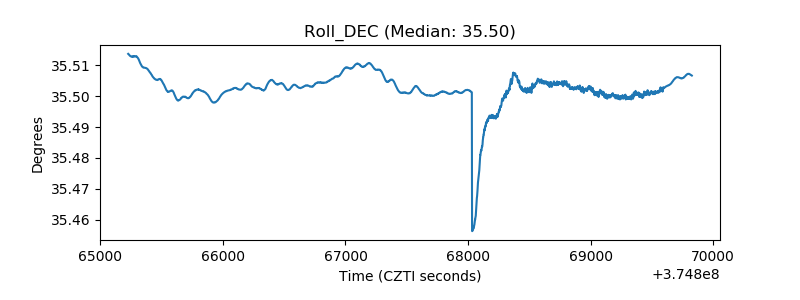 |
| _Roll_RA | 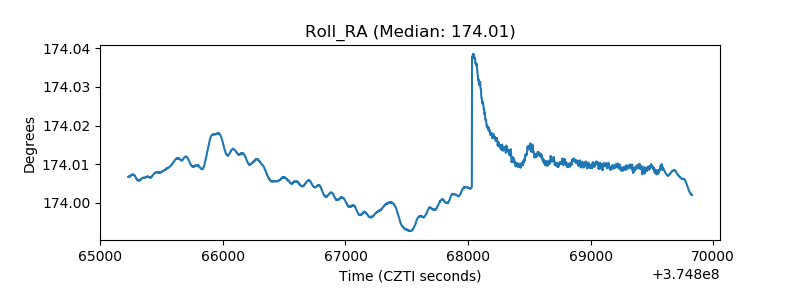 |
| Veto Counter | 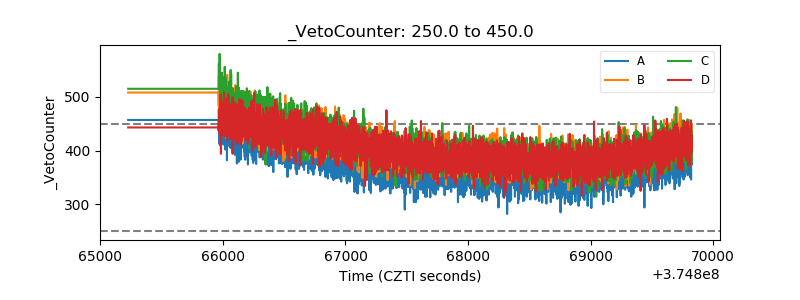 |