| Param | Original file | Final file |
|---|---|---|
| Filename | modeM0/AS1A10_067T01_9000004770cztM0_level2.fits | modeM0/AS1A10_067T01_9000004770cztM0_level2_quad_clean.evt |
| Size (bytes) | 284,618,880 | 287,795,520 |
| Size | 271.4 MB | 274.5 MB |
| Events in quadrant A | 1,774,618 | 1,778,871 |
| Events in quadrant B | 1,594,696 | 1,717,659 |
| Events in quadrant C | 1,701,395 | 1,647,030 |
| Events in quadrant D | 1,432,952 | 1,457,790 |
| Mode M9 | |||
|---|---|---|---|
| Quadrant | BADHDUFLAG | Total packets | Discarded packets |
| A | 0 | 113 | 0 |
| B | 0 | 112 | 0 |
| C | 0 | 112 | 0 |
| D | 0 | 111 | 0 |
| Mode M0 | |||
|---|---|---|---|
| Quadrant | BADHDUFLAG | Total packets | Discarded packets |
| A | 0 | 63055 | 0 |
| B | 0 | 91105 | 0 |
| C | 0 | 69337 | 0 |
| D | 0 | 108425 | 0 |
| Mode SS | |||
|---|---|---|---|
| Quadrant | BADHDUFLAG | Total packets | Discarded packets |
| A | 0 | 628 | 0 |
| B | 0 | 626 | 0 |
| C | 0 | 628 | 0 |
| D | 0 | 626 | 0 |
| Quadrant | Total seconds | Saturated seconds | Saturation percentage |
|---|---|---|---|
| A | 30790 | 70 | 0.227347% |
| B | 30778 | 2758 | 8.960946% |
| C | 30765 | 531 | 1.725987% |
| D | 30755 | 1775 | 5.771419% |
Noise dominated data is calculated using 1-second bins in cleaned event files. If a bin has >2000 counts, and if more than 50% of those come from <1% of pixels, then it is considered to be noise-dominated and hence unusable.
| Quadrant | # 1 sec bins | Bins with >0 counts | Bins with >2000 counts | High rate bins dominated by noise | Noise dominated (total time) | Noise dominated (detector-on time) | Marked lightcurve |
|---|---|---|---|---|---|---|---|
| A | 40425 | 30756 | 0 | 0 | 0.00% | 0.00% |  |
| B | 40425 | 30700 | 0 | 0 | 0.00% | 0.00% |  |
| C | 40425 | 30719 | 0 | 0 | 0.00% | 0.00% |  |
| D | 40425 | 30709 | 0 | 0 | 0.00% | 0.00% |  |
Top three noisy pixels from each quadrant. If the there are fewer than three noisy pixels in the level2.evt file, extra rows are filled as -1
| Pixel properties | Quadrant properties | ||||||
|---|---|---|---|---|---|---|---|
| Quadrant | DetID | PixID | Counts | Sigma | Mean | Median | Sigma |
| A | 9 | 19 | 1449 | 8.82 | 462 | 434 | 115.1 |
| A | 7 | 110 | 1439 | 8.73 | 462 | 434 | 115.1 |
| A | 0 | 29 | 1421 | 8.57 | 462 | 434 | 115.1 |
| B | 2 | 9 | 1396 | 11.58 | 423 | 403 | 85.7 |
| B | 3 | 80 | 1223 | 9.57 | 423 | 403 | 85.7 |
| B | 2 | 8 | 1140 | 8.6 | 423 | 403 | 85.7 |
| C | 1 | 81 | 1428 | 8.78 | 450 | 422 | 114.5 |
| C | 1 | 80 | 1386 | 8.42 | 450 | 422 | 114.5 |
| C | 3 | 187 | 1158 | 6.43 | 450 | 422 | 114.5 |
| D | 6 | 38 | 1101 | 6.53 | 411 | 376 | 111.0 |
| D | 10 | 189 | 1070 | 6.25 | 411 | 376 | 111.0 |
| D | 4 | 160 | 1047 | 6.04 | 411 | 376 | 111.0 |
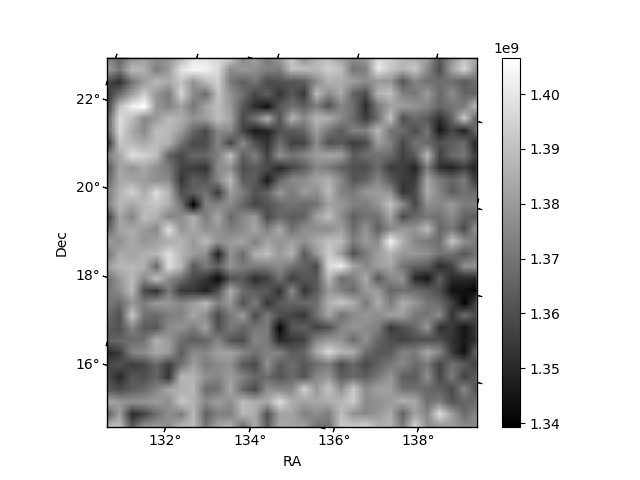
Histogram calculated using DETX and DETY for each event in the final _common_clean file
| Quadrant A |  |
 |
Quadrant B |
|---|---|---|---|
| Quadrant D |  |
 |
Quadrant C |
| Plot type | Count rate plots | Images |
|---|---|---|
| Comparison with Poisson distribution Blue bars denote a histogram of data divided into 1 sec bins. Red curve is a Poisson curve with rate = median count rate of data. |
 |
 |
| Quadrant-wise count rates Data is divided into 100 sec bins |
 |
|
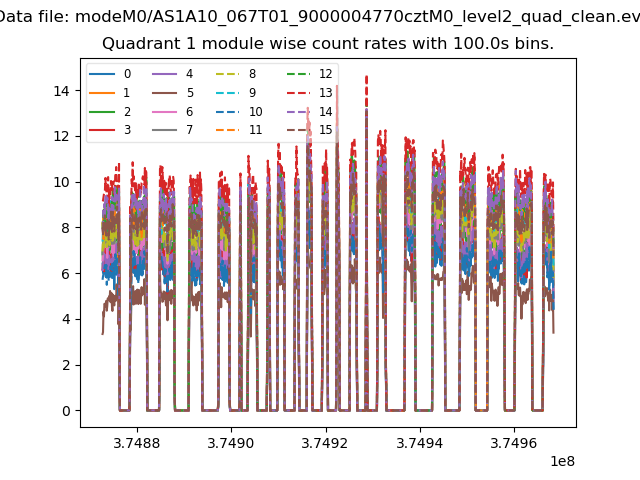
| Module-wise count rates for Quadrant A Data is divided into 100 sec bins |
 |
 |
| Module-wise count rates for Quadrant B Data is divided into 100 sec bins |
 |
 |
| Module-wise count rates for Quadrant C Data is divided into 100 sec bins |
 |
 |
| Module-wise count rates for Quadrant D Data is divided into 100 sec bins |
 |
 |
| Parameter | Plot |
|---|---|
| CZT HV Monitor |  |
| D_VDD |  |
| Temperature 1 | 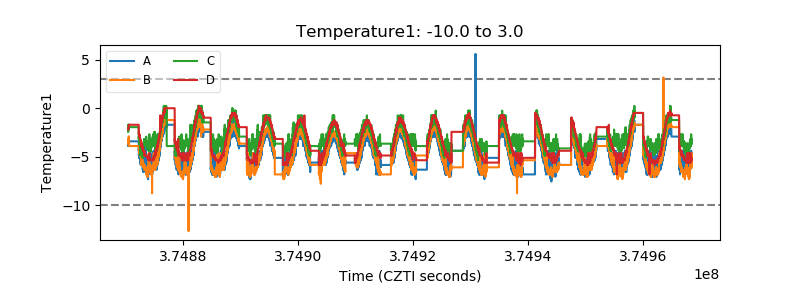 |
| Veto HV Monitor |  |
| Veto LLD |  |
| Alpha Counter | 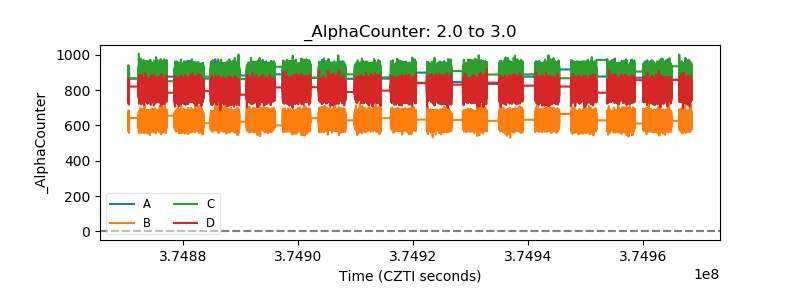 |
| _CPM_Rate |  |
| CZT Counter |  |
| +2.5 Volts monitor |  |
| +5 Volts monitor |  |
| _ROLL_ROT |  |
| _Roll_DEC | 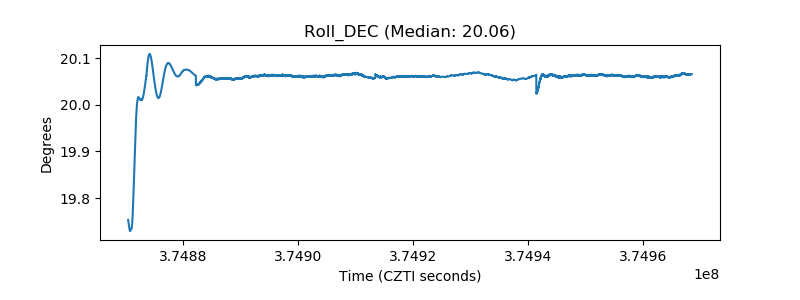 |
| _Roll_RA | 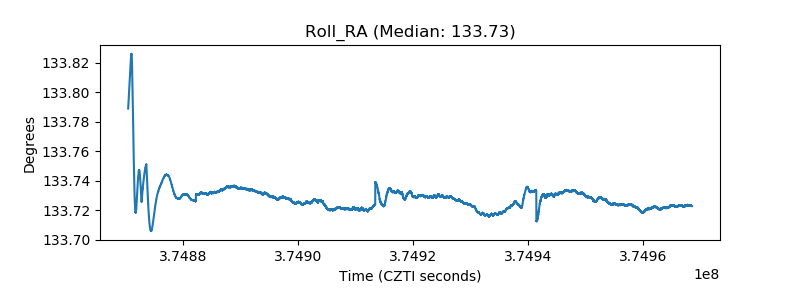 |
| Veto Counter |  |