| Param | Original file | Final file |
|---|---|---|
| Filename | modeM0/AS1A10_067T01_9000004770_33195cztM0_level2.evt | modeM0/AS1A10_067T01_9000004770_33195cztM0_level2_quad_clean.evt |
| Size (bytes) | 115,312,320 | 9,817,920 |
| Size | 110.0 MB | 9.4 MB |
| Events in quadrant A | 483,133 | 58,048 |
| Events in quadrant B | 1,598,957 | 50,987 |
| Events in quadrant C | 642,863 | 55,936 |
| Events in quadrant D | 697,903 | 55,952 |
| Mode M9 | |||
|---|---|---|---|
| Quadrant | BADHDUFLAG | Total packets | Discarded packets |
| A | 0 | 17 | 0 |
| B | 0 | 17 | 0 |
| C | 0 | 17 | 0 |
| D | 0 | 17 | 0 |
| Mode M0 | |||
|---|---|---|---|
| Quadrant | BADHDUFLAG | Total packets | Discarded packets |
| A | 0 | 1983 | 2 |
| B | 0 | 5428 | 1 |
| C | 0 | 2487 | 1 |
| D | 0 | 2802 | 1 |
| Mode SS | |||
|---|---|---|---|
| Quadrant | BADHDUFLAG | Total packets | Discarded packets |
| A | 0 | 22 | 0 |
| B | 0 | 22 | 0 |
| C | 0 | 22 | 0 |
| D | 0 | 22 | 0 |
| Quadrant | Total seconds | Saturated seconds | Saturation percentage |
|---|---|---|---|
| A | 978 | 1 | 0.102249% |
| B | 978 | 421 | 43.047035% |
| C | 978 | 55 | 5.623722% |
| D | 978 | 7 | 0.715746% |
Noise dominated data is calculated using 1-second bins in cleaned event files. If a bin has >2000 counts, and if more than 50% of those come from <1% of pixels, then it is considered to be noise-dominated and hence unusable.
| Quadrant | # 1 sec bins | Bins with >0 counts | Bins with >2000 counts | High rate bins dominated by noise | Noise dominated (total time) | Noise dominated (detector-on time) | Marked lightcurve |
|---|---|---|---|---|---|---|---|
| A | 2651 | 979 | 0 | 0 | 0.00% | 0.00% | 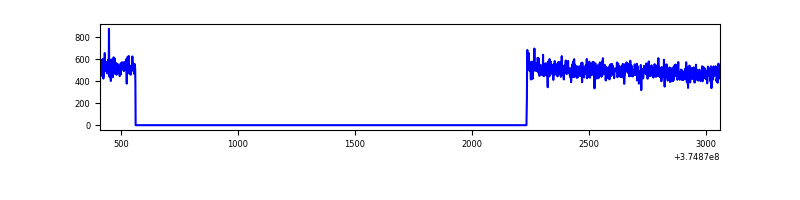 |
| B | 2651 | 979 | 261 | 261 | 9.85% | 26.66% | 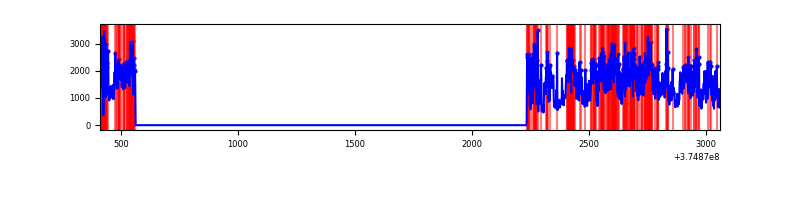 |
| C | 2651 | 979 | 36 | 36 | 1.36% | 3.68% |  |
| D | 2651 | 979 | 3 | 3 | 0.11% | 0.31% | 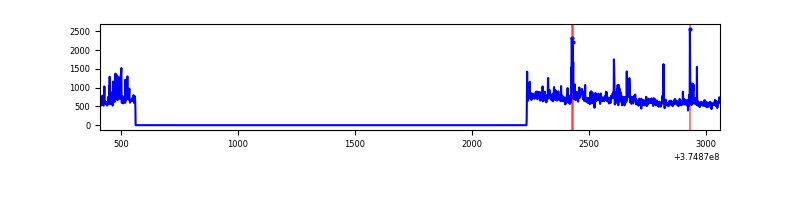 |
Top three noisy pixels from each quadrant. If the there are fewer than three noisy pixels in the level2.evt file, extra rows are filled as -1
| Pixel properties | Quadrant properties | ||||||
|---|---|---|---|---|---|---|---|
| Quadrant | DetID | PixID | Counts | Sigma | Mean | Median | Sigma |
| A | 13 | 6 | 2893 | 101.6 | 123 | 120 | 27.3 |
| A | 13 | 254 | 1808 | 61.85 | 123 | 120 | 27.3 |
| A | 3 | 137 | 1317 | 43.86 | 123 | 120 | 27.3 |
| B | 5 | 31 | 426071 | 18388.59 | 109 | 106 | 23.2 |
| B | 5 | 172 | 215051 | 9279.01 | 109 | 106 | 23.2 |
| B | 5 | 15 | 199324 | 8600.09 | 109 | 106 | 23.2 |
| C | 0 | 10 | 102577 | 3515.91 | 117 | 118 | 29.1 |
| C | 1 | 23 | 49798 | 1704.77 | 117 | 118 | 29.1 |
| C | 1 | 241 | 13921 | 473.64 | 117 | 118 | 29.1 |
| D | 8 | 195 | 61144 | 1992.78 | 120 | 117 | 30.6 |
| D | 2 | 250 | 45981 | 1497.65 | 120 | 117 | 30.6 |
| D | 10 | 203 | 42819 | 1394.4 | 120 | 117 | 30.6 |
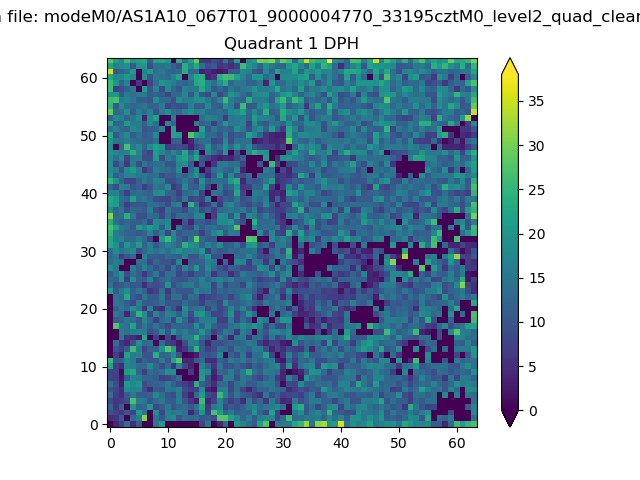
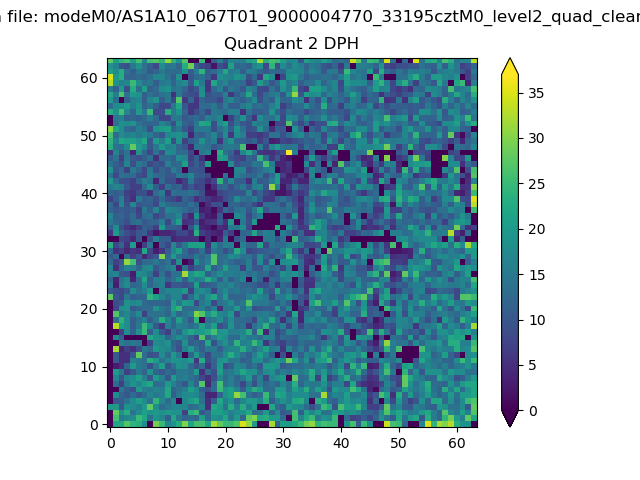
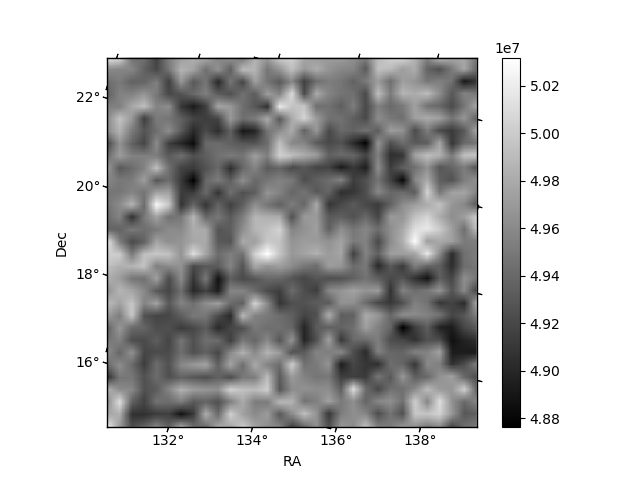
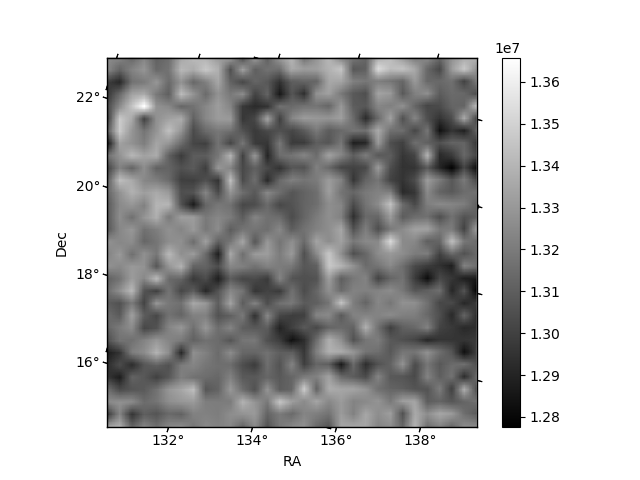
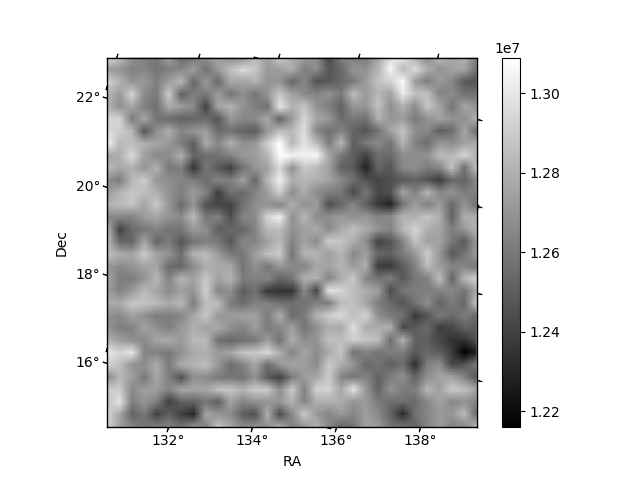
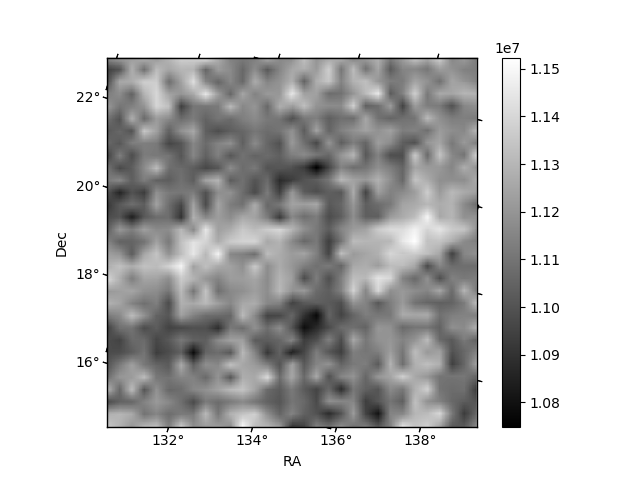
Histogram calculated using DETX and DETY for each event in the final _common_clean file
| Quadrant A | 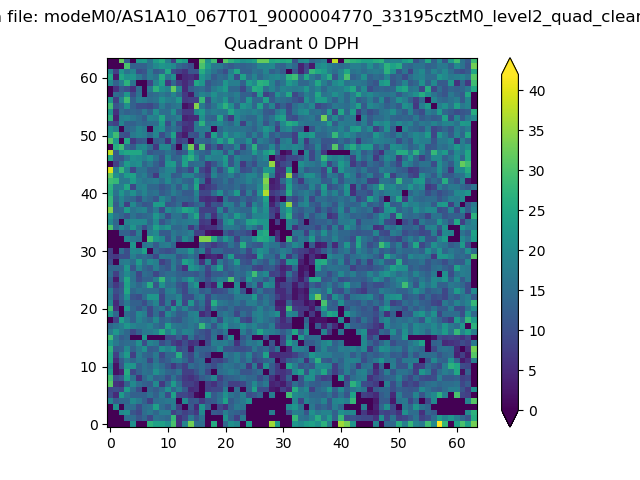 |
 |
Quadrant B |
|---|---|---|---|
| Quadrant D | 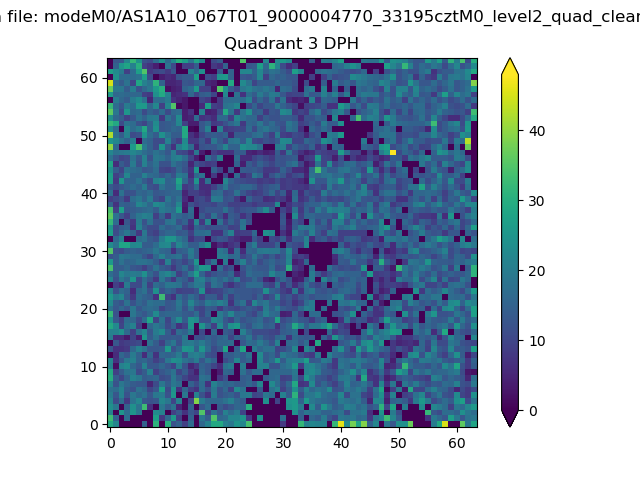 |
 |
Quadrant C |
| Plot type | Count rate plots | Images |
|---|---|---|
| Comparison with Poisson distribution Blue bars denote a histogram of data divided into 1 sec bins. Red curve is a Poisson curve with rate = median count rate of data. |
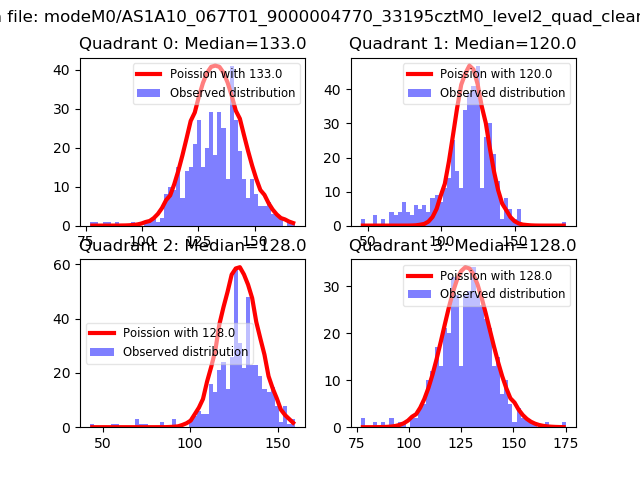 |
 |
| Quadrant-wise count rates Data is divided into 100 sec bins |
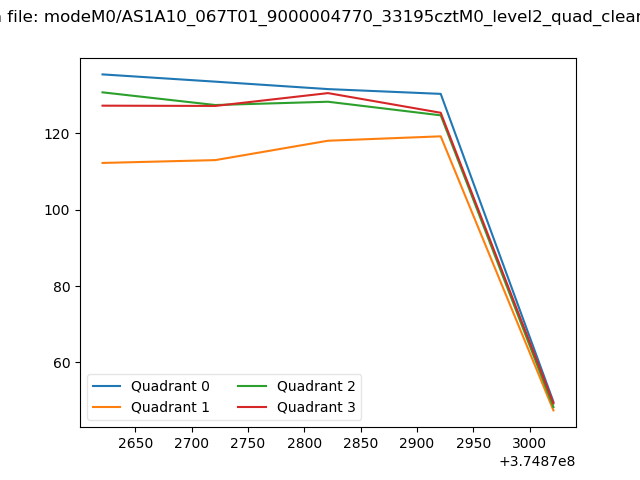 |
|
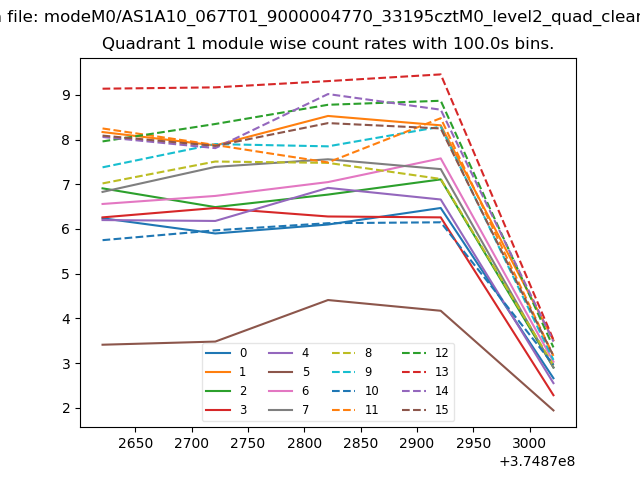
| Module-wise count rates for Quadrant A Data is divided into 100 sec bins |
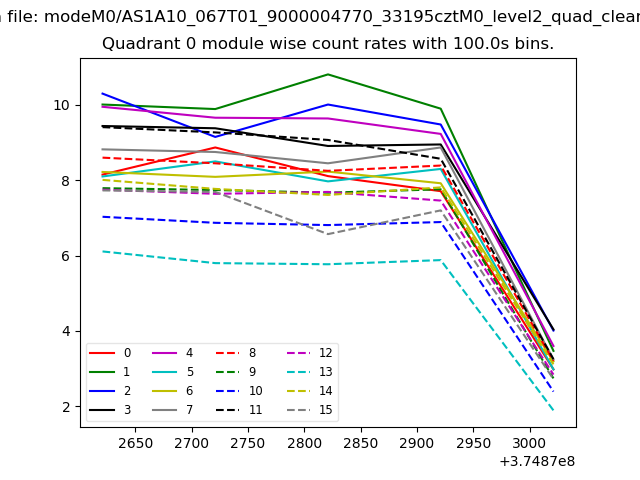 |
 |
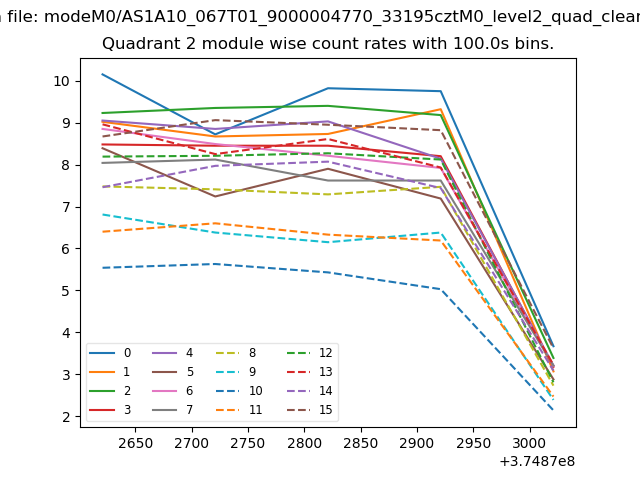
| Module-wise count rates for Quadrant B Data is divided into 100 sec bins |
 |
 |
| Module-wise count rates for Quadrant C Data is divided into 100 sec bins |
 |
 |
| Module-wise count rates for Quadrant D Data is divided into 100 sec bins |
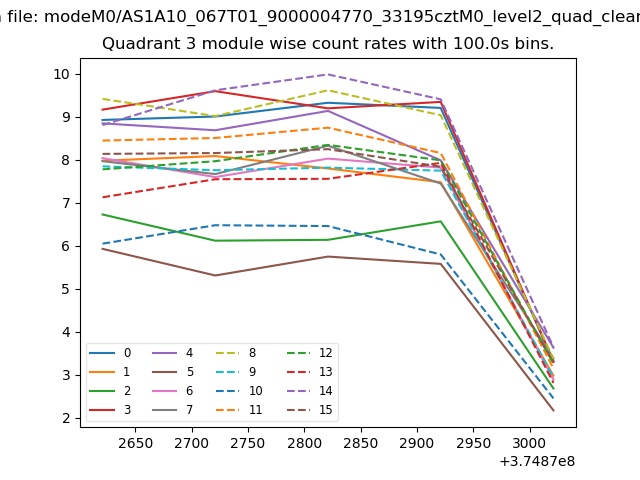 |
 |
| Parameter | Plot |
|---|---|
| CZT HV Monitor | 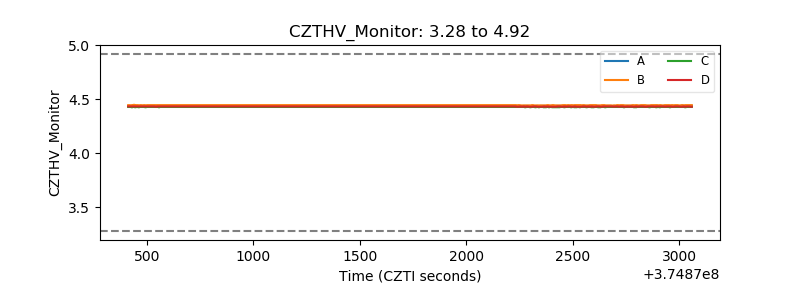 |
| D_VDD | 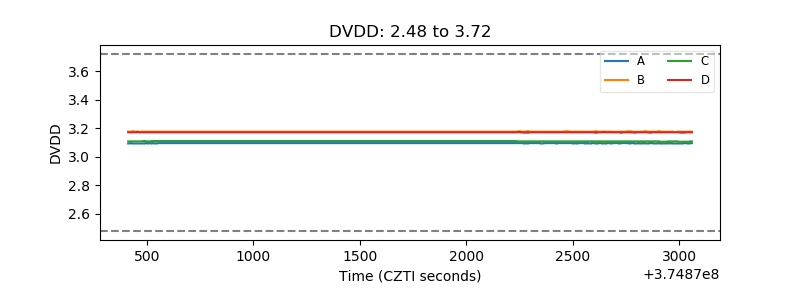 |
| Temperature 1 | 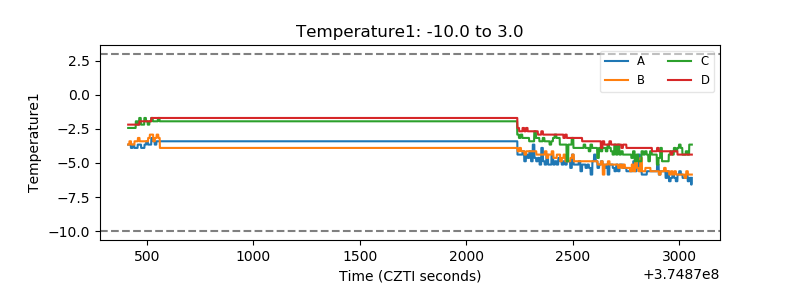 |
| Veto HV Monitor | 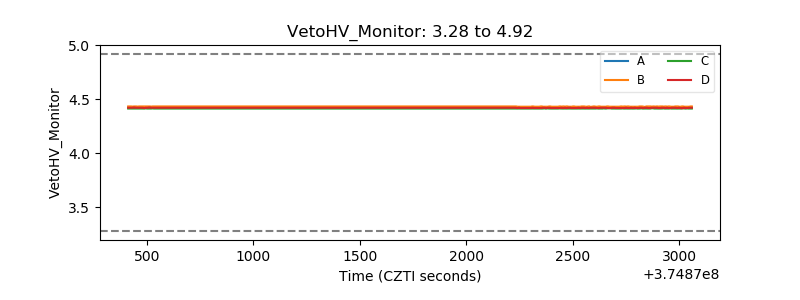 |
| Veto LLD | 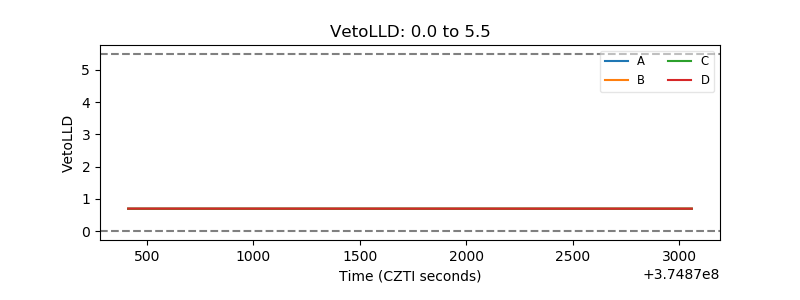 |
| Alpha Counter | 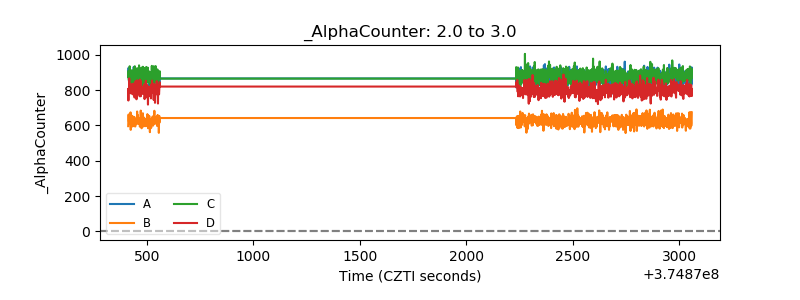 |
| _CPM_Rate | 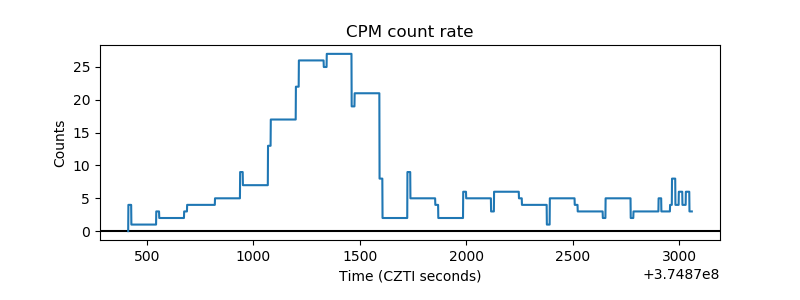 |
| CZT Counter | 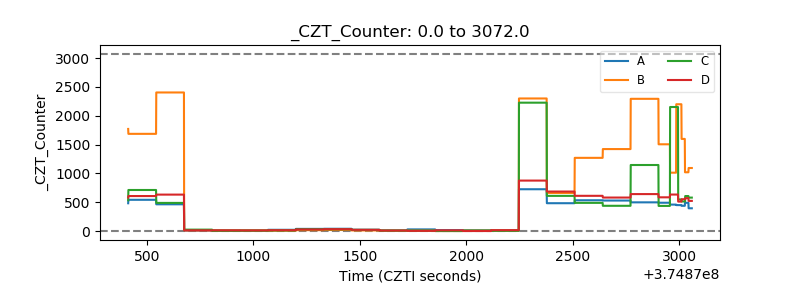 |
| +2.5 Volts monitor |  |
| +5 Volts monitor | 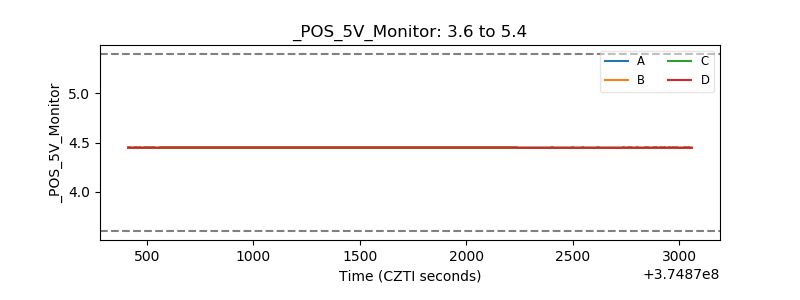 |
| _ROLL_ROT | 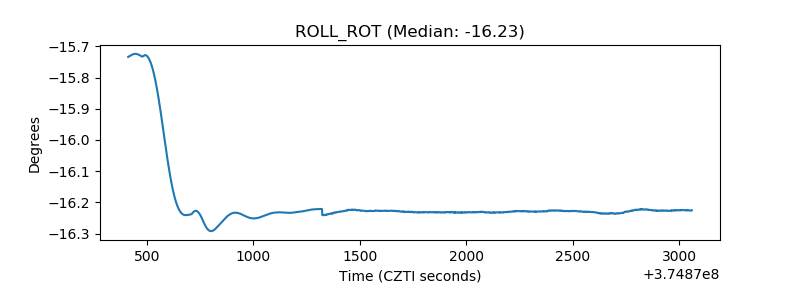 |
| _Roll_DEC | 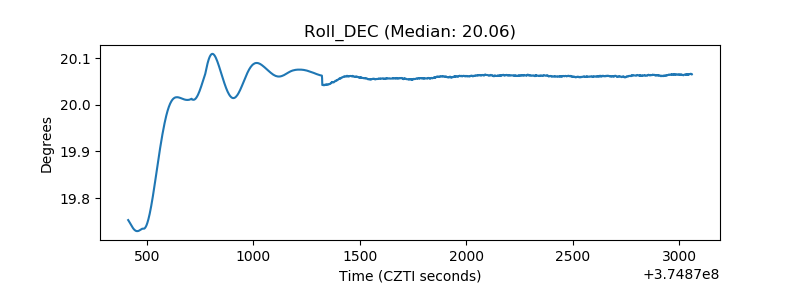 |
| _Roll_RA | 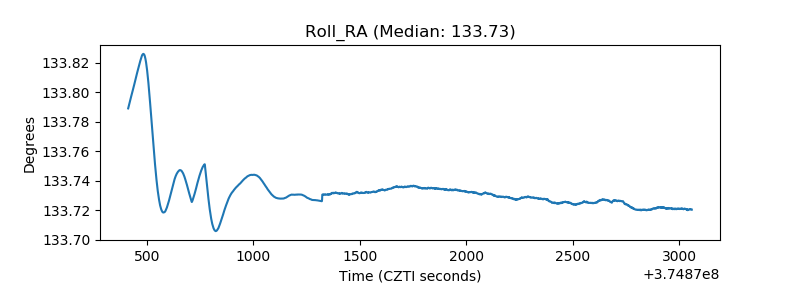 |
| Veto Counter | 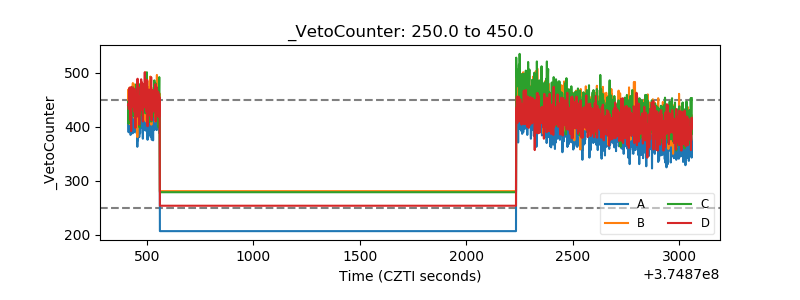 |