| Param | Original file | Final file |
|---|---|---|
| Filename | modeM0/AS1A10_067T01_9000004770_33197cztM0_level2.evt | modeM0/AS1A10_067T01_9000004770_33197cztM0_level2_quad_clean.evt |
| Size (bytes) | 536,431,680 | 86,696,640 |
| Size | 511.6 MB | 82.7 MB |
| Events in quadrant A | 2,702,877 | 569,058 |
| Events in quadrant B | 3,856,674 | 560,363 |
| Events in quadrant C | 3,046,939 | 556,613 |
| Events in quadrant D | 6,237,350 | 524,754 |
| Mode M9 | |||
|---|---|---|---|
| Quadrant | BADHDUFLAG | Total packets | Discarded packets |
| A | 0 | 20 | 0 |
| B | 0 | 20 | 0 |
| C | 0 | 20 | 0 |
| D | 0 | 21 | 0 |
| Mode M0 | |||
|---|---|---|---|
| Quadrant | BADHDUFLAG | Total packets | Discarded packets |
| A | 0 | 11998 | 3 |
| B | 0 | 15474 | 2 |
| C | 0 | 13004 | 2 |
| D | 0 | 22728 | 2 |
| Mode SS | |||
|---|---|---|---|
| Quadrant | BADHDUFLAG | Total packets | Discarded packets |
| A | 0 | 120 | 0 |
| B | 0 | 120 | 0 |
| C | 0 | 120 | 0 |
| D | 0 | 120 | 0 |
| Quadrant | Total seconds | Saturated seconds | Saturation percentage |
|---|---|---|---|
| A | 5937 | 12 | 0.202122% |
| B | 5937 | 435 | 7.326933% |
| C | 5937 | 45 | 0.757959% |
| D | 5937 | 365 | 6.147886% |
Noise dominated data is calculated using 1-second bins in cleaned event files. If a bin has >2000 counts, and if more than 50% of those come from <1% of pixels, then it is considered to be noise-dominated and hence unusable.
| Quadrant | # 1 sec bins | Bins with >0 counts | Bins with >2000 counts | High rate bins dominated by noise | Noise dominated (total time) | Noise dominated (detector-on time) | Marked lightcurve |
|---|---|---|---|---|---|---|---|
| A | 7219 | 5938 | 0 | 0 | 0.00% | 0.00% | 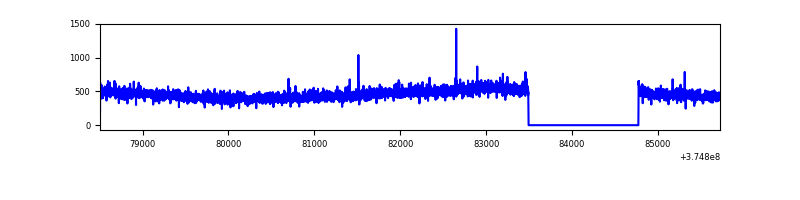 |
| B | 7219 | 5938 | 262 | 262 | 3.63% | 4.41% | 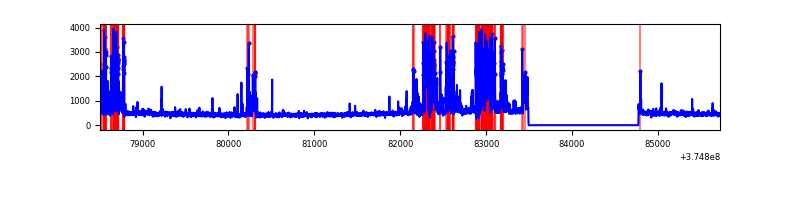 |
| C | 7219 | 5938 | 30 | 30 | 0.42% | 0.51% | 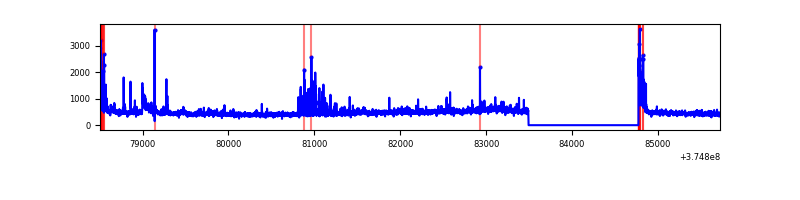 |
| D | 7219 | 5938 | 310 | 310 | 4.29% | 5.22% | 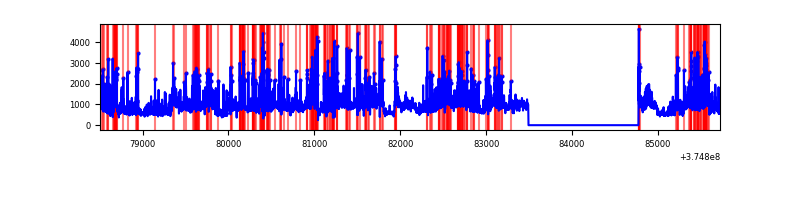 |
Top three noisy pixels from each quadrant. If the there are fewer than three noisy pixels in the level2.evt file, extra rows are filled as -1
| Pixel properties | Quadrant properties | ||||||
|---|---|---|---|---|---|---|---|
| Quadrant | DetID | PixID | Counts | Sigma | Mean | Median | Sigma |
| A | 13 | 254 | 11092 | 74.45 | 694 | 680 | 139.8 |
| A | 13 | 6 | 10478 | 70.06 | 694 | 680 | 139.8 |
| A | 3 | 137 | 6560 | 42.05 | 694 | 680 | 139.8 |
| B | 5 | 172 | 856873 | 6703.78 | 665 | 647 | 127.7 |
| B | 0 | 219 | 222500 | 1736.99 | 665 | 647 | 127.7 |
| B | 4 | 170 | 37916 | 291.8 | 665 | 647 | 127.7 |
| C | 0 | 10 | 149759 | 958.65 | 670 | 675 | 155.5 |
| C | 1 | 23 | 142362 | 911.09 | 670 | 675 | 155.5 |
| C | 14 | 67 | 49687 | 315.16 | 670 | 675 | 155.5 |
| D | 8 | 195 | 1417924 | 8173.32 | 655 | 641 | 173.4 |
| D | 2 | 250 | 643802 | 3709.04 | 655 | 641 | 173.4 |
| D | 2 | 249 | 476112 | 2741.99 | 655 | 641 | 173.4 |
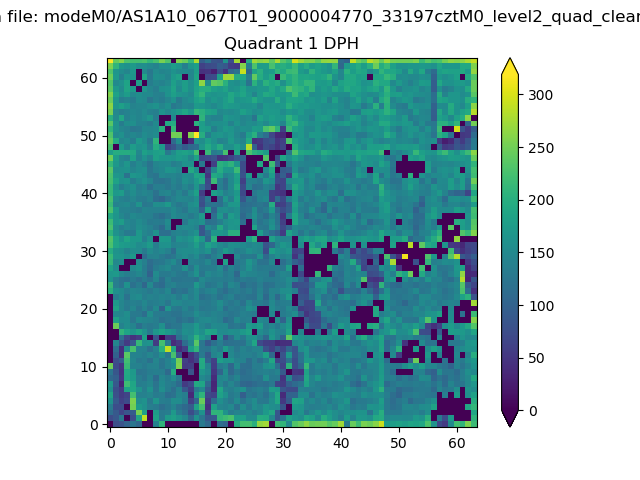
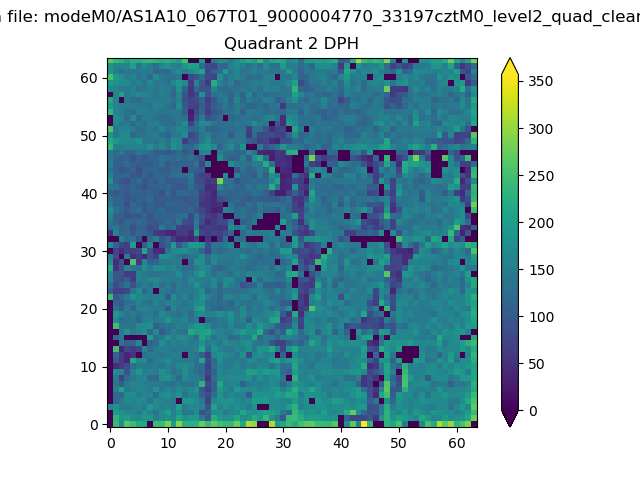
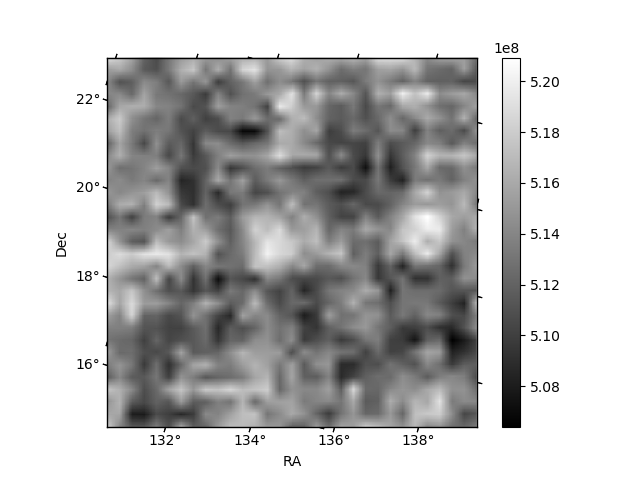
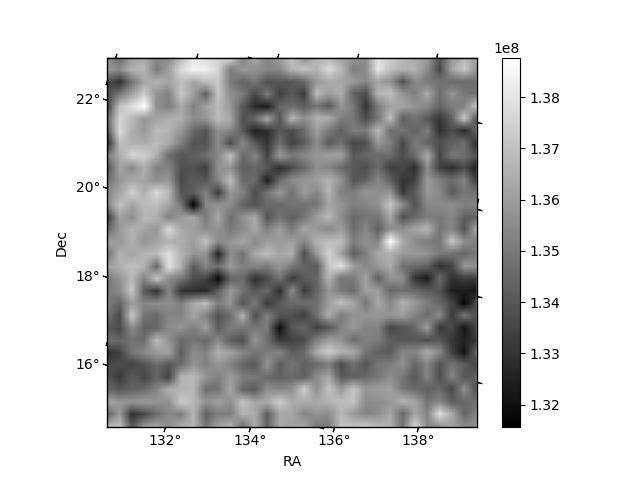
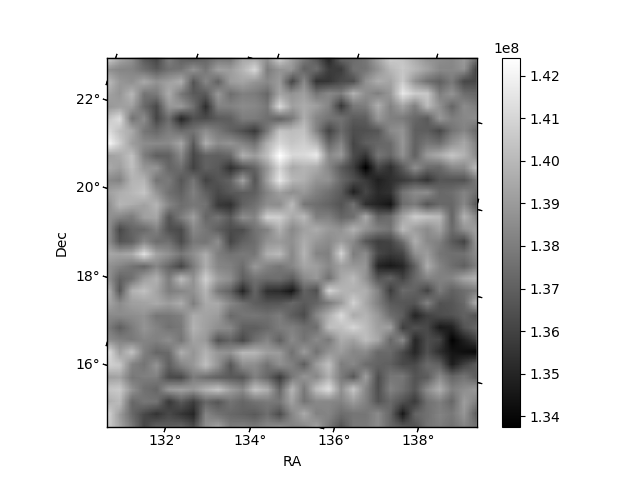
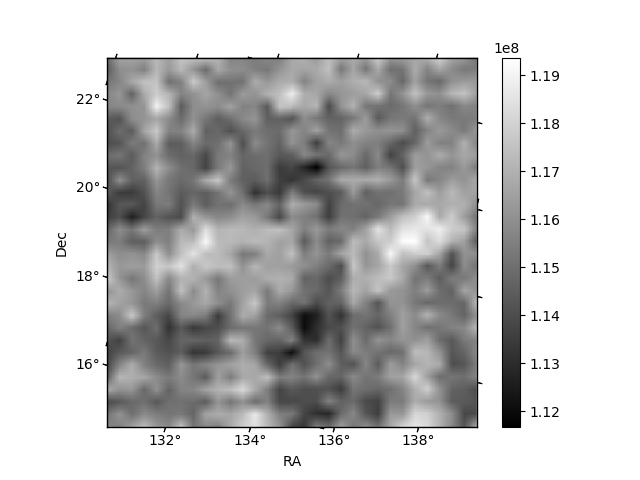
Histogram calculated using DETX and DETY for each event in the final _common_clean file
| Quadrant A |  |
 |
Quadrant B |
|---|---|---|---|
| Quadrant D | 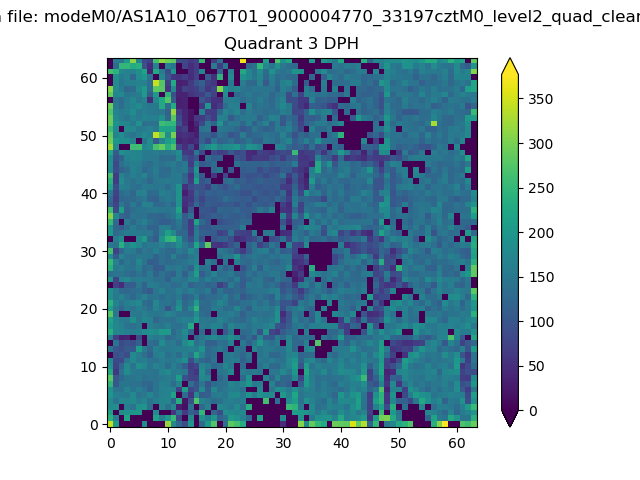 |
 |
Quadrant C |
| Plot type | Count rate plots | Images |
|---|---|---|
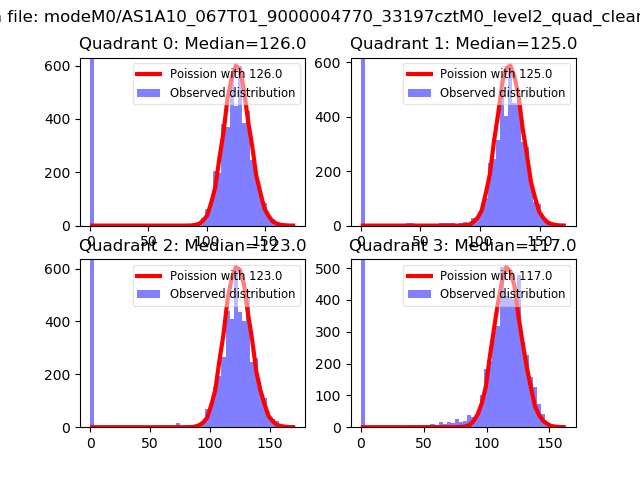
| Comparison with Poisson distribution Blue bars denote a histogram of data divided into 1 sec bins. Red curve is a Poisson curve with rate = median count rate of data. |
 |
 |
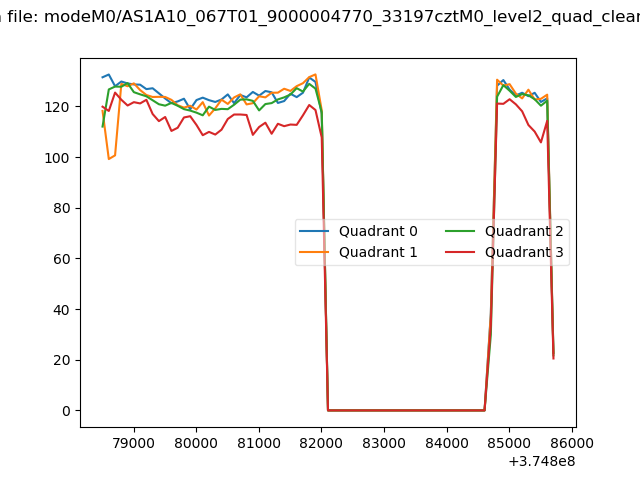
| Quadrant-wise count rates Data is divided into 100 sec bins |
 |
|
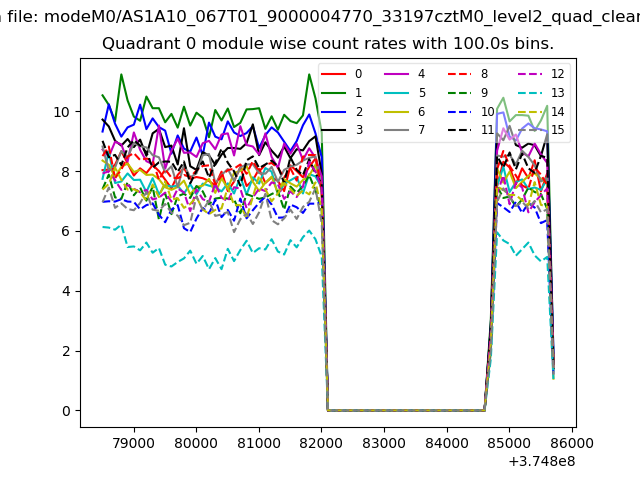
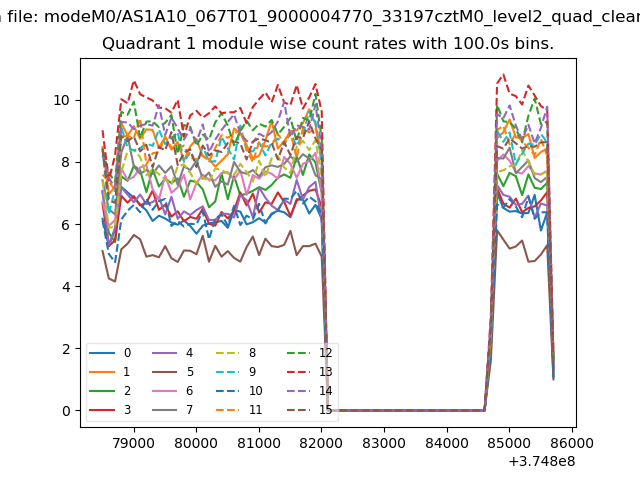
| Module-wise count rates for Quadrant A Data is divided into 100 sec bins |
 |
 |
| Module-wise count rates for Quadrant B Data is divided into 100 sec bins |
 |
 |
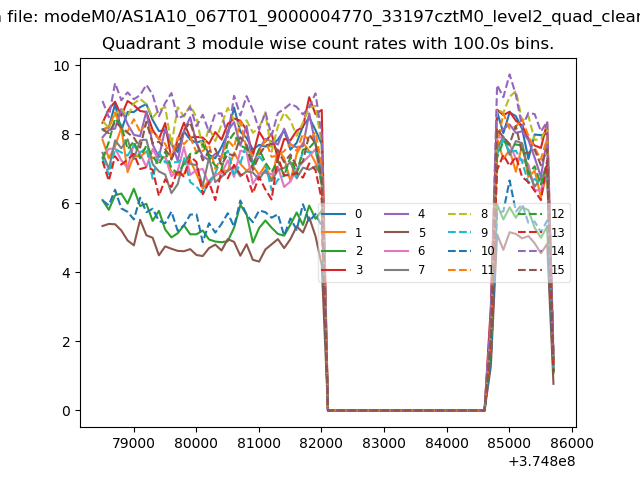
| Module-wise count rates for Quadrant C Data is divided into 100 sec bins |
 |
 |
| Module-wise count rates for Quadrant D Data is divided into 100 sec bins |
 |
 |
| Parameter | Plot |
|---|---|
| CZT HV Monitor | 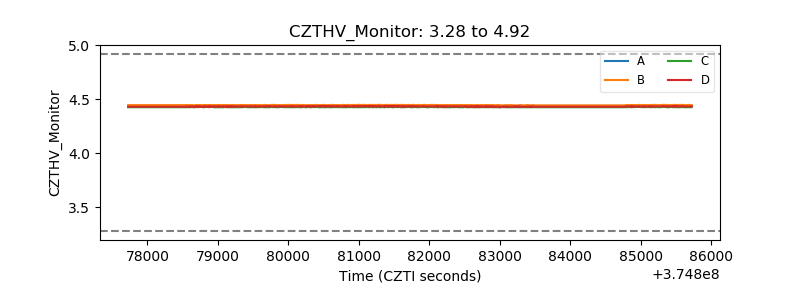 |
| D_VDD | 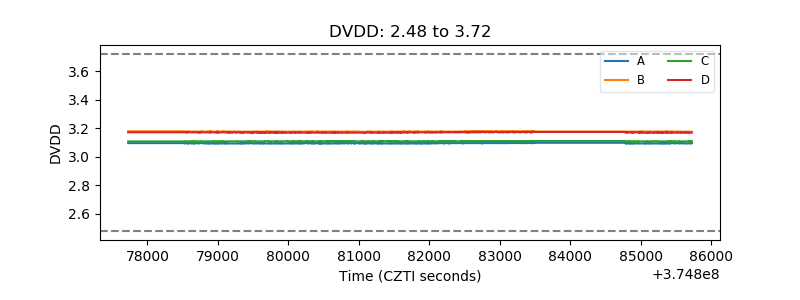 |
| Temperature 1 | 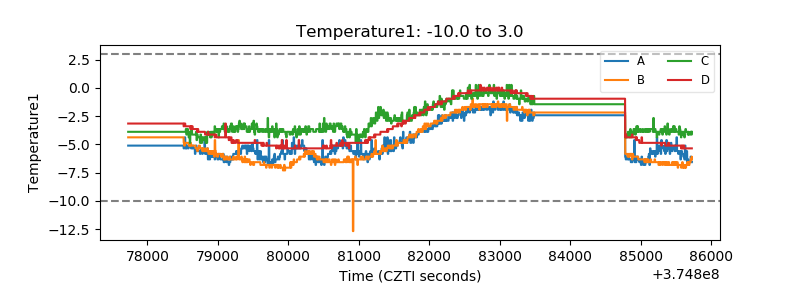 |
| Veto HV Monitor | 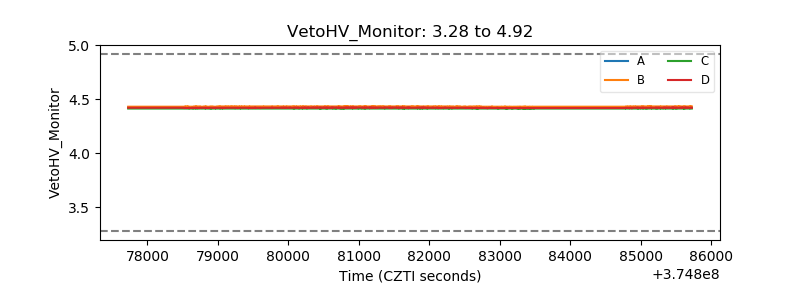 |
| Veto LLD | 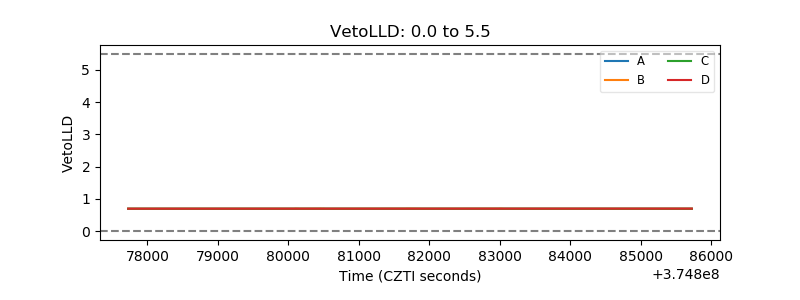 |
| Alpha Counter | 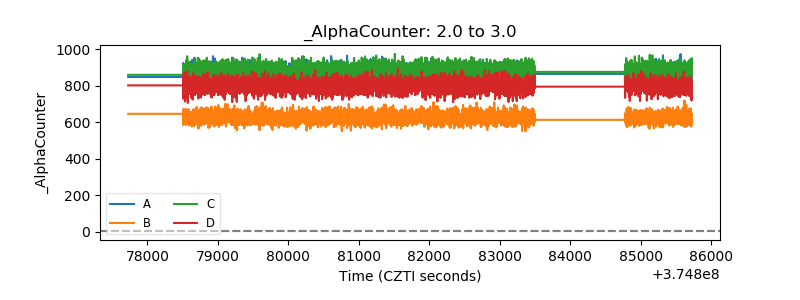 |
| _CPM_Rate | 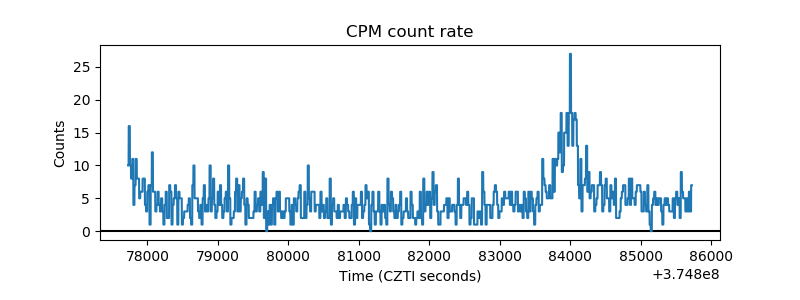 |
| CZT Counter | 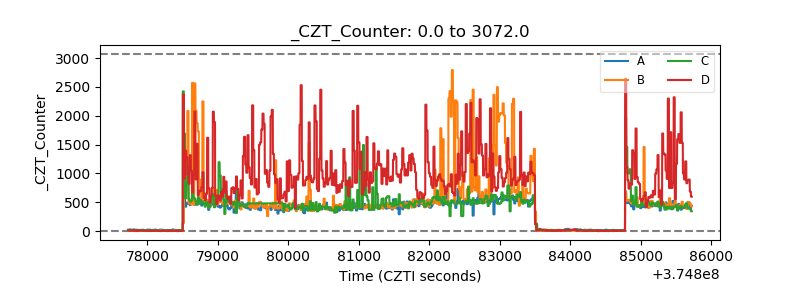 |
| +2.5 Volts monitor |  |
| +5 Volts monitor |  |
| _ROLL_ROT | 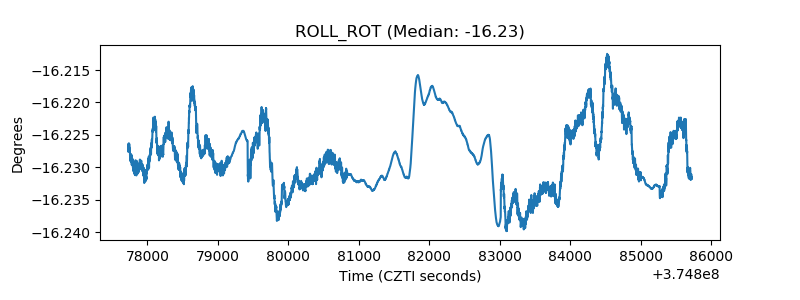 |
| _Roll_DEC | 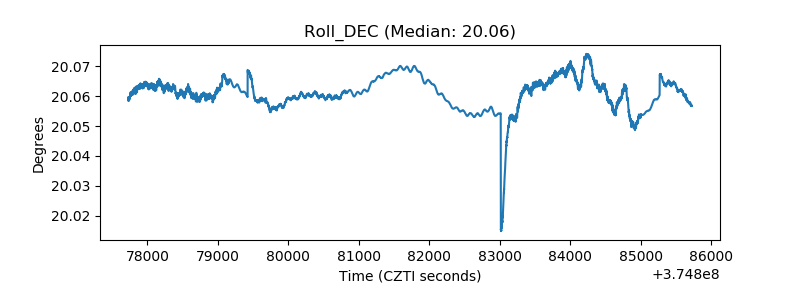 |
| _Roll_RA | 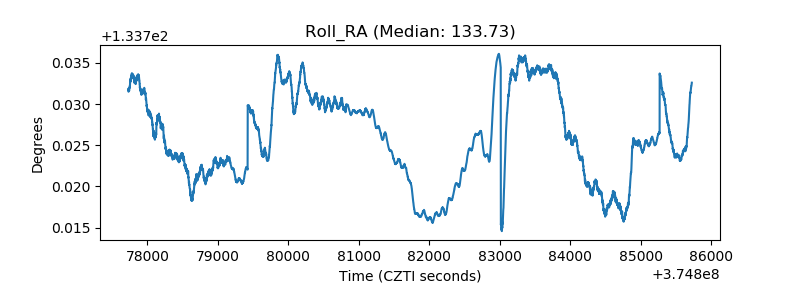 |
| Veto Counter | 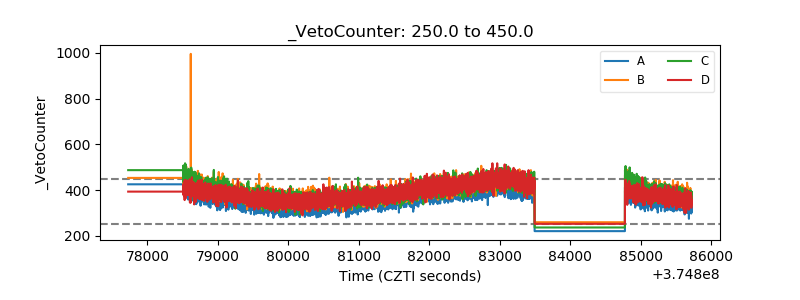 |