| Param | Original file | Final file |
|---|---|---|
| Filename | modeM0/AS1A10_067T01_9000004770_33200cztM0_level2.evt | modeM0/AS1A10_067T01_9000004770_33200cztM0_level2_quad_clean.evt |
| Size (bytes) | 1,432,477,440 | 187,344,000 |
| Size | 1.3 GB | 178.7 MB |
| Events in quadrant A | 7,478,562 | 1,183,367 |
| Events in quadrant B | 11,515,894 | 1,165,821 |
| Events in quadrant C | 7,633,534 | 1,159,886 |
| Events in quadrant D | 15,682,697 | 1,066,742 |
| Mode M9 | |||
|---|---|---|---|
| Quadrant | BADHDUFLAG | Total packets | Discarded packets |
| A | 0 | 55 | 0 |
| B | 0 | 55 | 0 |
| C | 0 | 55 | 0 |
| D | 0 | 55 | 0 |
| Mode M0 | |||
|---|---|---|---|
| Quadrant | BADHDUFLAG | Total packets | Discarded packets |
| A | 0 | 33021 | 5 |
| B | 0 | 45163 | 4 |
| C | 0 | 33508 | 4 |
| D | 0 | 57659 | 4 |
| Mode SS | |||
|---|---|---|---|
| Quadrant | BADHDUFLAG | Total packets | Discarded packets |
| A | 0 | 326 | 0 |
| B | 0 | 326 | 0 |
| C | 0 | 326 | 0 |
| D | 0 | 326 | 0 |
| Quadrant | Total seconds | Saturated seconds | Saturation percentage |
|---|---|---|---|
| A | 15913 | 50 | 0.314209% |
| B | 15913 | 1247 | 7.836360% |
| C | 15913 | 111 | 0.697543% |
| D | 15913 | 1206 | 7.578709% |
Noise dominated data is calculated using 1-second bins in cleaned event files. If a bin has >2000 counts, and if more than 50% of those come from <1% of pixels, then it is considered to be noise-dominated and hence unusable.
| Quadrant | # 1 sec bins | Bins with >0 counts | Bins with >2000 counts | High rate bins dominated by noise | Noise dominated (total time) | Noise dominated (detector-on time) | Marked lightcurve |
|---|---|---|---|---|---|---|---|
| A | 21401 | 15917 | 19 | 19 | 0.09% | 0.12% | 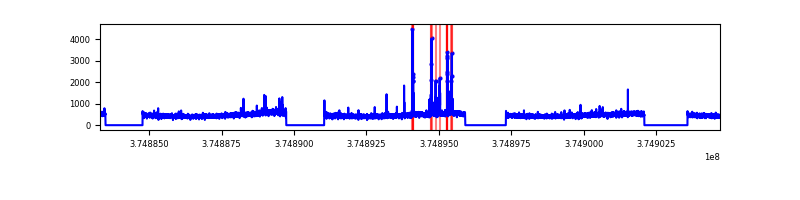 |
| B | 21401 | 15917 | 749 | 749 | 3.50% | 4.71% | 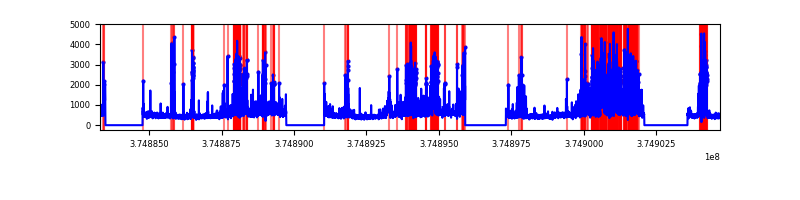 |
| C | 21401 | 15917 | 83 | 83 | 0.39% | 0.52% | 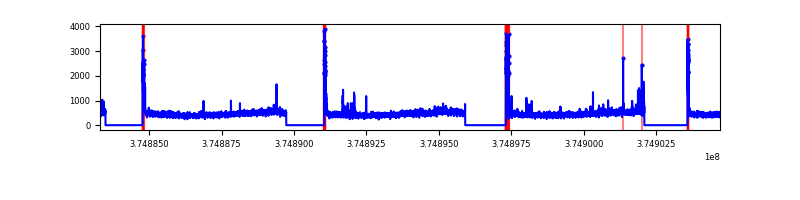 |
| D | 21401 | 15917 | 961 | 961 | 4.49% | 6.04% | 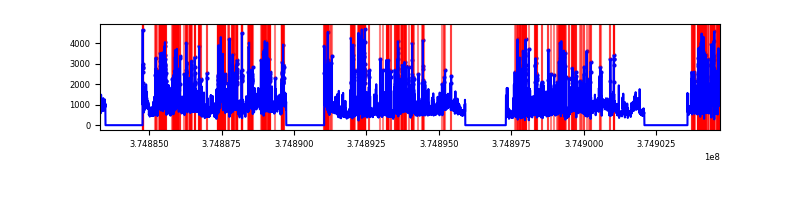 |
Top three noisy pixels from each quadrant. If the there are fewer than three noisy pixels in the level2.evt file, extra rows are filled as -1
| Pixel properties | Quadrant properties | ||||||
|---|---|---|---|---|---|---|---|
| Quadrant | DetID | PixID | Counts | Sigma | Mean | Median | Sigma |
| A | 14 | 254 | 177261 | 470.11 | 1865 | 1828 | 373.2 |
| A | 14 | 238 | 66696 | 173.83 | 1865 | 1828 | 373.2 |
| A | 13 | 6 | 32284 | 81.61 | 1865 | 1828 | 373.2 |
| B | 5 | 172 | 3028287 | 8898.44 | 1792 | 1746 | 340.1 |
| B | 0 | 219 | 431570 | 1263.74 | 1792 | 1746 | 340.1 |
| B | 5 | 200 | 215216 | 627.63 | 1792 | 1746 | 340.1 |
| C | 0 | 10 | 401931 | 969.9 | 1797 | 1815 | 412.5 |
| C | 7 | 221 | 54588 | 127.92 | 1797 | 1815 | 412.5 |
| C | 14 | 67 | 48478 | 113.11 | 1797 | 1815 | 412.5 |
| D | 8 | 195 | 3401863 | 7120.31 | 1745 | 1708 | 477.5 |
| D | 2 | 250 | 2092631 | 4378.63 | 1745 | 1708 | 477.5 |
| D | 2 | 249 | 1061824 | 2220.0 | 1745 | 1708 | 477.5 |
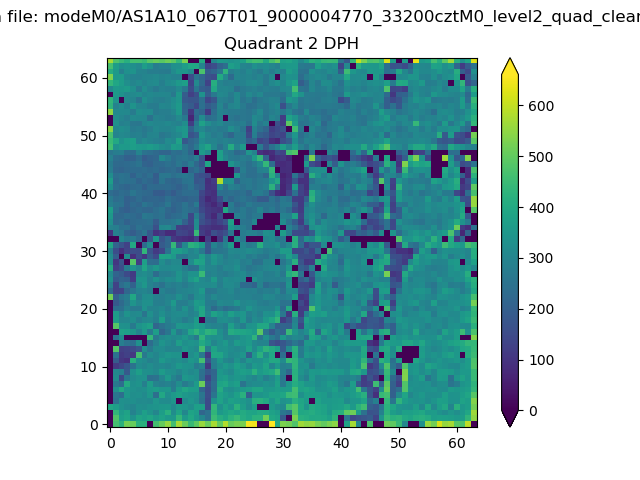
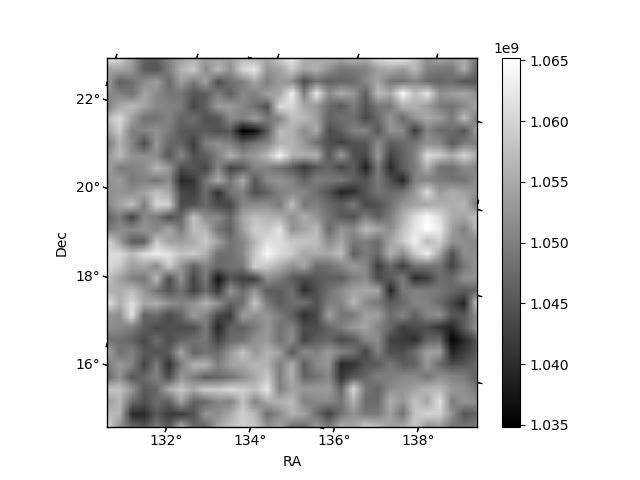
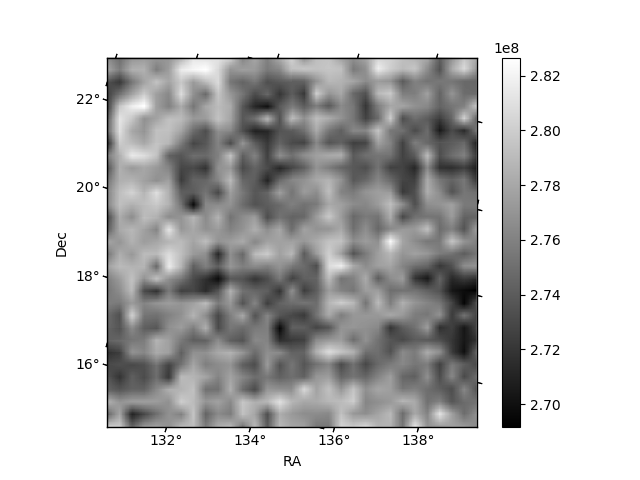
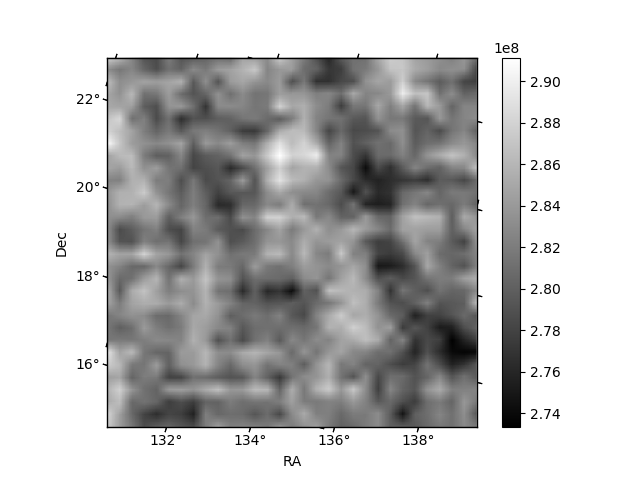
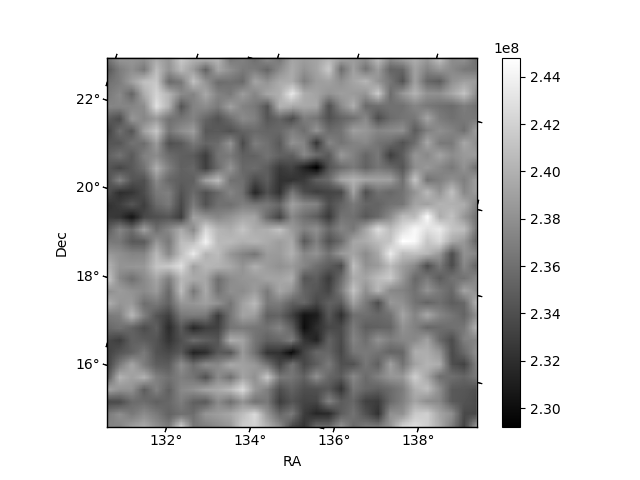
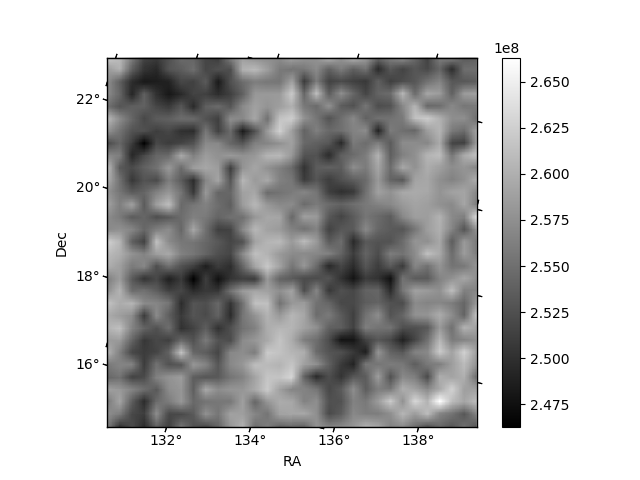
Histogram calculated using DETX and DETY for each event in the final _common_clean file
| Quadrant A | 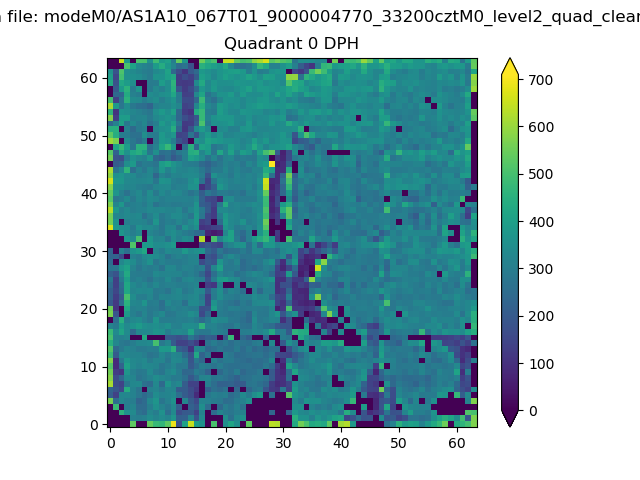 |
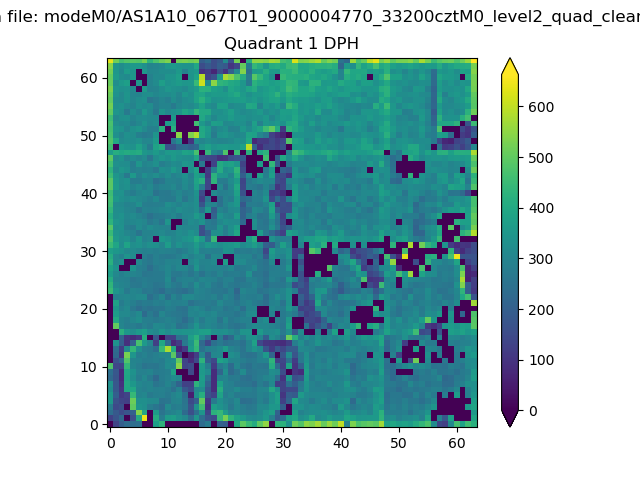 |
Quadrant B |
|---|---|---|---|
| Quadrant D | 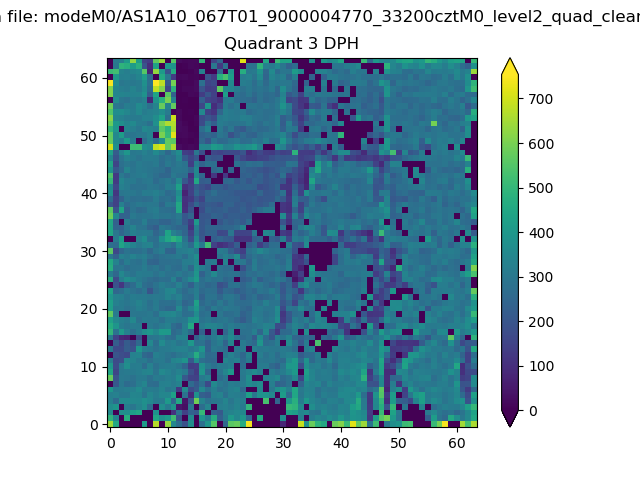 |
 |
Quadrant C |
| Plot type | Count rate plots | Images |
|---|---|---|
| Comparison with Poisson distribution Blue bars denote a histogram of data divided into 1 sec bins. Red curve is a Poisson curve with rate = median count rate of data. |
 |
 |
| Quadrant-wise count rates Data is divided into 100 sec bins |
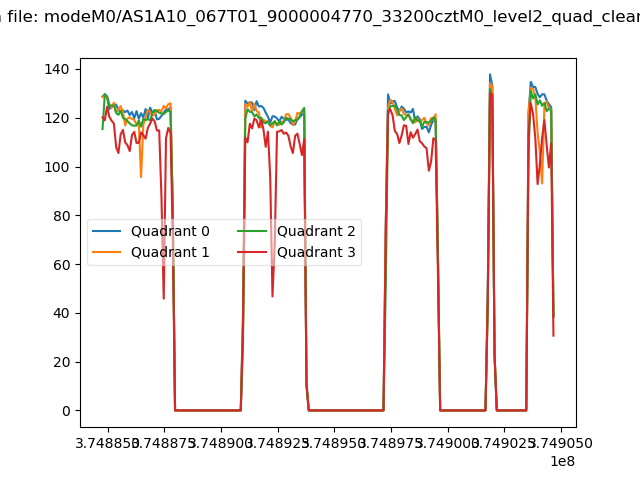 |
|
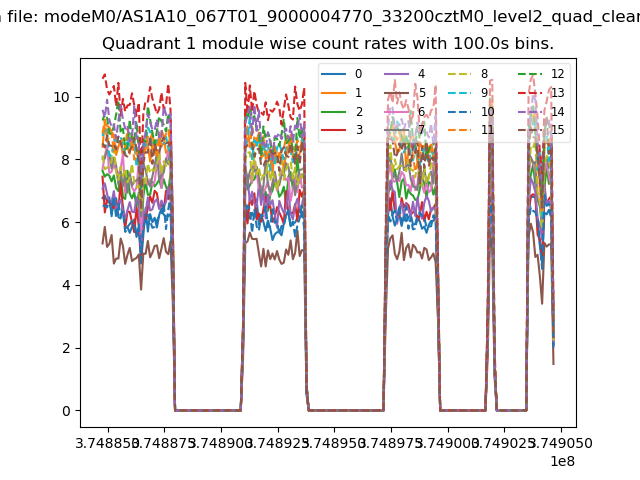
| Module-wise count rates for Quadrant A Data is divided into 100 sec bins |
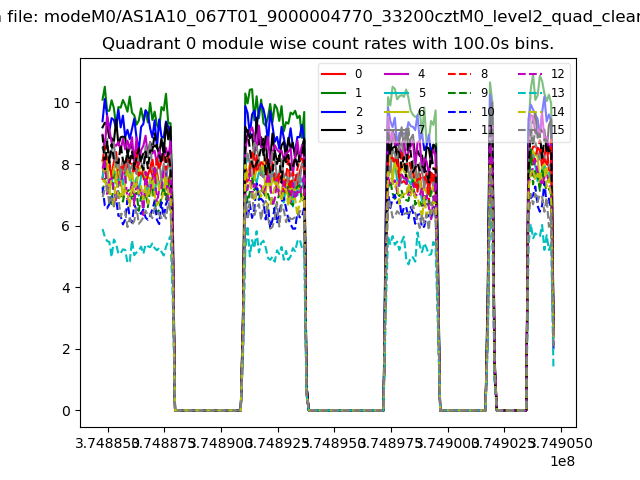 |
 |
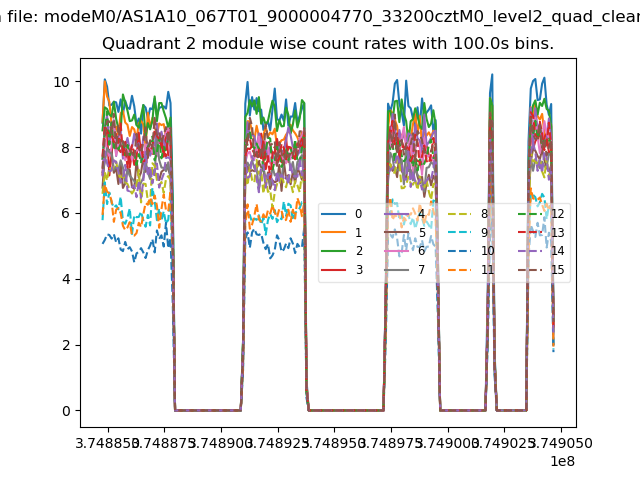
| Module-wise count rates for Quadrant B Data is divided into 100 sec bins |
 |
 |
| Module-wise count rates for Quadrant C Data is divided into 100 sec bins |
 |
 |
| Module-wise count rates for Quadrant D Data is divided into 100 sec bins |
 |
 |
| Parameter | Plot |
|---|---|
| CZT HV Monitor |  |
| D_VDD | 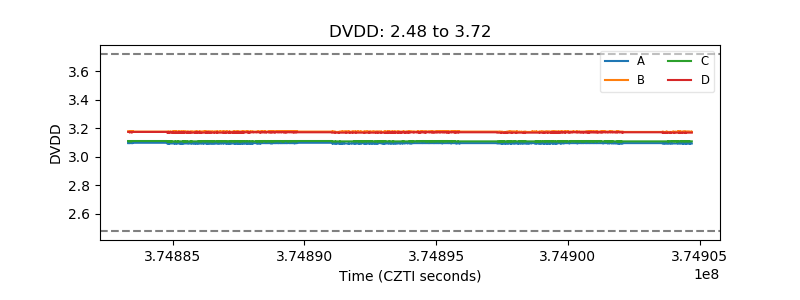 |
| Temperature 1 | 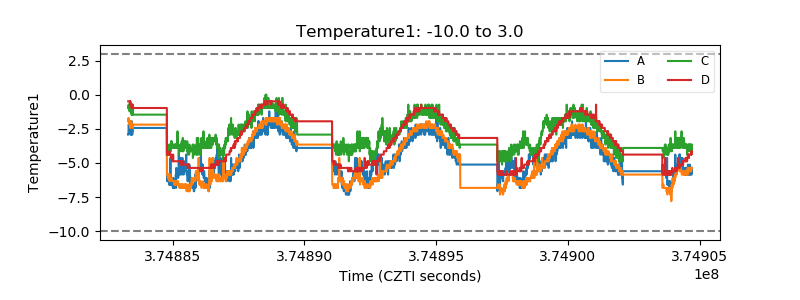 |
| Veto HV Monitor | 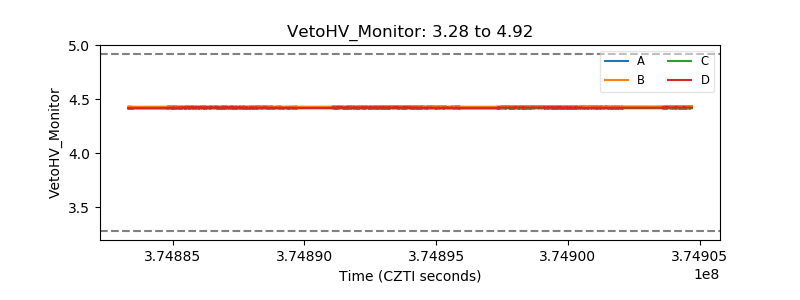 |
| Veto LLD | 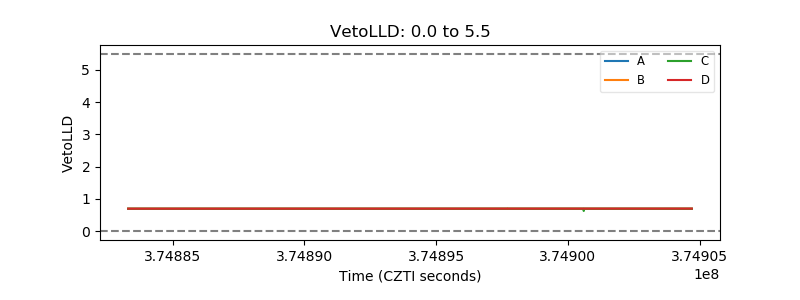 |
| Alpha Counter | 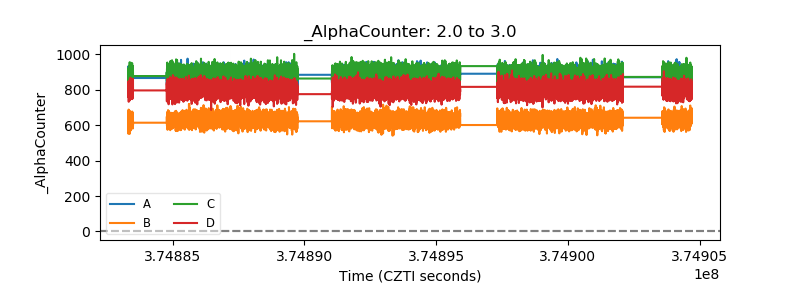 |
| _CPM_Rate | 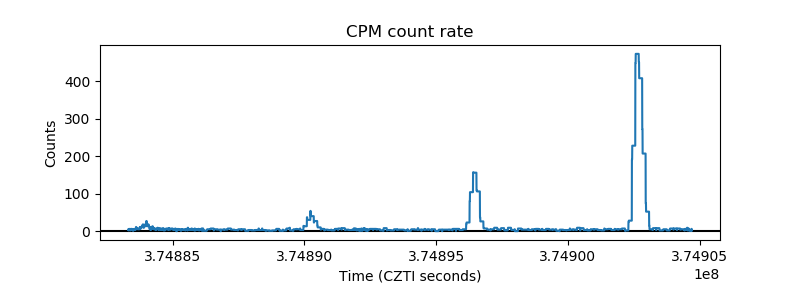 |
| CZT Counter | 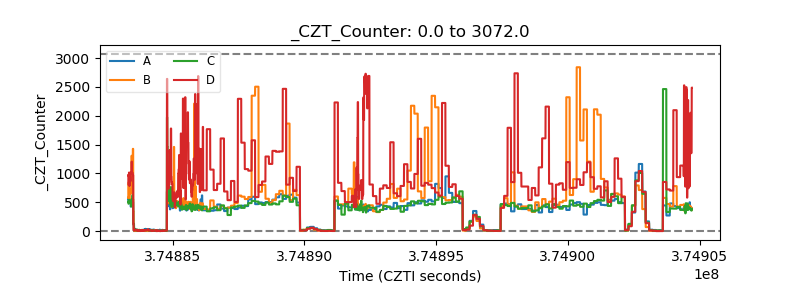 |
| +2.5 Volts monitor |  |
| +5 Volts monitor |  |
| _ROLL_ROT |  |
| _Roll_DEC | 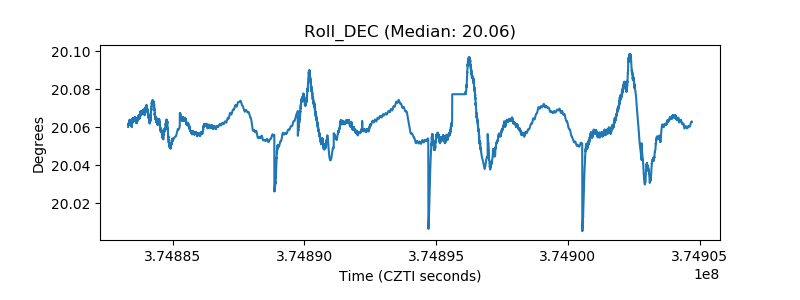 |
| _Roll_RA | 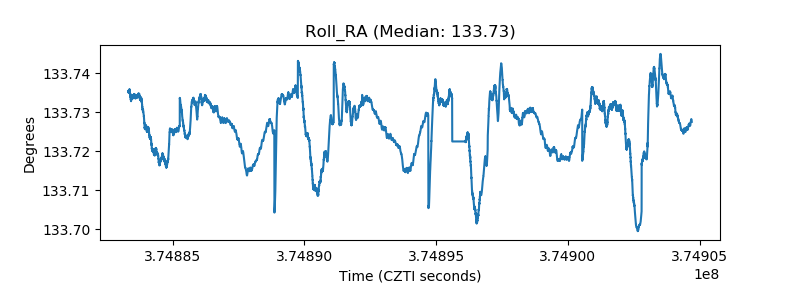 |
| Veto Counter | 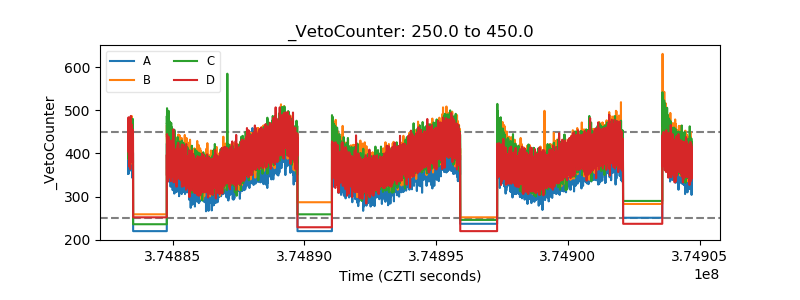 |