| Param | Original file | Final file |
|---|---|---|
| Filename | modeM0/AS1A10_067T01_9000004770_33201cztM0_level2.evt | modeM0/AS1A10_067T01_9000004770_33201cztM0_level2_quad_clean.evt |
| Size (bytes) | 501,799,680 | 69,600,960 |
| Size | 478.6 MB | 66.4 MB |
| Events in quadrant A | 2,593,091 | 445,152 |
| Events in quadrant B | 3,950,175 | 437,018 |
| Events in quadrant C | 2,898,193 | 433,262 |
| Events in quadrant D | 5,375,377 | 399,585 |
| Mode M9 | |||
|---|---|---|---|
| Quadrant | BADHDUFLAG | Total packets | Discarded packets |
| A | 0 | 25 | 0 |
| B | 0 | 25 | 0 |
| C | 0 | 25 | 0 |
| D | 0 | 26 | 0 |
| Mode M0 | |||
|---|---|---|---|
| Quadrant | BADHDUFLAG | Total packets | Discarded packets |
| A | 0 | 11274 | 3 |
| B | 0 | 15377 | 2 |
| C | 0 | 12260 | 2 |
| D | 0 | 19823 | 2 |
| Mode SS | |||
|---|---|---|---|
| Quadrant | BADHDUFLAG | Total packets | Discarded packets |
| A | 0 | 114 | 0 |
| B | 0 | 114 | 0 |
| C | 0 | 114 | 0 |
| D | 0 | 114 | 0 |
| Quadrant | Total seconds | Saturated seconds | Saturation percentage |
|---|---|---|---|
| A | 5608 | 6 | 0.106990% |
| B | 5608 | 366 | 6.526391% |
| C | 5608 | 76 | 1.355207% |
| D | 5608 | 356 | 6.348074% |
Noise dominated data is calculated using 1-second bins in cleaned event files. If a bin has >2000 counts, and if more than 50% of those come from <1% of pixels, then it is considered to be noise-dominated and hence unusable.
| Quadrant | # 1 sec bins | Bins with >0 counts | Bins with >2000 counts | High rate bins dominated by noise | Noise dominated (total time) | Noise dominated (detector-on time) | Marked lightcurve |
|---|---|---|---|---|---|---|---|
| A | 7250 | 5609 | 0 | 0 | 0.00% | 0.00% |  |
| B | 7250 | 5609 | 239 | 239 | 3.30% | 4.26% |  |
| C | 7250 | 5609 | 66 | 66 | 0.91% | 1.18% |  |
| D | 7250 | 5609 | 306 | 306 | 4.22% | 5.46% |  |
Top three noisy pixels from each quadrant. If the there are fewer than three noisy pixels in the level2.evt file, extra rows are filled as -1
| Pixel properties | Quadrant properties | ||||||
|---|---|---|---|---|---|---|---|
| Quadrant | DetID | PixID | Counts | Sigma | Mean | Median | Sigma |
| A | 13 | 254 | 9202 | 63.92 | 668 | 655 | 133.7 |
| A | 13 | 6 | 7330 | 49.92 | 668 | 655 | 133.7 |
| A | 3 | 137 | 6217 | 41.59 | 668 | 655 | 133.7 |
| B | 5 | 172 | 1021334 | 8302.83 | 643 | 628 | 122.9 |
| B | 0 | 197 | 203909 | 1653.57 | 643 | 628 | 122.9 |
| B | 4 | 170 | 34077 | 272.09 | 643 | 628 | 122.9 |
| C | 0 | 10 | 225457 | 1517.6 | 638 | 642 | 148.1 |
| C | 9 | 187 | 50032 | 333.4 | 638 | 642 | 148.1 |
| C | 1 | 23 | 49842 | 332.12 | 638 | 642 | 148.1 |
| D | 8 | 195 | 1339055 | 8517.79 | 633 | 613 | 157.1 |
| D | 2 | 250 | 1109717 | 7058.29 | 633 | 613 | 157.1 |
| D | 13 | 249 | 143882 | 911.76 | 633 | 613 | 157.1 |
Histogram calculated using DETX and DETY for each event in the final _common_clean file
| Quadrant A | 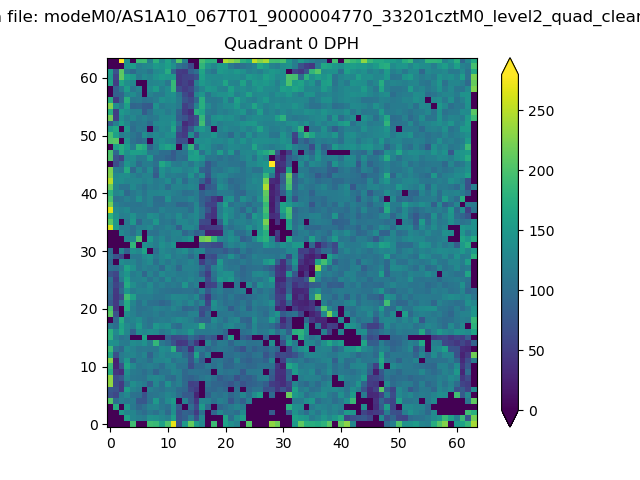 |
 |
Quadrant B |
|---|---|---|---|
| Quadrant D |  |
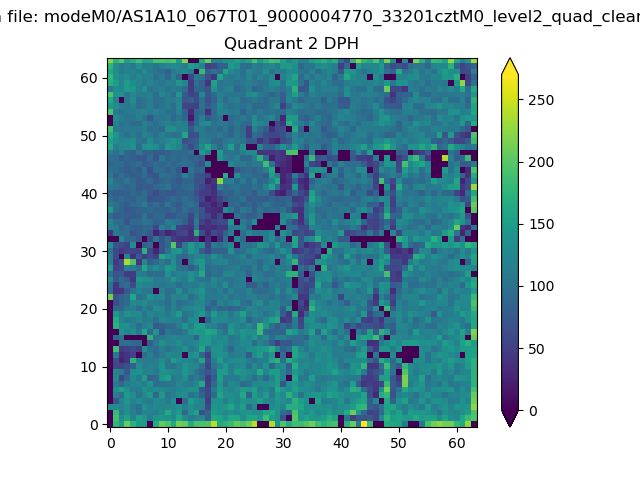 |
Quadrant C |
| Plot type | Count rate plots | Images |
|---|---|---|
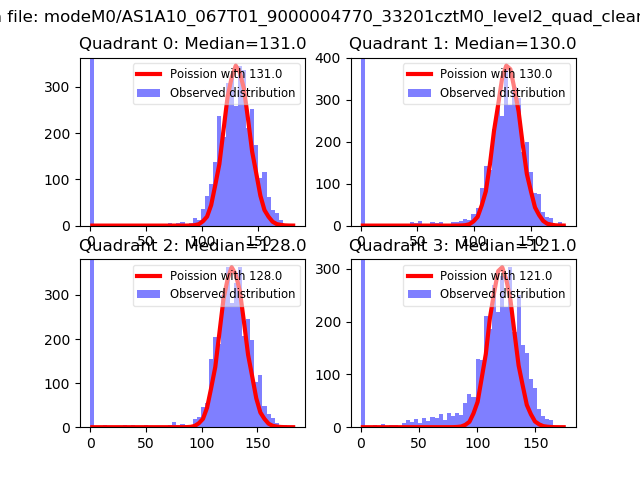
| Comparison with Poisson distribution Blue bars denote a histogram of data divided into 1 sec bins. Red curve is a Poisson curve with rate = median count rate of data. |
 |
 |
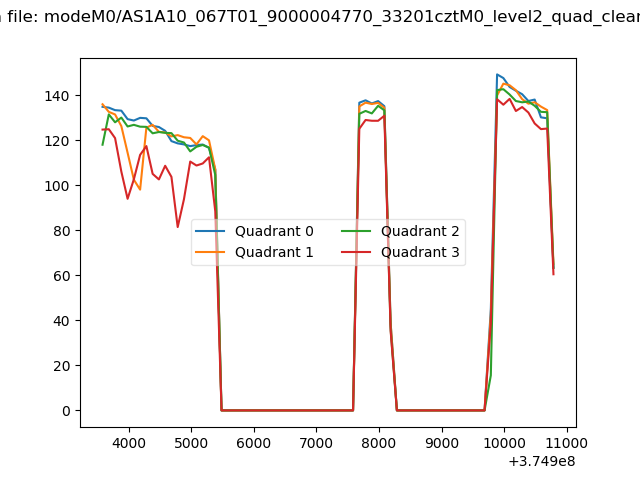
| Quadrant-wise count rates Data is divided into 100 sec bins |
 |
|
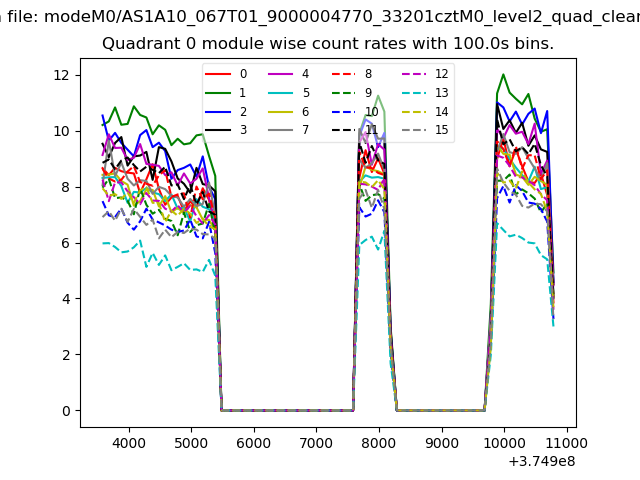
| Module-wise count rates for Quadrant A Data is divided into 100 sec bins |
 |
 |
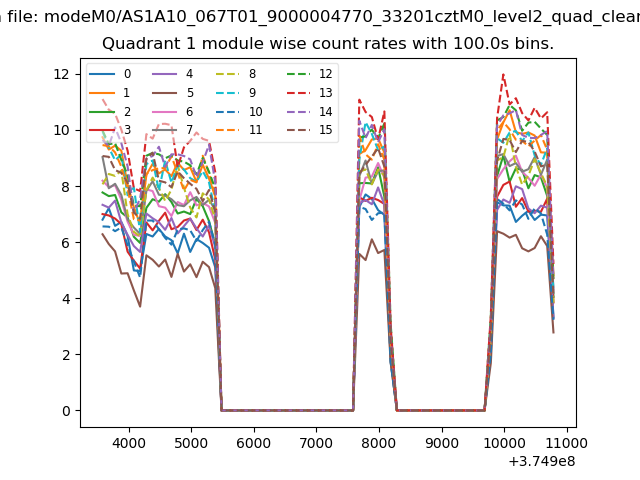
| Module-wise count rates for Quadrant B Data is divided into 100 sec bins |
 |
 |
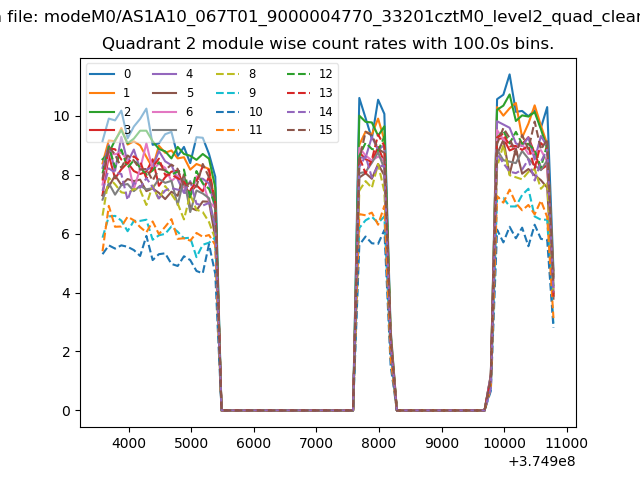
| Module-wise count rates for Quadrant C Data is divided into 100 sec bins |
 |
 |
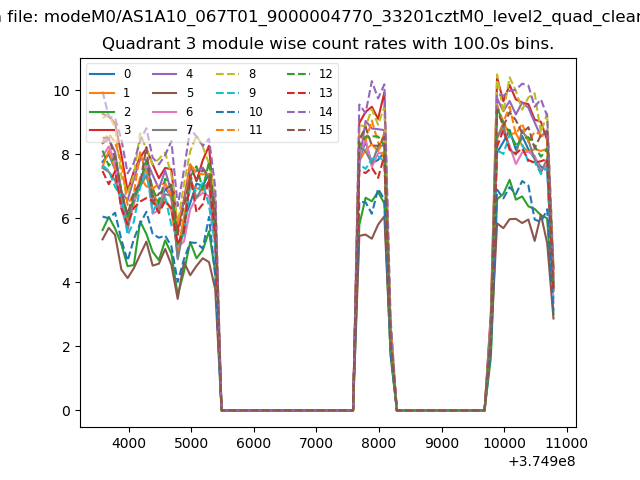
| Module-wise count rates for Quadrant D Data is divided into 100 sec bins |
 |
 |
| Parameter | Plot |
|---|---|
| CZT HV Monitor | 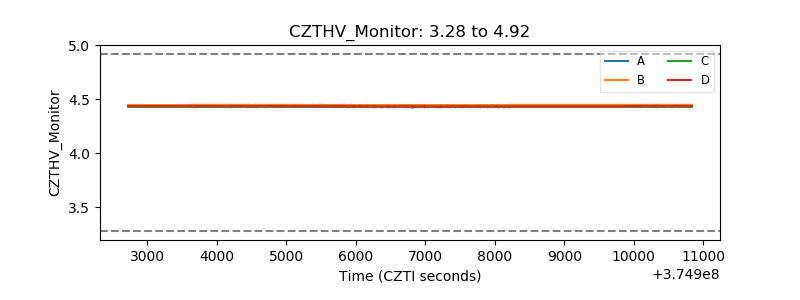 |
| D_VDD |  |
| Temperature 1 | 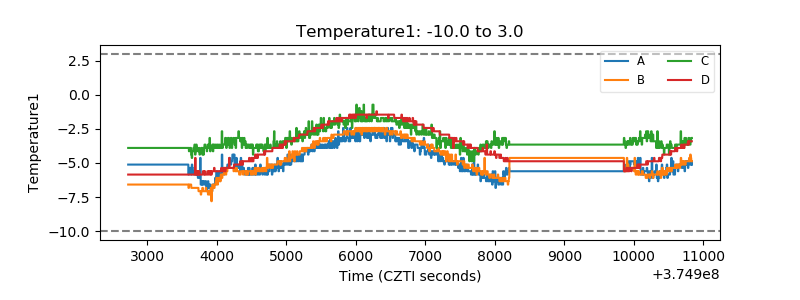 |
| Veto HV Monitor |  |
| Veto LLD |  |
| Alpha Counter | 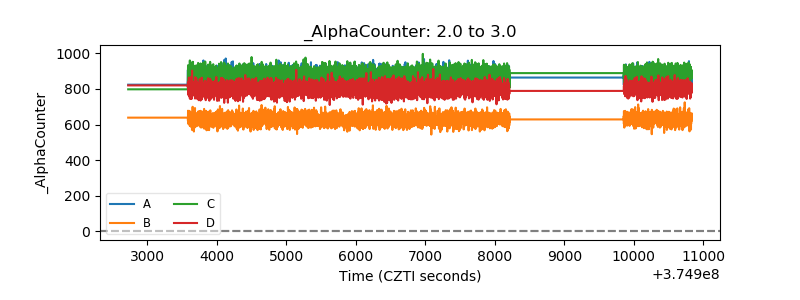 |
| _CPM_Rate | 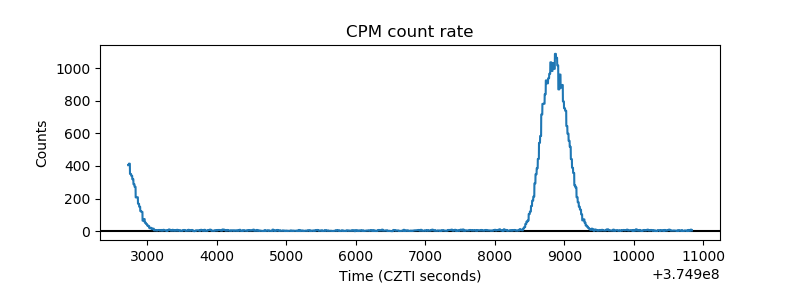 |
| CZT Counter |  |
| +2.5 Volts monitor |  |
| +5 Volts monitor | 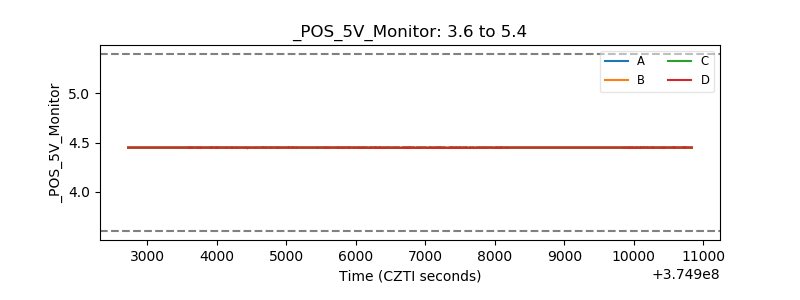 |
| _ROLL_ROT | 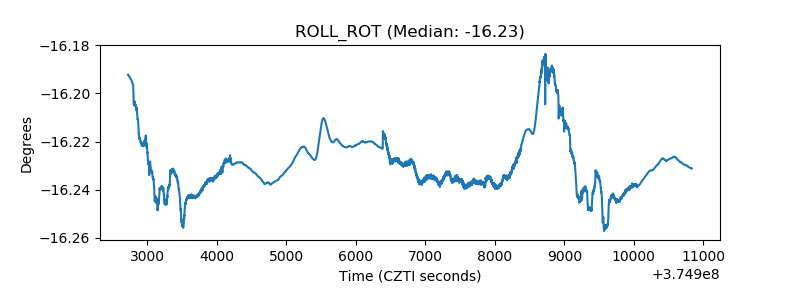 |
| _Roll_DEC | 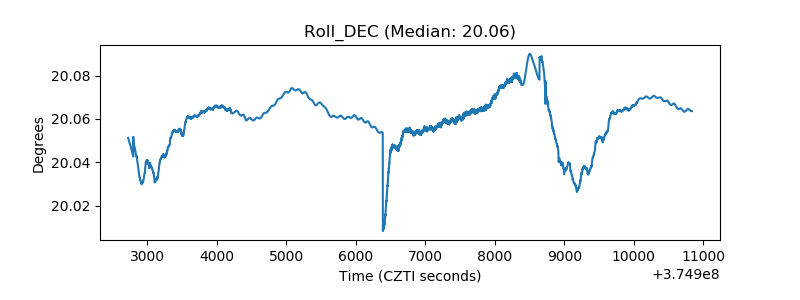 |
| _Roll_RA |  |
| Veto Counter | 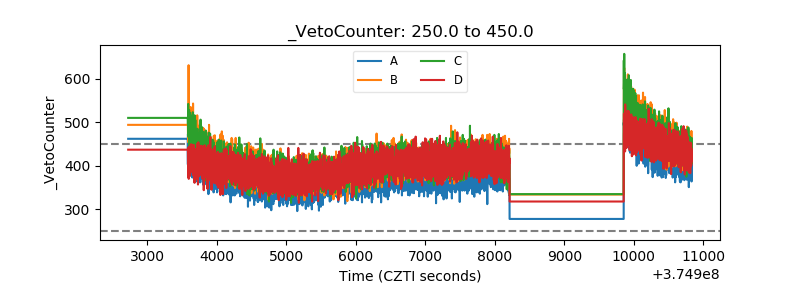 |