| Param | Original file | Final file |
|---|---|---|
| Filename | modeM0/AS1A10_067T01_9000004770_33204cztM0_level2.evt | modeM0/AS1A10_067T01_9000004770_33204cztM0_level2_quad_clean.evt |
| Size (bytes) | 473,057,280 | 60,667,200 |
| Size | 451.1 MB | 57.9 MB |
| Events in quadrant A | 2,428,366 | 394,070 |
| Events in quadrant B | 3,627,019 | 388,940 |
| Events in quadrant C | 2,752,883 | 383,567 |
| Events in quadrant D | 5,193,248 | 333,560 |
| Mode M9 | |||
|---|---|---|---|
| Quadrant | BADHDUFLAG | Total packets | Discarded packets |
| A | 0 | 21 | 2 |
| B | 0 | 20 | 1 |
| C | 0 | 20 | 1 |
| D | 0 | 25 | 6 |
| Mode M0 | |||
|---|---|---|---|
| Quadrant | BADHDUFLAG | Total packets | Discarded packets |
| A | 0 | 10417 | 489 |
| B | 0 | 14681 | 919 |
| C | 0 | 11617 | 575 |
| D | 0 | 20838 | 1904 |
| Mode SS | |||
|---|---|---|---|
| Quadrant | BADHDUFLAG | Total packets | Discarded packets |
| A | 0 | 103 | 5 |
| B | 0 | 103 | 4 |
| C | 0 | 111 | 9 |
| D | 0 | 108 | 6 |
| Quadrant | Total seconds | Saturated seconds | Saturation percentage |
|---|---|---|---|
| A | 4835 | 5 | 0.103413% |
| B | 4779 | 352 | 7.365558% |
| C | 4835 | 53 | 1.096174% |
| D | 4689 | 373 | 7.954788% |
Noise dominated data is calculated using 1-second bins in cleaned event files. If a bin has >2000 counts, and if more than 50% of those come from <1% of pixels, then it is considered to be noise-dominated and hence unusable.
| Quadrant | # 1 sec bins | Bins with >0 counts | Bins with >2000 counts | High rate bins dominated by noise | Noise dominated (total time) | Noise dominated (detector-on time) | Marked lightcurve |
|---|---|---|---|---|---|---|---|
| A | 6975 | 5012 | 0 | 0 | 0.00% | 0.00% | 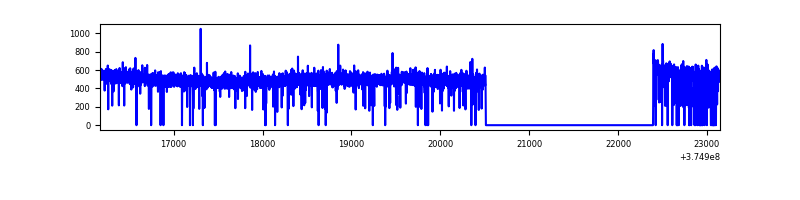 |
| B | 6975 | 4988 | 222 | 222 | 3.18% | 4.45% | 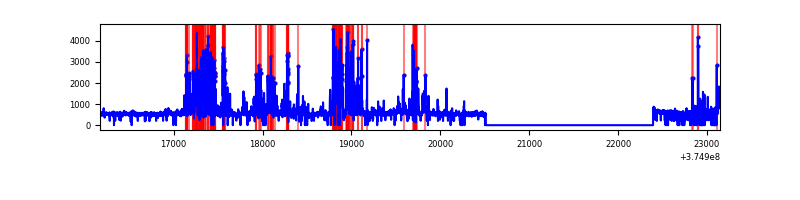 |
| C | 6975 | 5020 | 39 | 39 | 0.56% | 0.78% | 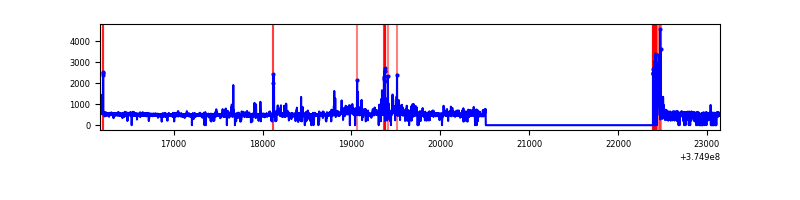 |
| D | 6975 | 4934 | 280 | 280 | 4.01% | 5.67% | 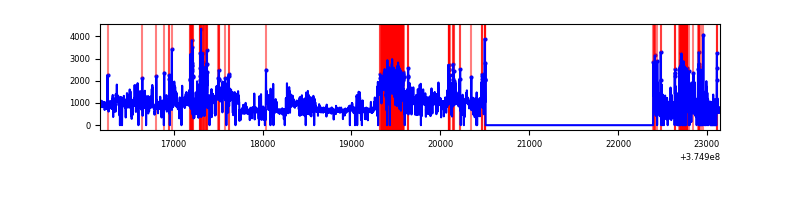 |
Top three noisy pixels from each quadrant. If the there are fewer than three noisy pixels in the level2.evt file, extra rows are filled as -1
| Pixel properties | Quadrant properties | ||||||
|---|---|---|---|---|---|---|---|
| Quadrant | DetID | PixID | Counts | Sigma | Mean | Median | Sigma |
| A | 13 | 254 | 7583 | 56.03 | 626 | 615 | 124.4 |
| A | 14 | 254 | 6084 | 43.98 | 626 | 615 | 124.4 |
| A | 0 | 226 | 5649 | 40.48 | 626 | 615 | 124.4 |
| B | 5 | 172 | 906003 | 8040.7 | 594 | 580 | 112.6 |
| B | 15 | 32 | 119815 | 1058.88 | 594 | 580 | 112.6 |
| B | 0 | 197 | 102867 | 908.37 | 594 | 580 | 112.6 |
| C | 1 | 23 | 204531 | 1469.28 | 602 | 608 | 138.8 |
| C | 0 | 10 | 125881 | 902.6 | 602 | 608 | 138.8 |
| C | 0 | 207 | 36355 | 257.56 | 602 | 608 | 138.8 |
| D | 8 | 195 | 1587421 | 11214.98 | 577 | 563 | 141.5 |
| D | 12 | 218 | 285713 | 2015.27 | 577 | 563 | 141.5 |
| D | 10 | 118 | 265395 | 1871.68 | 577 | 563 | 141.5 |
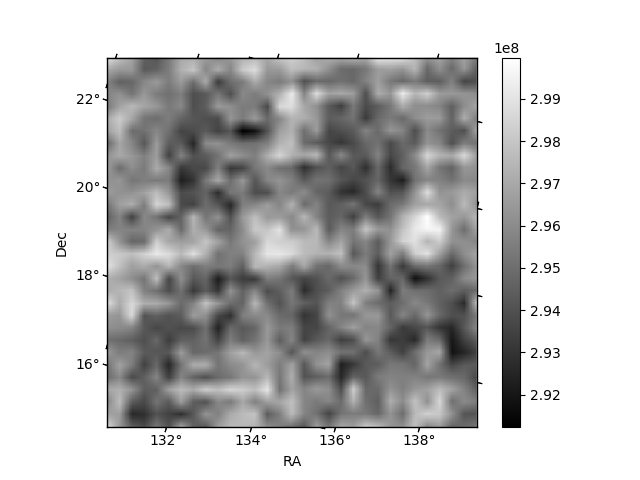
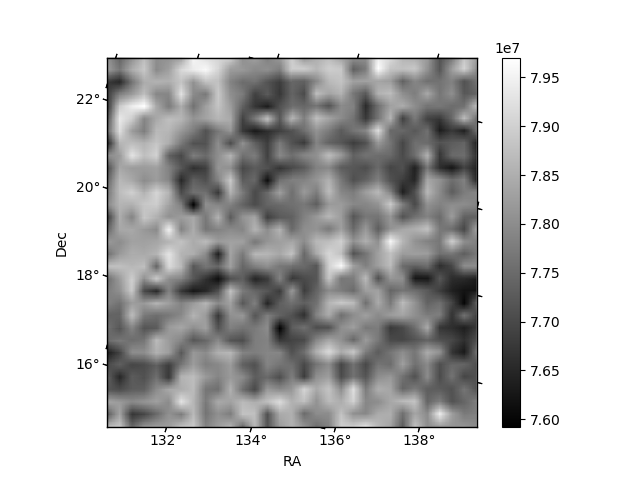
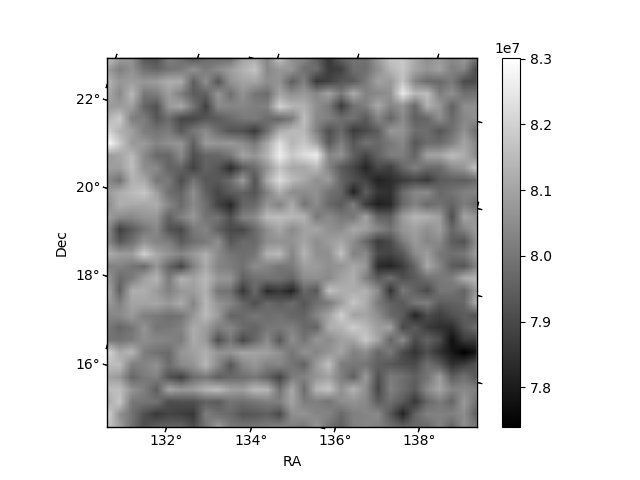
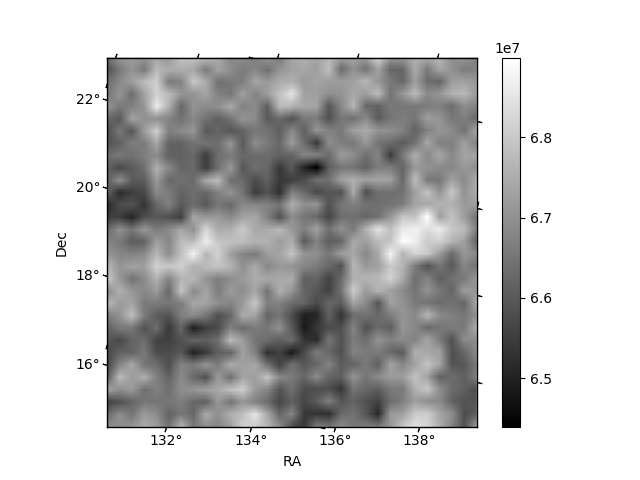
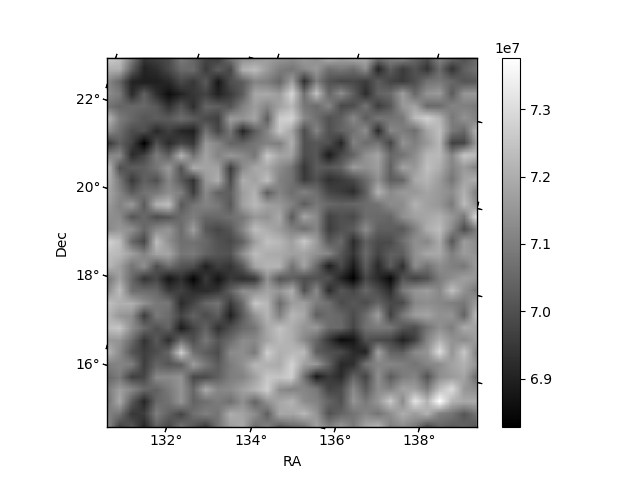
Histogram calculated using DETX and DETY for each event in the final _common_clean file
| Quadrant A | 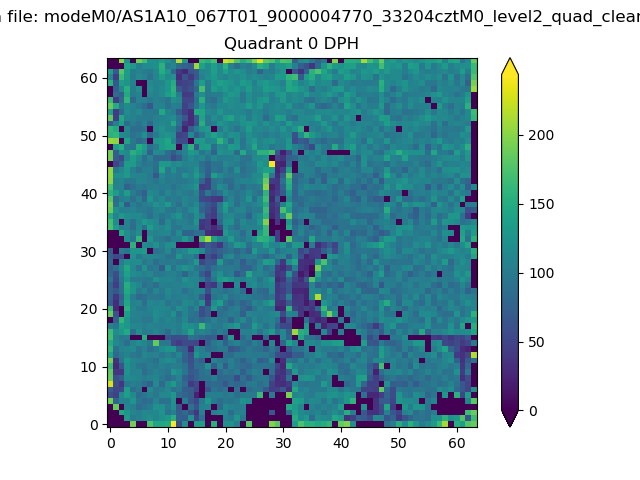 |
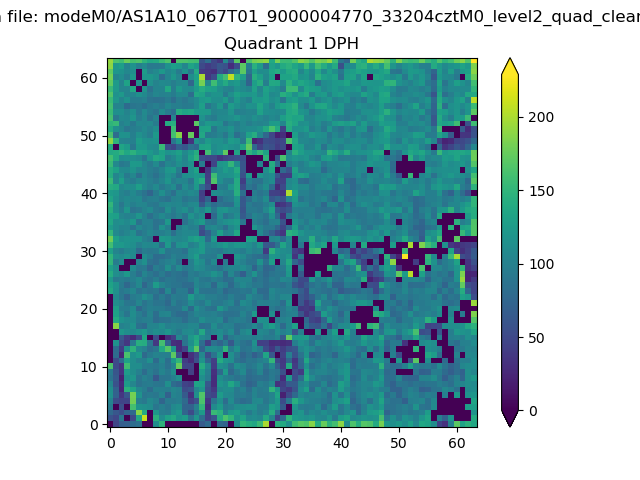 |
Quadrant B |
|---|---|---|---|
| Quadrant D | 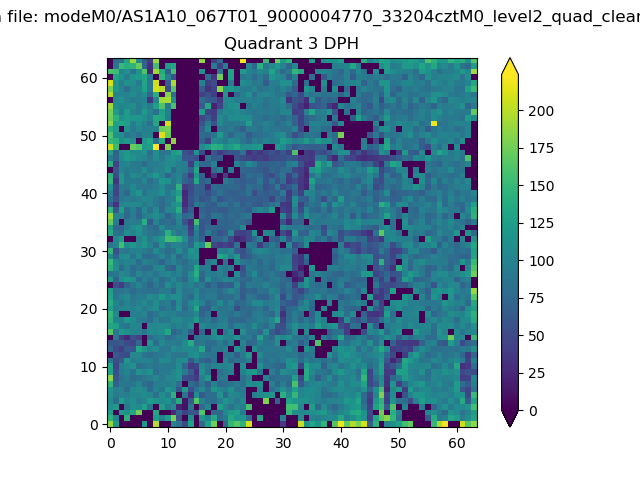 |
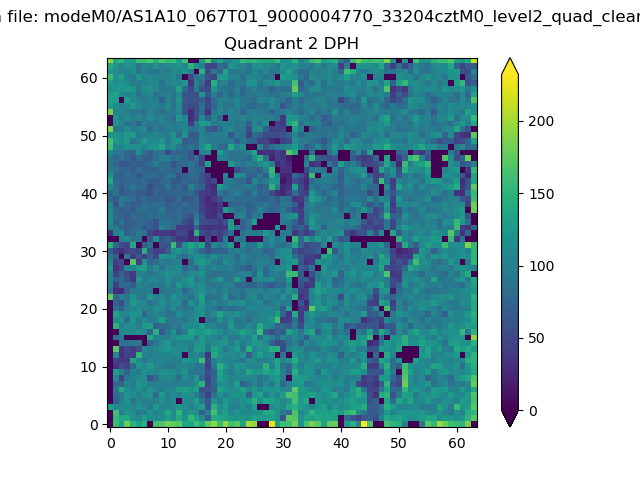 |
Quadrant C |
| Plot type | Count rate plots | Images |
|---|---|---|
| Comparison with Poisson distribution Blue bars denote a histogram of data divided into 1 sec bins. Red curve is a Poisson curve with rate = median count rate of data. |
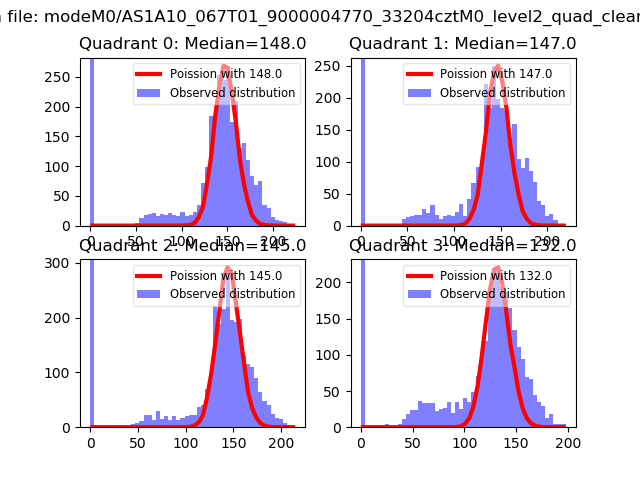 |
 |
| Quadrant-wise count rates Data is divided into 100 sec bins |
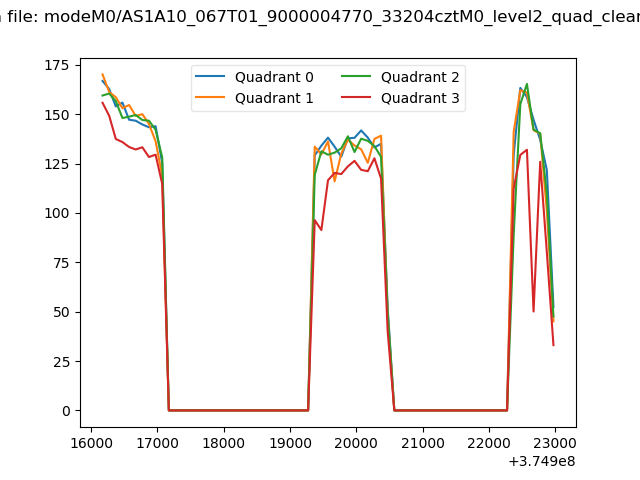 |
|
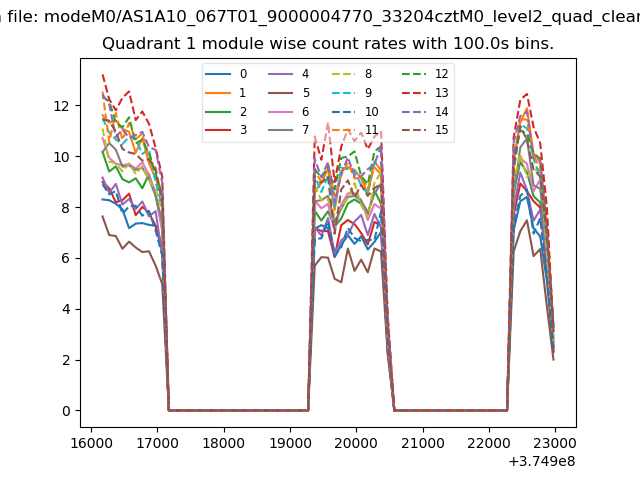
| Module-wise count rates for Quadrant A Data is divided into 100 sec bins |
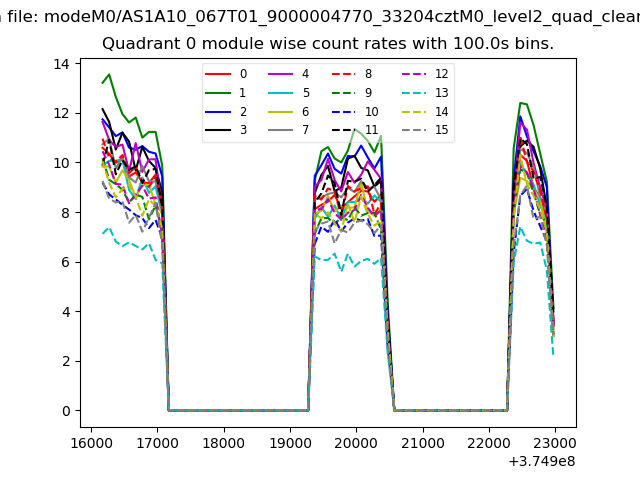 |
 |
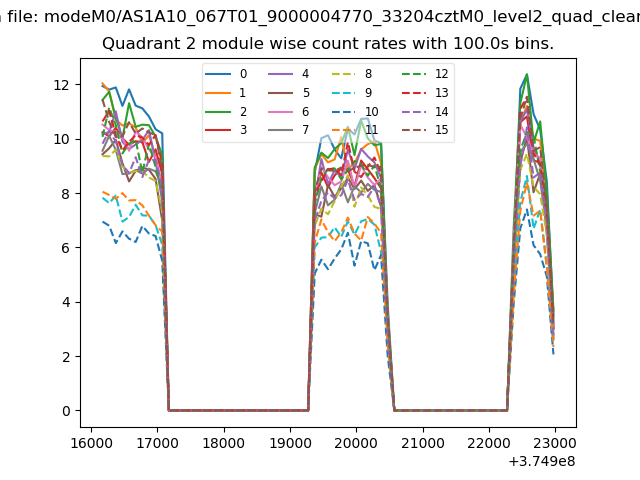
| Module-wise count rates for Quadrant B Data is divided into 100 sec bins |
 |
 |
| Module-wise count rates for Quadrant C Data is divided into 100 sec bins |
 |
 |
| Module-wise count rates for Quadrant D Data is divided into 100 sec bins |
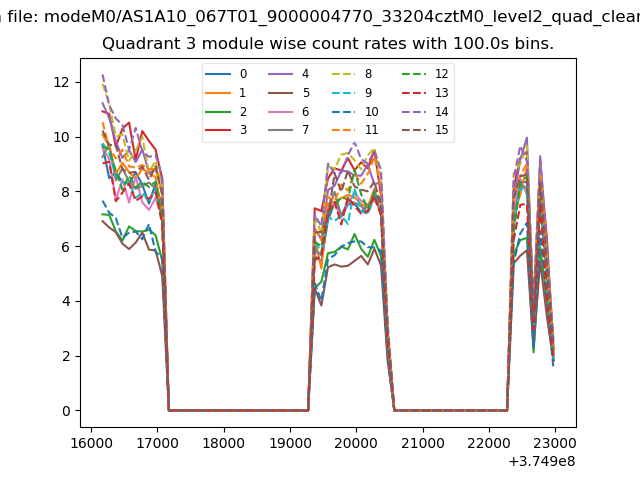 |
 |
| Parameter | Plot |
|---|---|
| CZT HV Monitor | 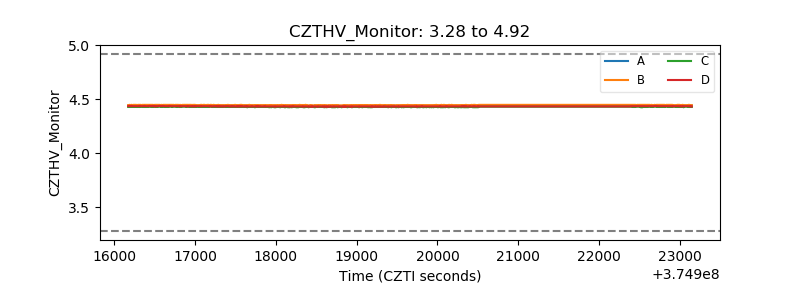 |
| D_VDD | 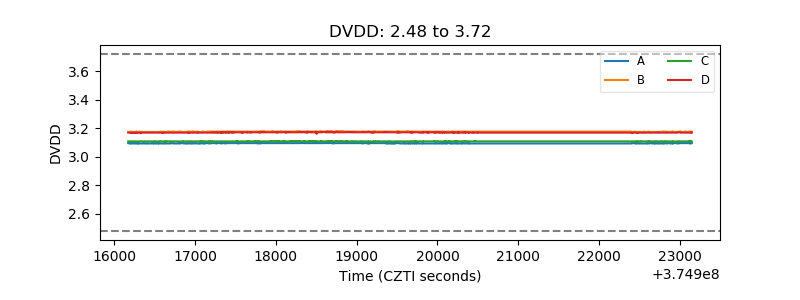 |
| Temperature 1 | 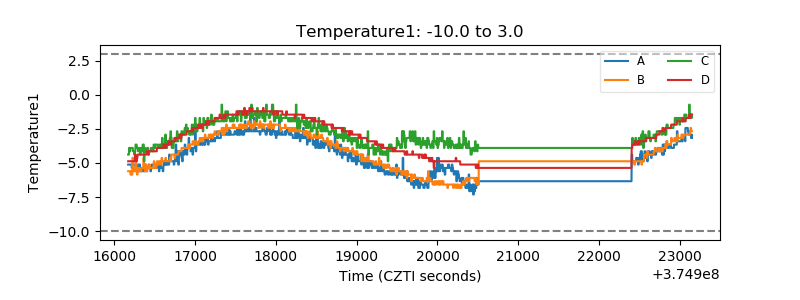 |
| Veto HV Monitor | 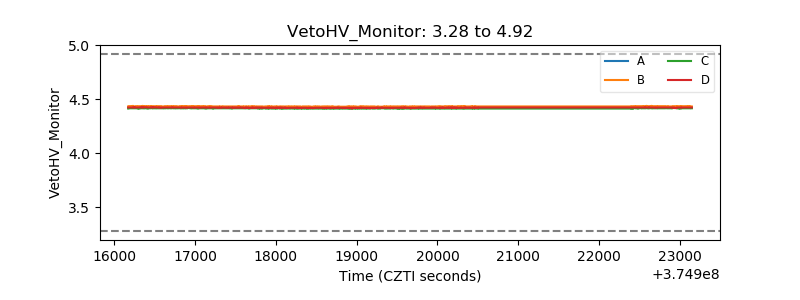 |
| Veto LLD | 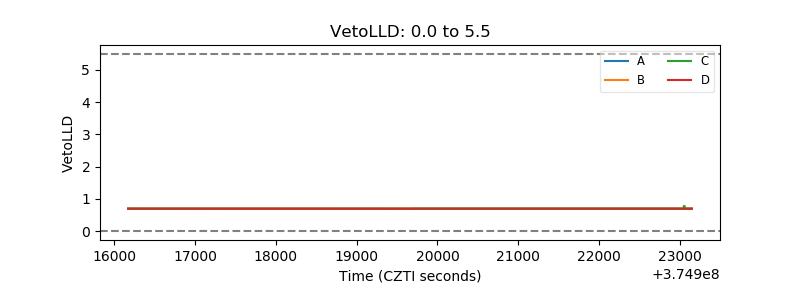 |
| Alpha Counter | 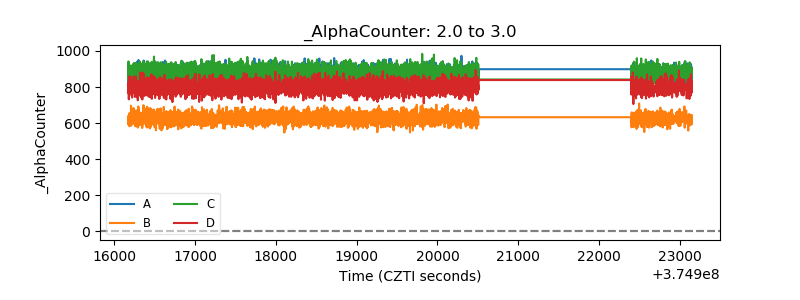 |
| _CPM_Rate | 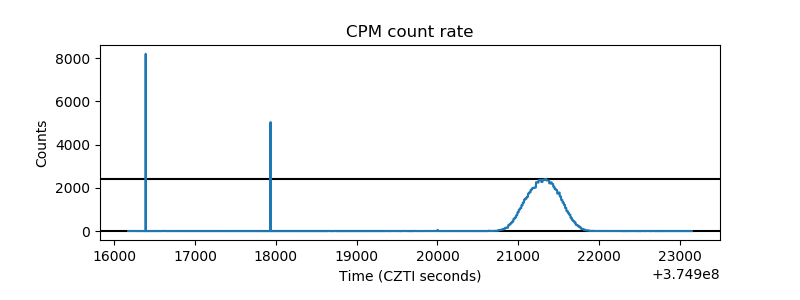 |
| CZT Counter | 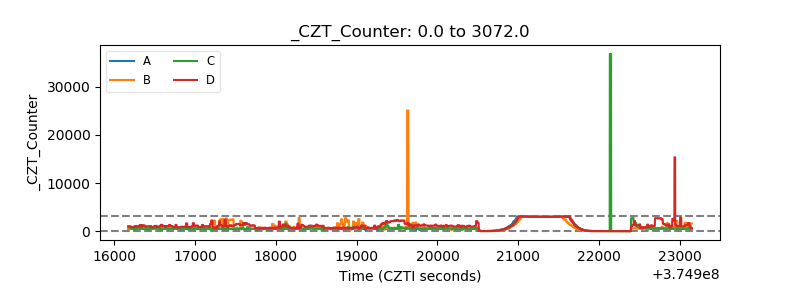 |
| +2.5 Volts monitor | 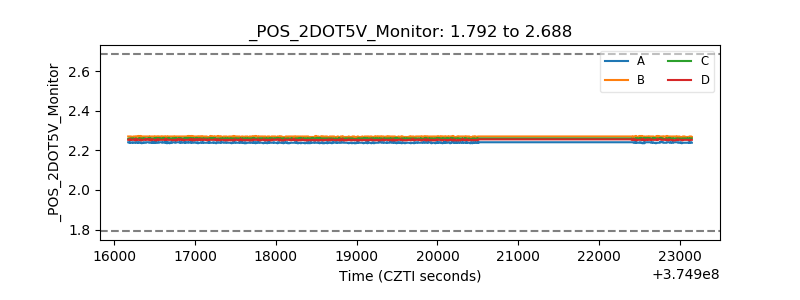 |
| +5 Volts monitor |  |
| _ROLL_ROT | 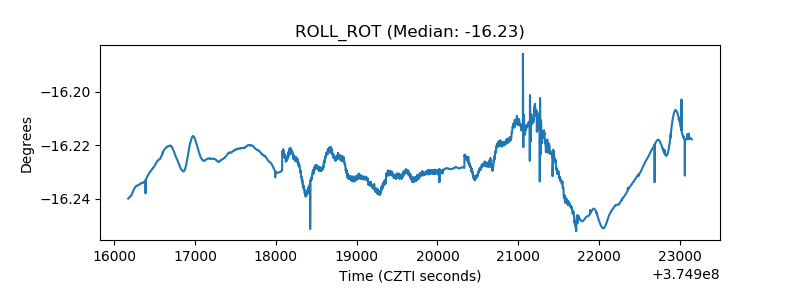 |
| _Roll_DEC | 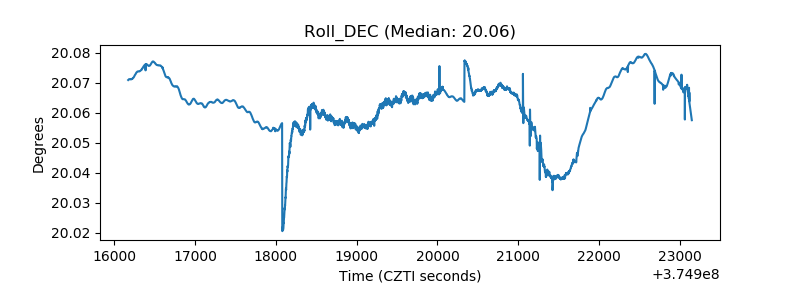 |
| _Roll_RA | 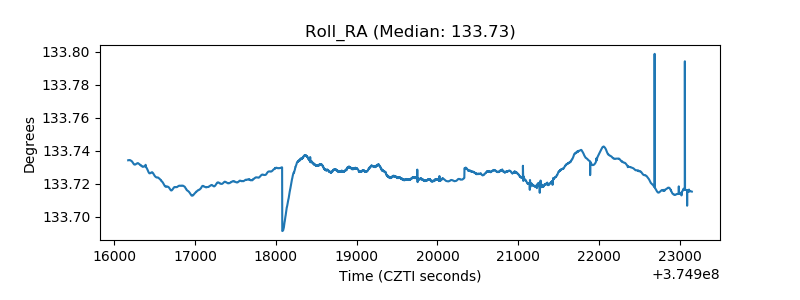 |
| Veto Counter | 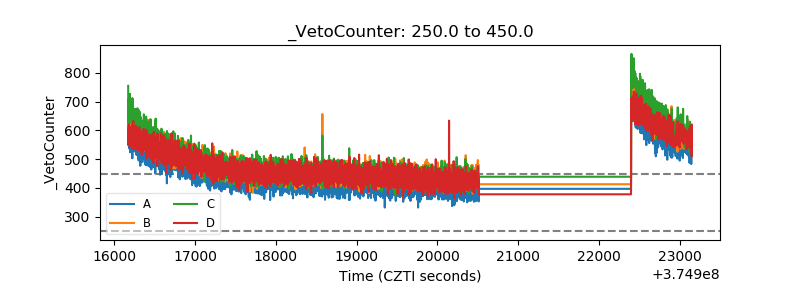 |