| Param | Original file | Final file |
|---|---|---|
| Filename | modeM0/AS1A10_067T01_9000004770_33205cztM0_level2.evt | modeM0/AS1A10_067T01_9000004770_33205cztM0_level2_quad_clean.evt |
| Size (bytes) | 497,880,000 | 56,197,440 |
| Size | 474.8 MB | 53.6 MB |
| Events in quadrant A | 2,629,678 | 353,707 |
| Events in quadrant B | 3,747,873 | 347,098 |
| Events in quadrant C | 3,164,694 | 341,003 |
| Events in quadrant D | 5,199,891 | 311,270 |
| Mode M9 | |||
|---|---|---|---|
| Quadrant | BADHDUFLAG | Total packets | Discarded packets |
| A | 0 | 20 | 0 |
| B | 0 | 20 | 0 |
| C | 0 | 20 | 0 |
| D | 0 | 20 | 0 |
| Mode M0 | |||
|---|---|---|---|
| Quadrant | BADHDUFLAG | Total packets | Discarded packets |
| A | 0 | 10625 | 3 |
| B | 0 | 14315 | 2 |
| C | 0 | 12314 | 2 |
| D | 0 | 19025 | 2 |
| Mode SS | |||
|---|---|---|---|
| Quadrant | BADHDUFLAG | Total packets | Discarded packets |
| A | 0 | 102 | 0 |
| B | 0 | 102 | 0 |
| C | 0 | 102 | 0 |
| D | 0 | 102 | 0 |
| Quadrant | Total seconds | Saturated seconds | Saturation percentage |
|---|---|---|---|
| A | 4962 | 5 | 0.100766% |
| B | 4962 | 334 | 6.731157% |
| C | 4962 | 168 | 3.385732% |
| D | 4962 | 262 | 5.280129% |
Noise dominated data is calculated using 1-second bins in cleaned event files. If a bin has >2000 counts, and if more than 50% of those come from <1% of pixels, then it is considered to be noise-dominated and hence unusable.
| Quadrant | # 1 sec bins | Bins with >0 counts | Bins with >2000 counts | High rate bins dominated by noise | Noise dominated (total time) | Noise dominated (detector-on time) | Marked lightcurve |
|---|---|---|---|---|---|---|---|
| A | 6965 | 4963 | 0 | 0 | 0.00% | 0.00% | 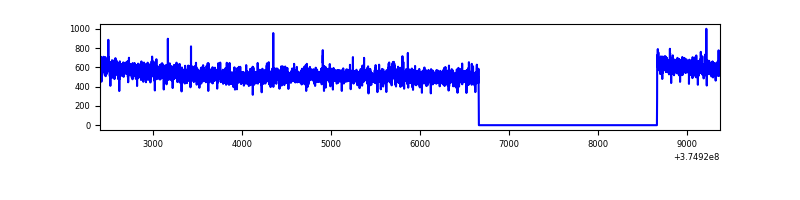 |
| B | 6965 | 4963 | 214 | 214 | 3.07% | 4.31% | 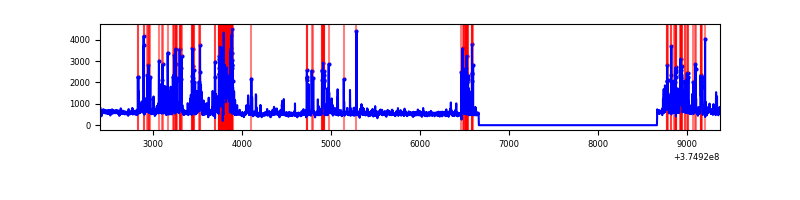 |
| C | 6965 | 4963 | 127 | 127 | 1.82% | 2.56% | 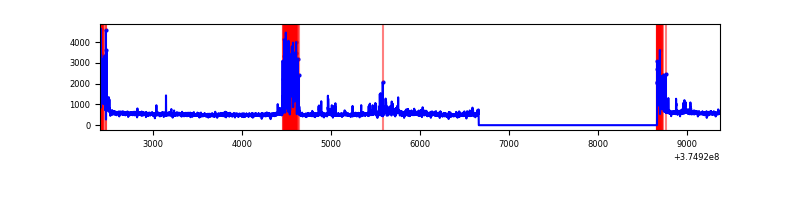 |
| D | 6965 | 4963 | 211 | 211 | 3.03% | 4.25% | 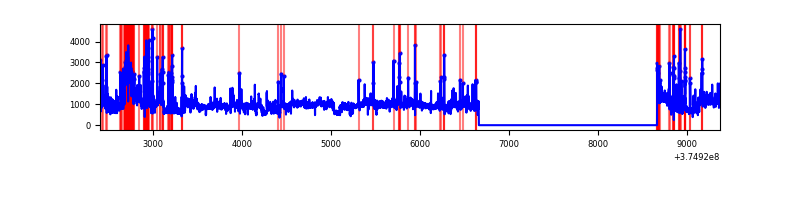 |
Top three noisy pixels from each quadrant. If the there are fewer than three noisy pixels in the level2.evt file, extra rows are filled as -1
| Pixel properties | Quadrant properties | ||||||
|---|---|---|---|---|---|---|---|
| Quadrant | DetID | PixID | Counts | Sigma | Mean | Median | Sigma |
| A | 13 | 254 | 7940 | 53.73 | 678 | 668 | 135.3 |
| A | 0 | 226 | 5905 | 38.69 | 678 | 668 | 135.3 |
| A | 3 | 137 | 5860 | 38.36 | 678 | 668 | 135.3 |
| B | 5 | 172 | 988637 | 8327.78 | 642 | 629 | 118.6 |
| B | 0 | 219 | 65538 | 547.11 | 642 | 629 | 118.6 |
| B | 0 | 197 | 45288 | 376.42 | 642 | 629 | 118.6 |
| C | 1 | 23 | 351120 | 2372.88 | 644 | 652 | 147.7 |
| C | 0 | 10 | 242893 | 1640.12 | 644 | 652 | 147.7 |
| C | 1 | 241 | 17333 | 112.94 | 644 | 652 | 147.7 |
| D | 8 | 195 | 1564147 | 9979.4 | 646 | 629 | 156.7 |
| D | 12 | 218 | 414707 | 2642.92 | 646 | 629 | 156.7 |
| D | 13 | 249 | 194919 | 1240.09 | 646 | 629 | 156.7 |
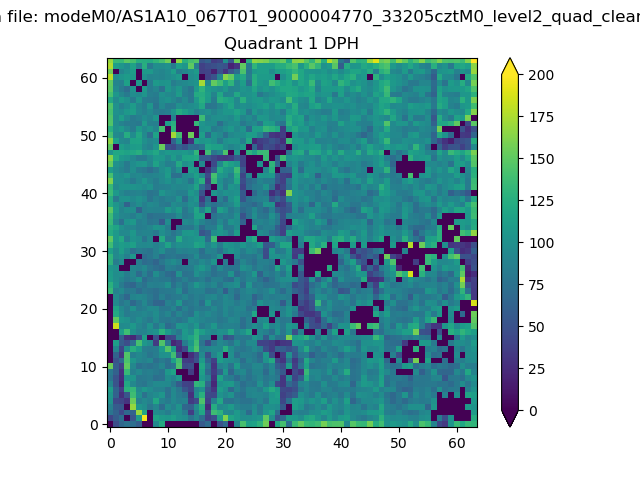
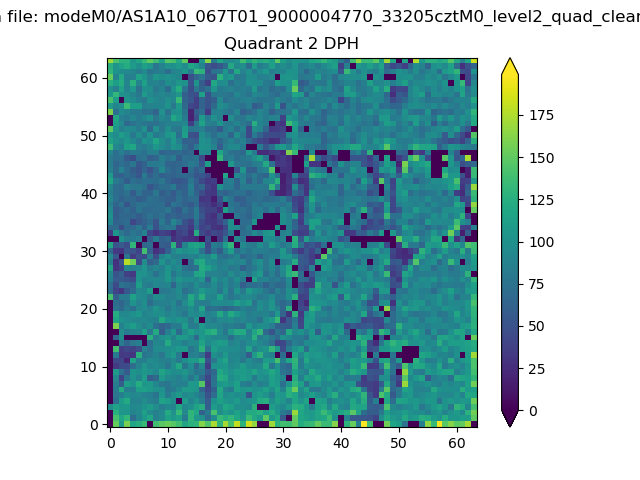
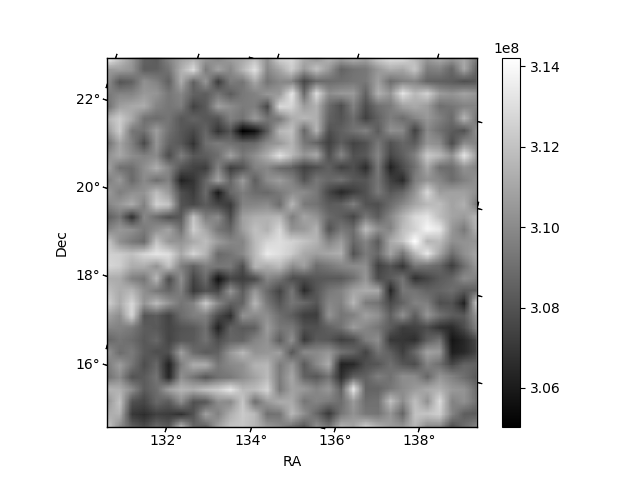
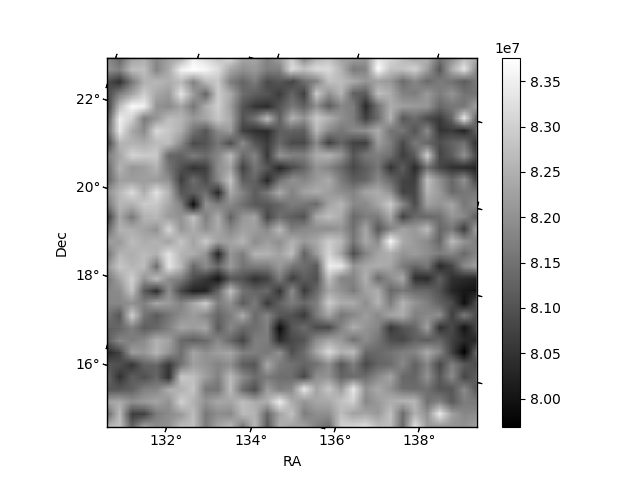
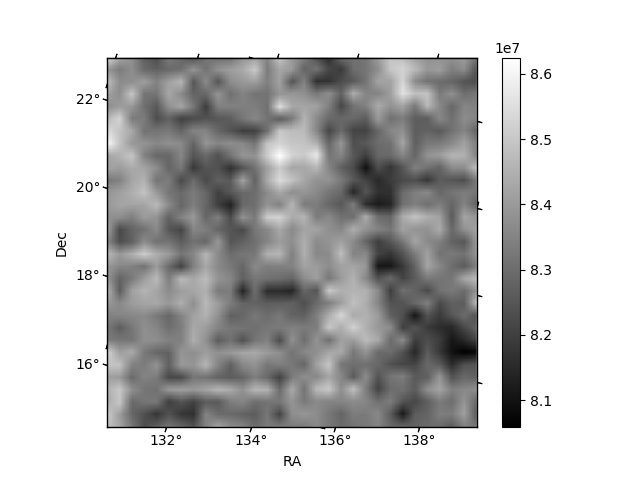
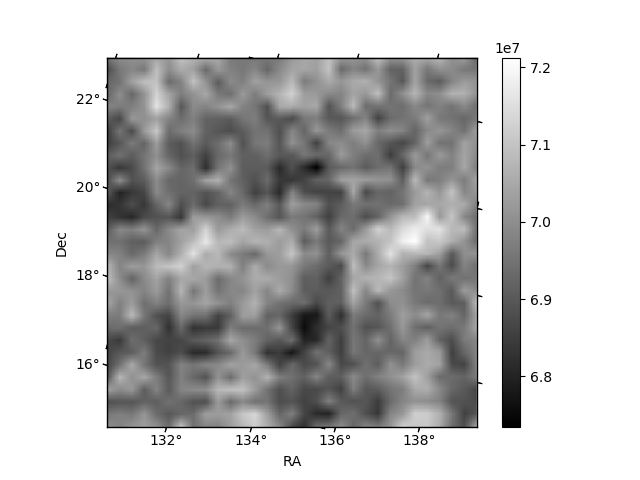
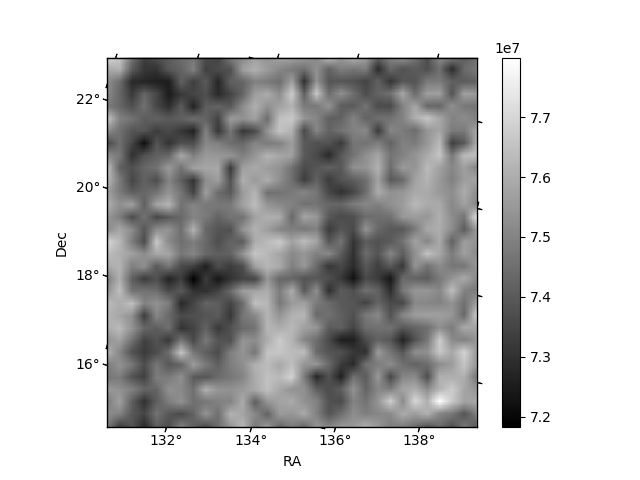
Histogram calculated using DETX and DETY for each event in the final _common_clean file
| Quadrant A |  |
 |
Quadrant B |
|---|---|---|---|
| Quadrant D | 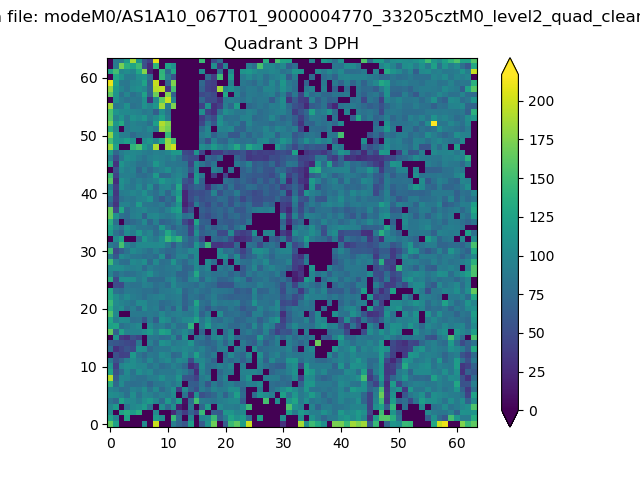 |
 |
Quadrant C |
| Plot type | Count rate plots | Images |
|---|---|---|
| Comparison with Poisson distribution Blue bars denote a histogram of data divided into 1 sec bins. Red curve is a Poisson curve with rate = median count rate of data. |
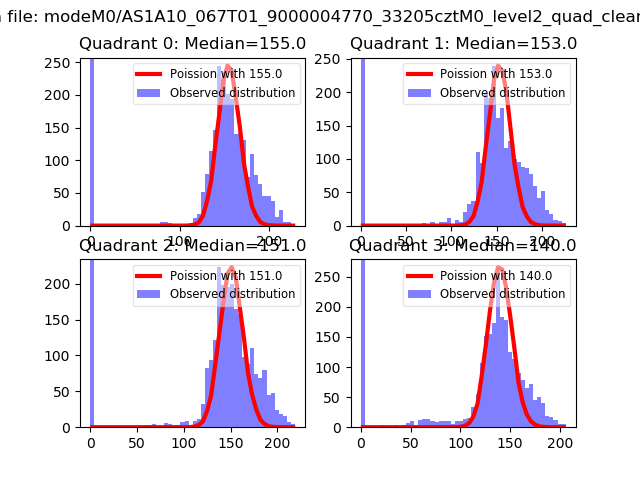 |
 |
| Quadrant-wise count rates Data is divided into 100 sec bins |
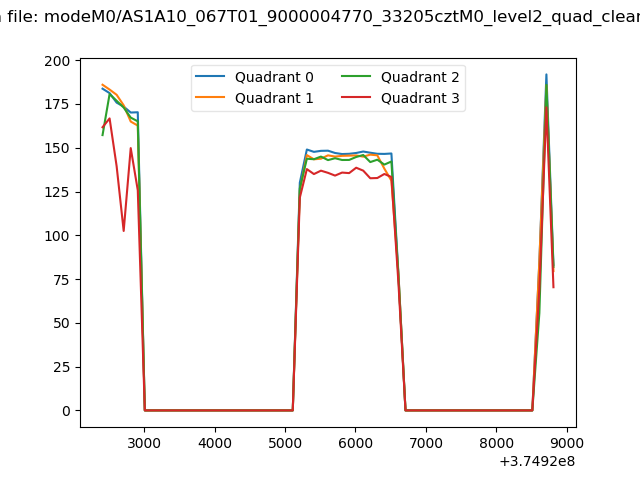 |
|
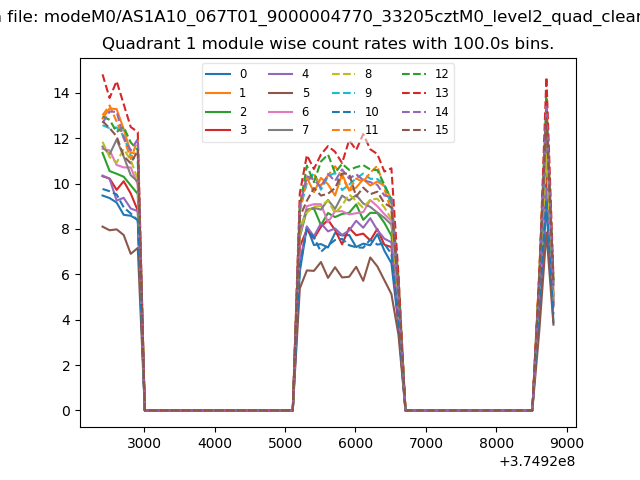
| Module-wise count rates for Quadrant A Data is divided into 100 sec bins |
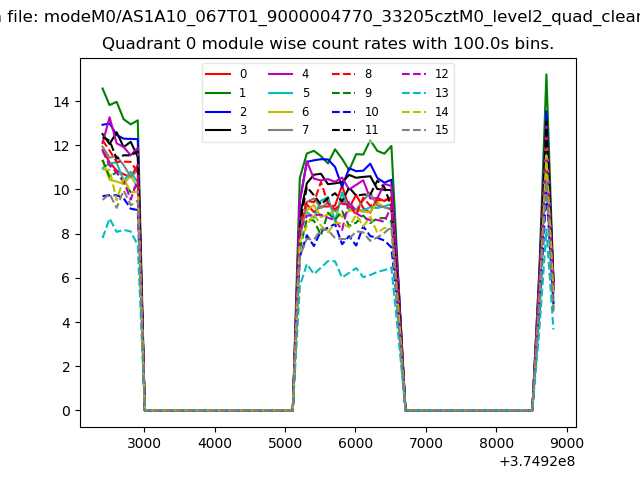 |
 |
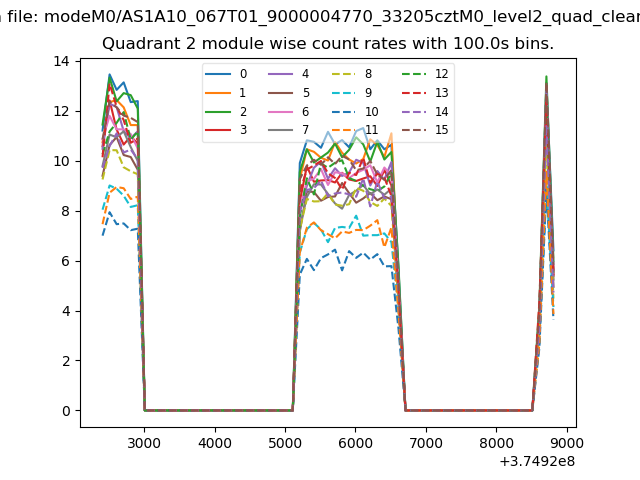
| Module-wise count rates for Quadrant B Data is divided into 100 sec bins |
 |
 |
| Module-wise count rates for Quadrant C Data is divided into 100 sec bins |
 |
 |
| Module-wise count rates for Quadrant D Data is divided into 100 sec bins |
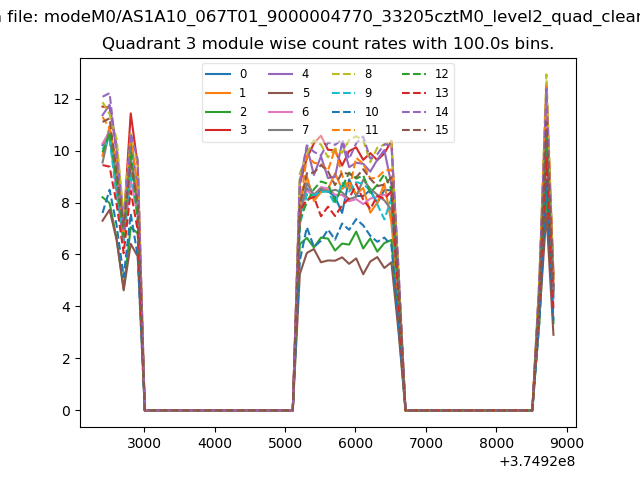 |
 |
| Parameter | Plot |
|---|---|
| CZT HV Monitor | 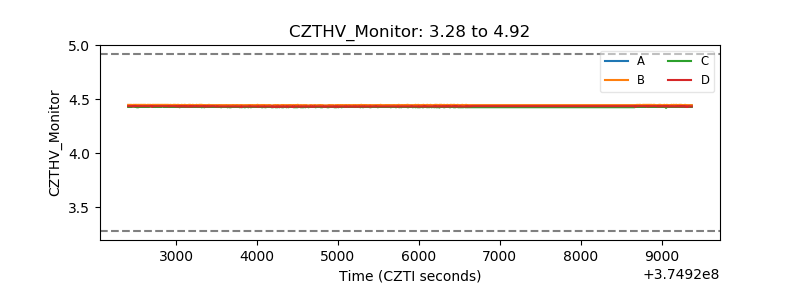 |
| D_VDD | 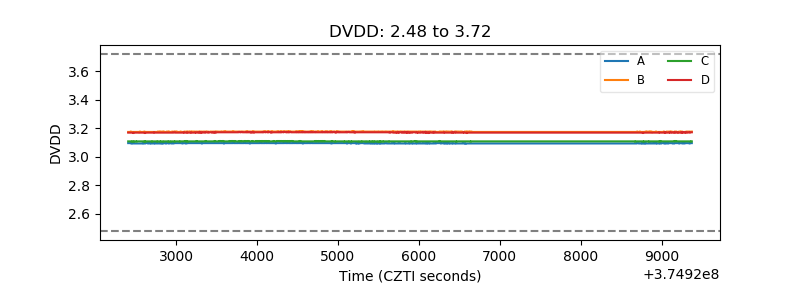 |
| Temperature 1 | 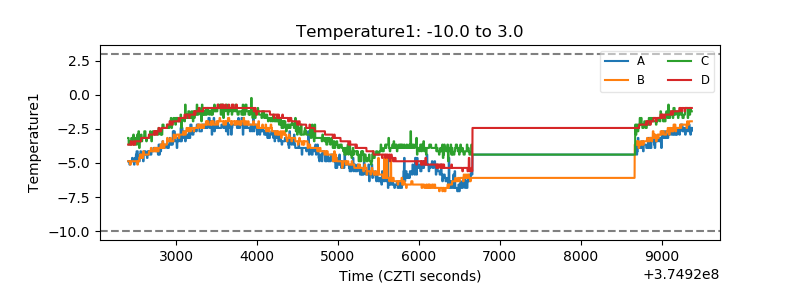 |
| Veto HV Monitor | 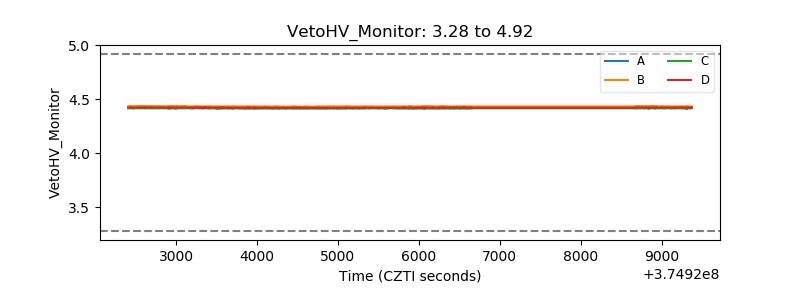 |
| Veto LLD | 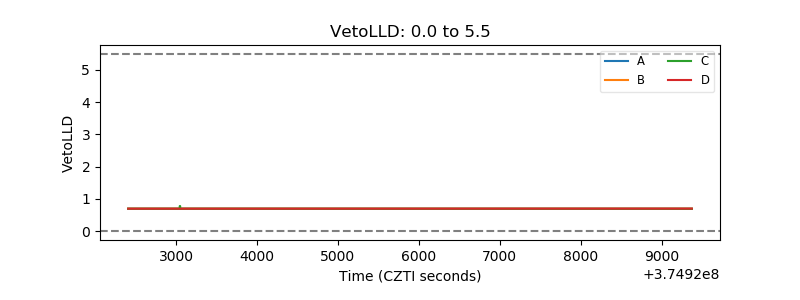 |
| Alpha Counter | 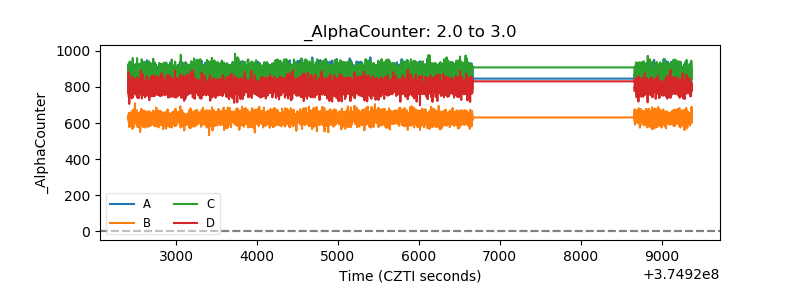 |
| _CPM_Rate | 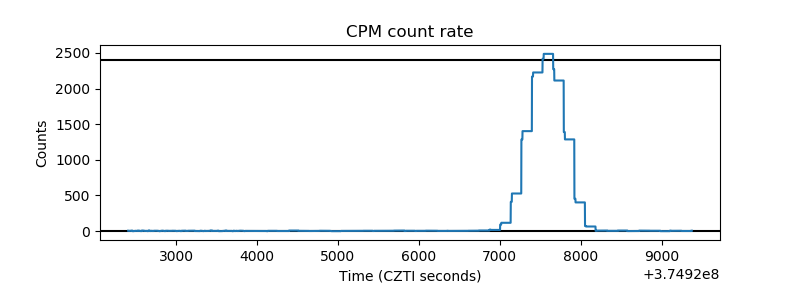 |
| CZT Counter | 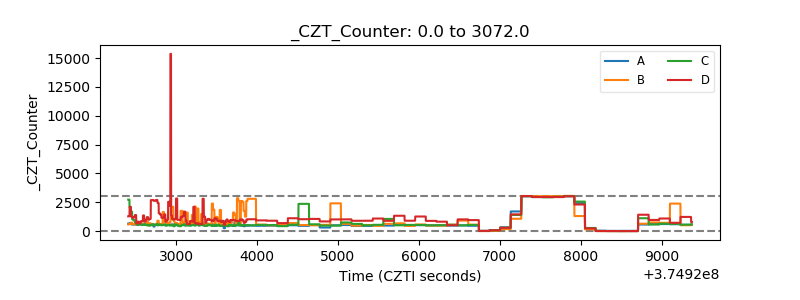 |
| +2.5 Volts monitor |  |
| +5 Volts monitor | 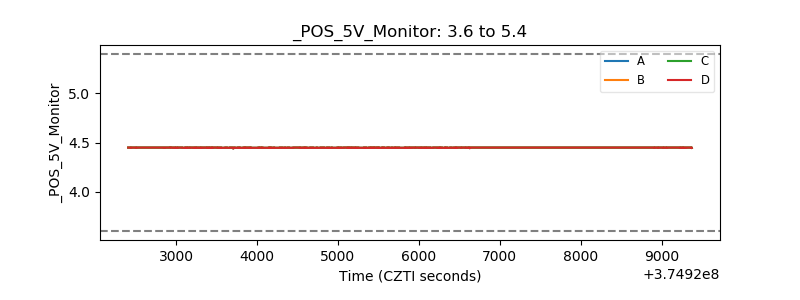 |
| _ROLL_ROT | 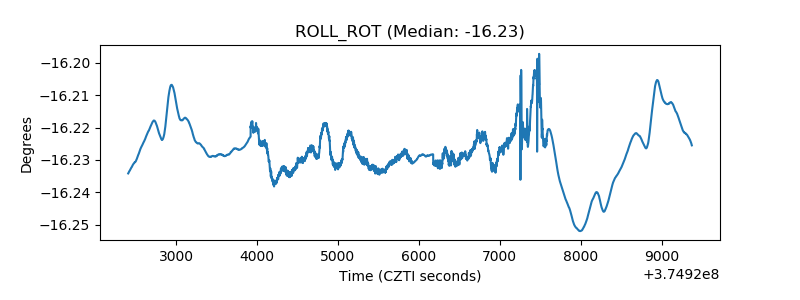 |
| _Roll_DEC | 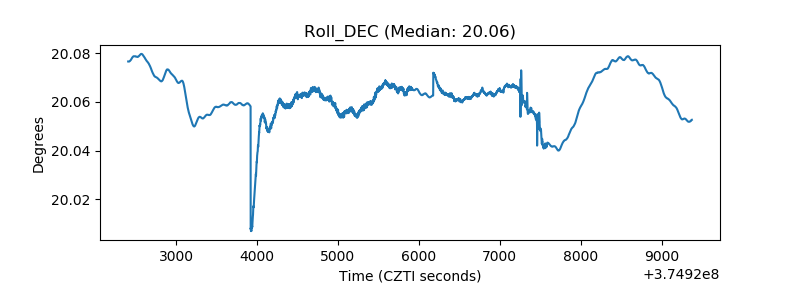 |
| _Roll_RA | 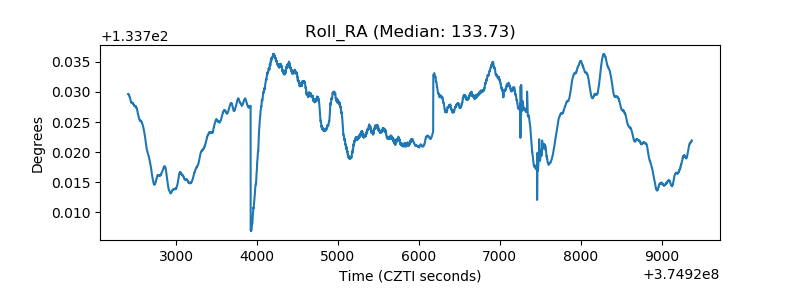 |
| Veto Counter | 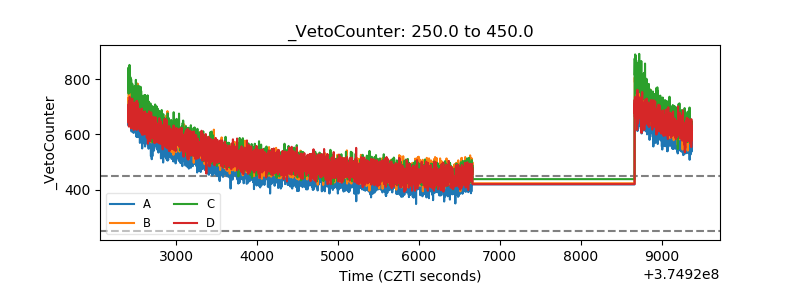 |