| Param | Original file | Final file |
|---|---|---|
| Filename | modeM0/AS1A10_067T01_9000004770_33207cztM0_level2.evt | modeM0/AS1A10_067T01_9000004770_33207cztM0_level2_quad_clean.evt |
| Size (bytes) | 561,003,840 | 52,885,440 |
| Size | 535.0 MB | 50.4 MB |
| Events in quadrant A | 2,706,628 | 324,757 |
| Events in quadrant B | 4,571,280 | 314,416 |
| Events in quadrant C | 4,036,013 | 296,183 |
| Events in quadrant D | 5,329,158 | 305,863 |
| Mode M9 | |||
|---|---|---|---|
| Quadrant | BADHDUFLAG | Total packets | Discarded packets |
| A | 0 | 21 | 0 |
| B | 0 | 21 | 0 |
| C | 0 | 21 | 0 |
| D | 0 | 21 | 0 |
| Mode M0 | |||
|---|---|---|---|
| Quadrant | BADHDUFLAG | Total packets | Discarded packets |
| A | 0 | 10953 | 3 |
| B | 0 | 17027 | 2 |
| C | 0 | 15207 | 2 |
| D | 0 | 19494 | 2 |
| Mode SS | |||
|---|---|---|---|
| Quadrant | BADHDUFLAG | Total packets | Discarded packets |
| A | 0 | 104 | 0 |
| B | 0 | 104 | 0 |
| C | 0 | 104 | 0 |
| D | 0 | 104 | 0 |
| Quadrant | Total seconds | Saturated seconds | Saturation percentage |
|---|---|---|---|
| A | 5135 | 10 | 0.194742% |
| B | 5135 | 717 | 13.962999% |
| C | 5135 | 368 | 7.166504% |
| D | 5135 | 145 | 2.823759% |
Noise dominated data is calculated using 1-second bins in cleaned event files. If a bin has >2000 counts, and if more than 50% of those come from <1% of pixels, then it is considered to be noise-dominated and hence unusable.
| Quadrant | # 1 sec bins | Bins with >0 counts | Bins with >2000 counts | High rate bins dominated by noise | Noise dominated (total time) | Noise dominated (detector-on time) | Marked lightcurve |
|---|---|---|---|---|---|---|---|
| A | 7258 | 5136 | 1 | 1 | 0.01% | 0.02% | 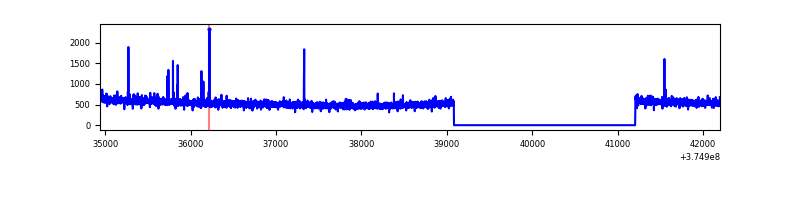 |
| B | 7258 | 5136 | 493 | 493 | 6.79% | 9.60% | 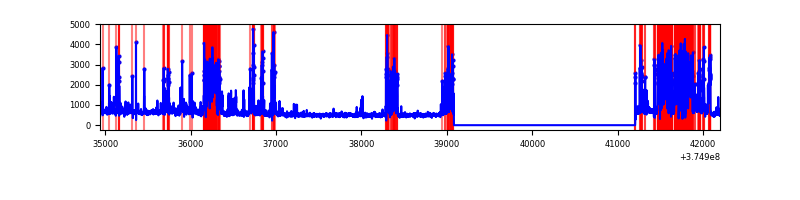 |
| C | 7258 | 5136 | 309 | 309 | 4.26% | 6.02% | 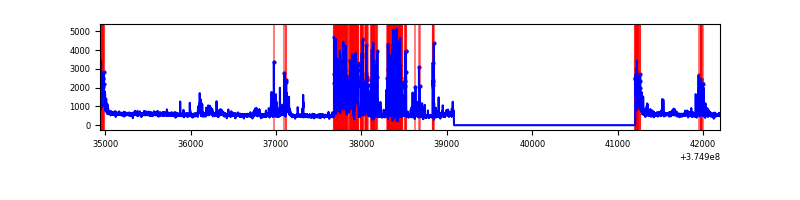 |
| D | 7258 | 5136 | 117 | 117 | 1.61% | 2.28% | 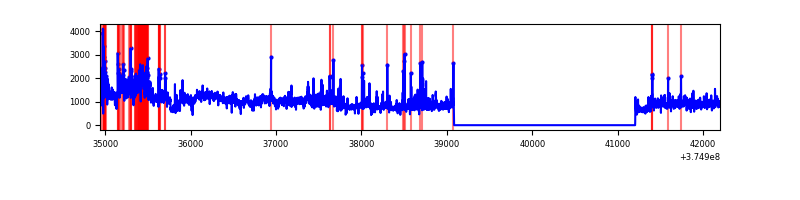 |
Top three noisy pixels from each quadrant. If the there are fewer than three noisy pixels in the level2.evt file, extra rows are filled as -1
| Pixel properties | Quadrant properties | ||||||
|---|---|---|---|---|---|---|---|
| Quadrant | DetID | PixID | Counts | Sigma | Mean | Median | Sigma |
| A | 15 | 169 | 11742 | 81.11 | 690 | 679 | 136.4 |
| A | 13 | 254 | 9393 | 63.89 | 690 | 679 | 136.4 |
| A | 9 | 191 | 7043 | 46.66 | 690 | 679 | 136.4 |
| B | 5 | 172 | 1711118 | 14478.66 | 638 | 624 | 118.1 |
| B | 0 | 221 | 86011 | 722.77 | 638 | 624 | 118.1 |
| B | 0 | 197 | 80023 | 672.08 | 638 | 624 | 118.1 |
| C | 1 | 23 | 1034271 | 6937.16 | 655 | 661 | 149.0 |
| C | 0 | 10 | 280182 | 1876.03 | 655 | 661 | 149.0 |
| C | 9 | 187 | 70983 | 471.97 | 655 | 661 | 149.0 |
| D | 8 | 195 | 2009752 | 12055.2 | 670 | 656 | 166.7 |
| D | 1 | 52 | 199558 | 1193.47 | 670 | 656 | 166.7 |
| D | 2 | 250 | 159253 | 951.63 | 670 | 656 | 166.7 |
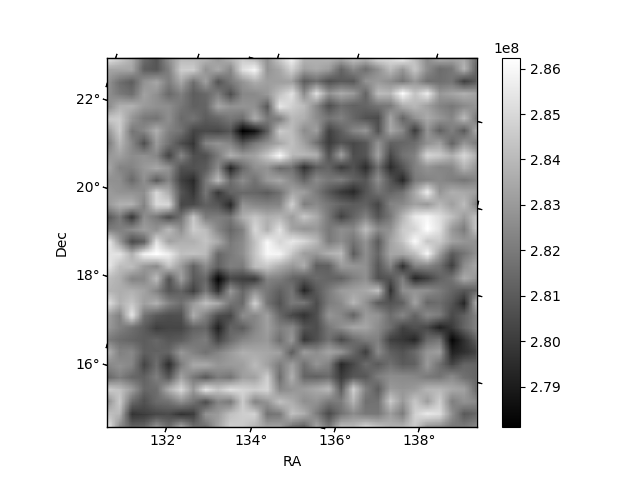
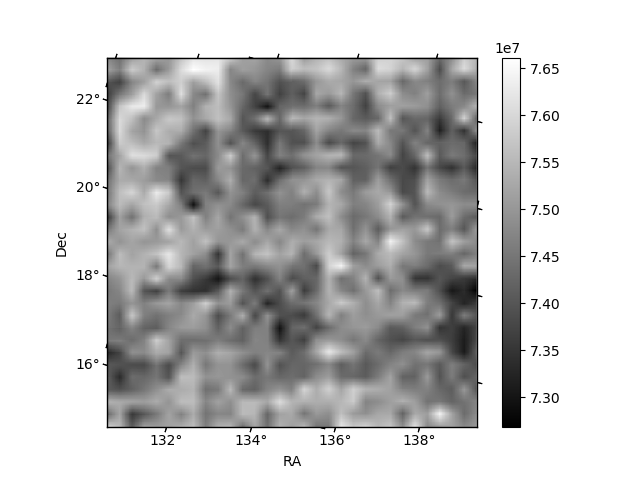
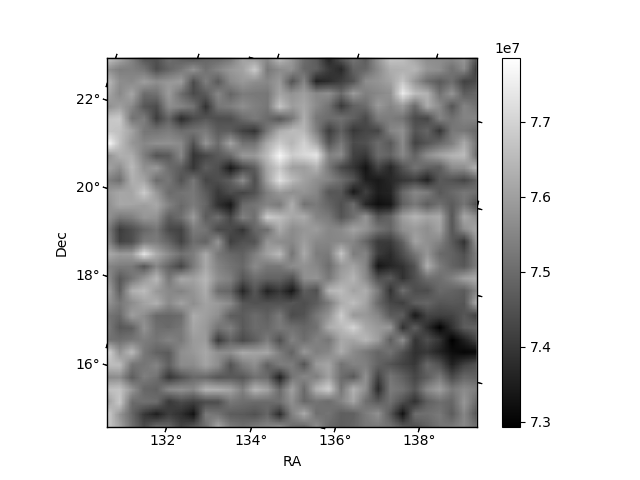
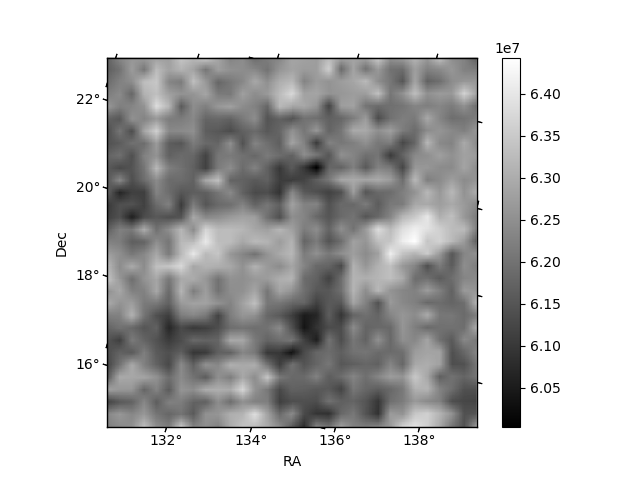
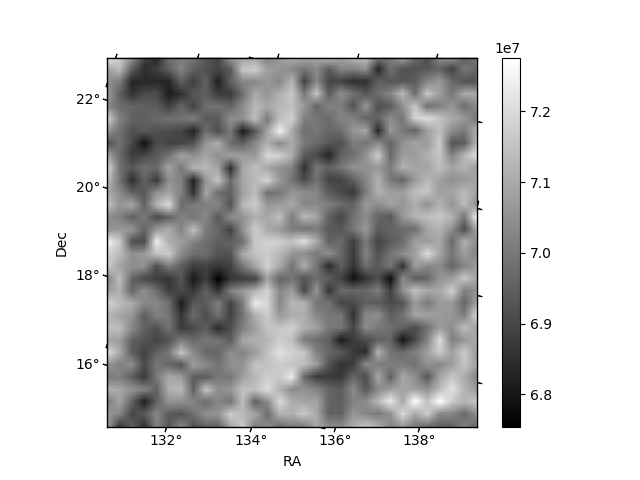
Histogram calculated using DETX and DETY for each event in the final _common_clean file
| Quadrant A | 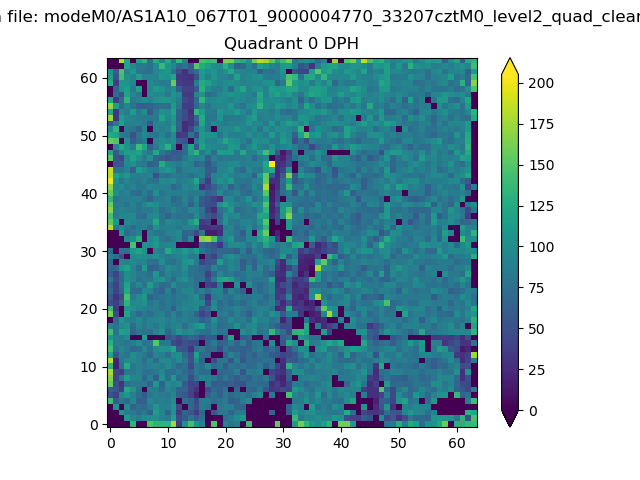 |
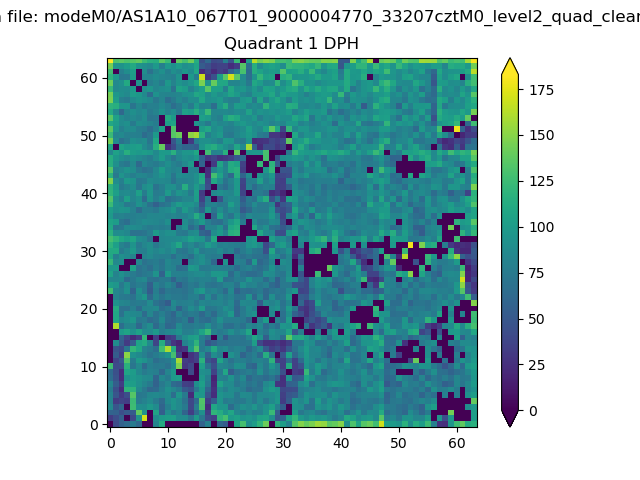 |
Quadrant B |
|---|---|---|---|
| Quadrant D | 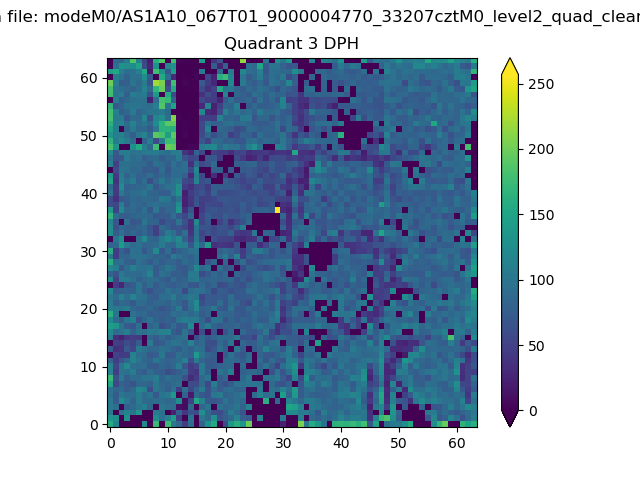 |
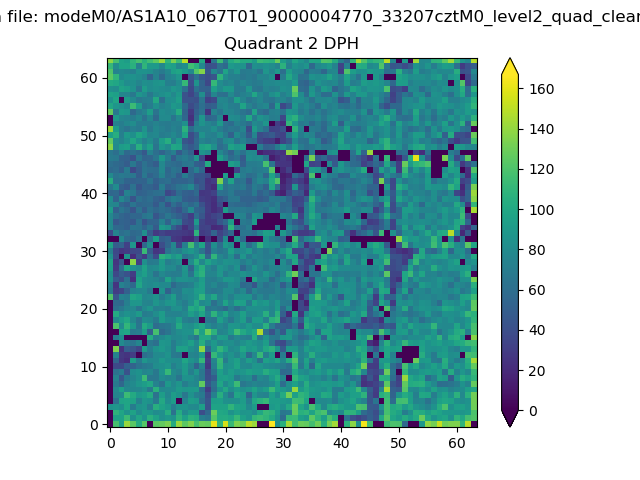 |
Quadrant C |
| Plot type | Count rate plots | Images |
|---|---|---|
| Comparison with Poisson distribution Blue bars denote a histogram of data divided into 1 sec bins. Red curve is a Poisson curve with rate = median count rate of data. |
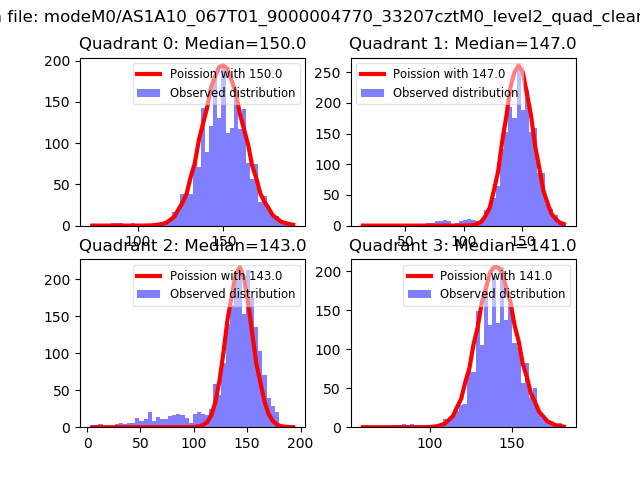 |
 |
| Quadrant-wise count rates Data is divided into 100 sec bins |
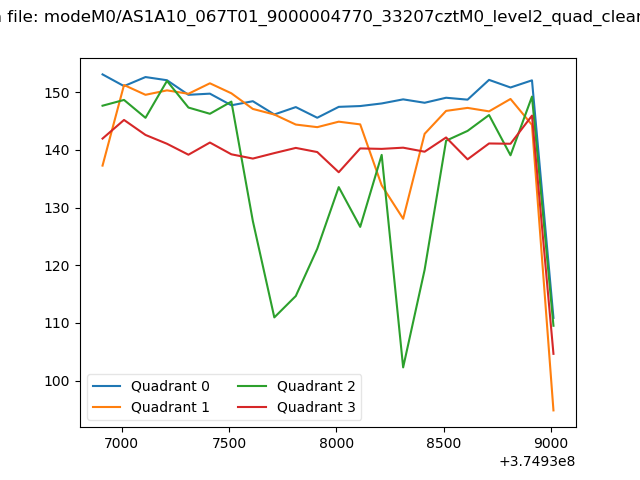 |
|
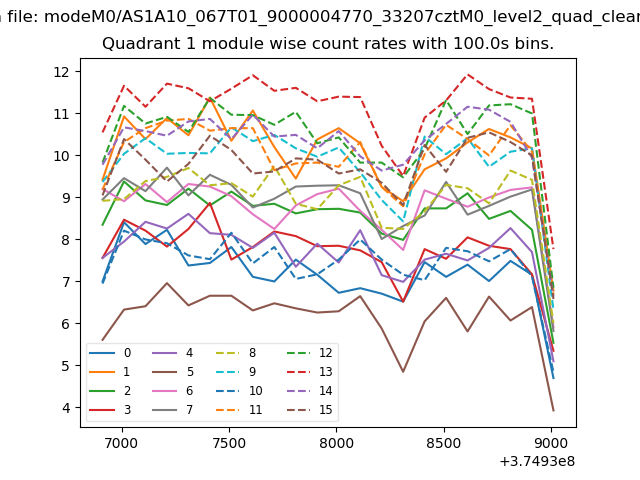
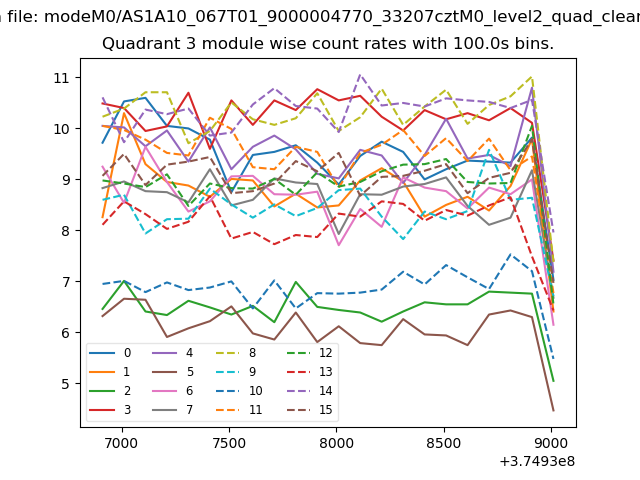
| Module-wise count rates for Quadrant A Data is divided into 100 sec bins |
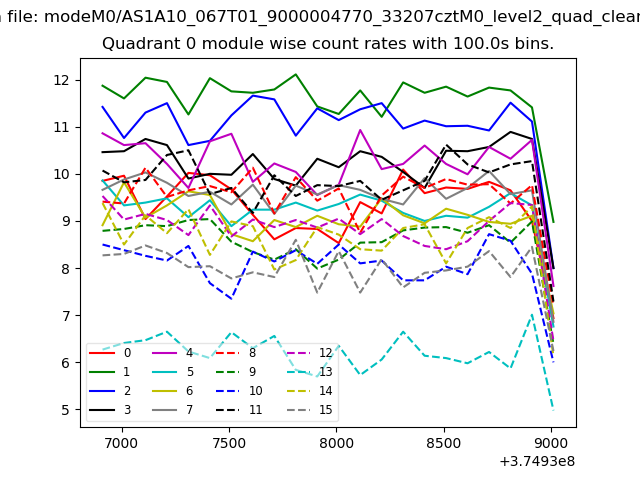 |
 |
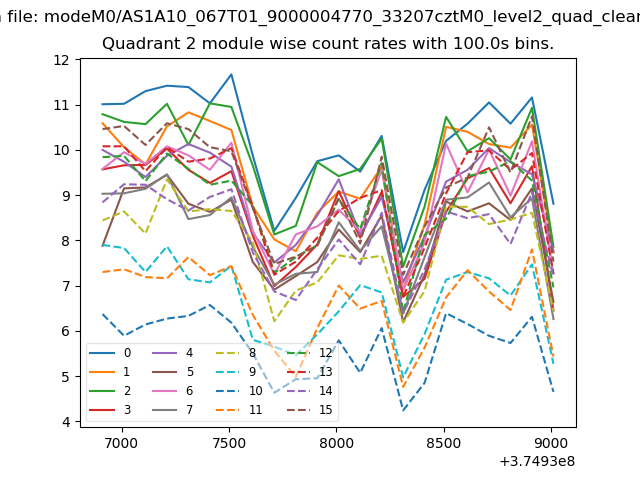
| Module-wise count rates for Quadrant B Data is divided into 100 sec bins |
 |
 |
| Module-wise count rates for Quadrant C Data is divided into 100 sec bins |
 |
 |
| Module-wise count rates for Quadrant D Data is divided into 100 sec bins |
 |
 |
| Parameter | Plot |
|---|---|
| CZT HV Monitor | 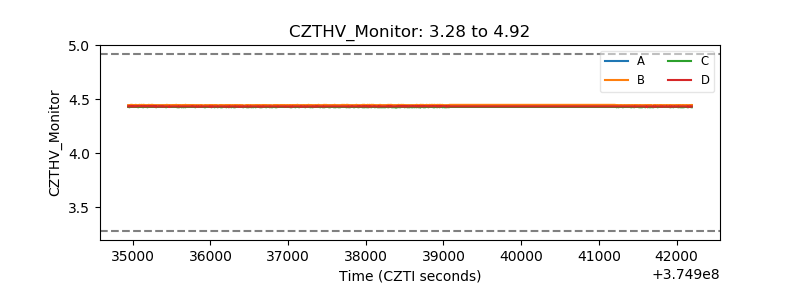 |
| D_VDD | 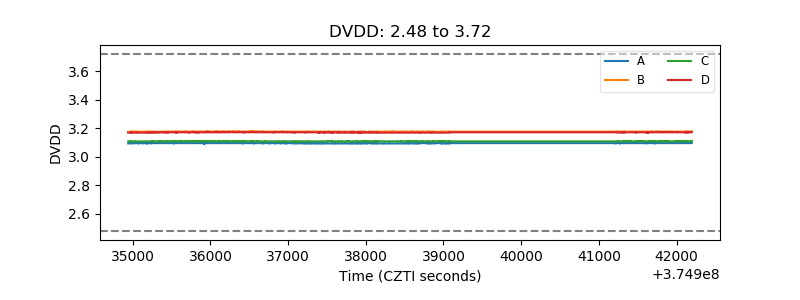 |
| Temperature 1 | 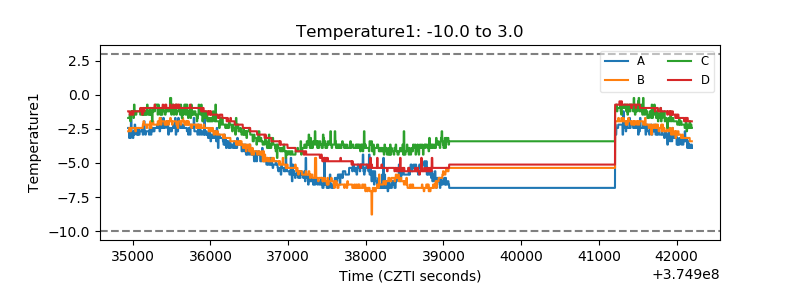 |
| Veto HV Monitor | 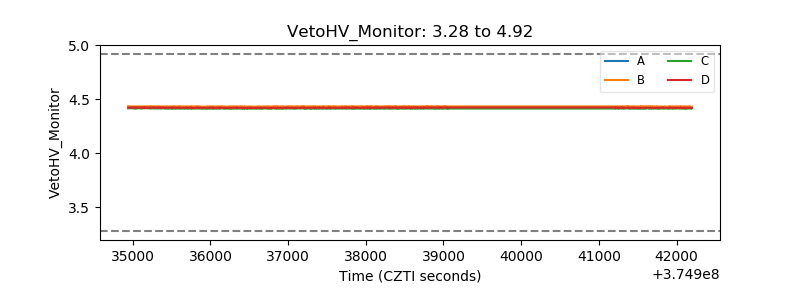 |
| Veto LLD | 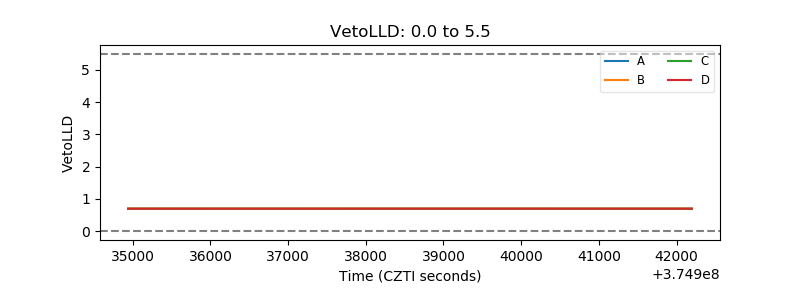 |
| Alpha Counter | 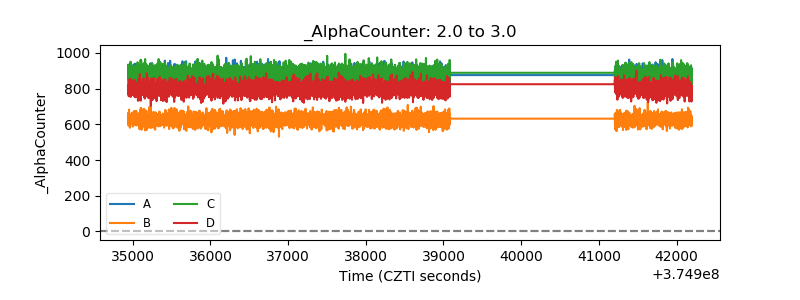 |
| _CPM_Rate | 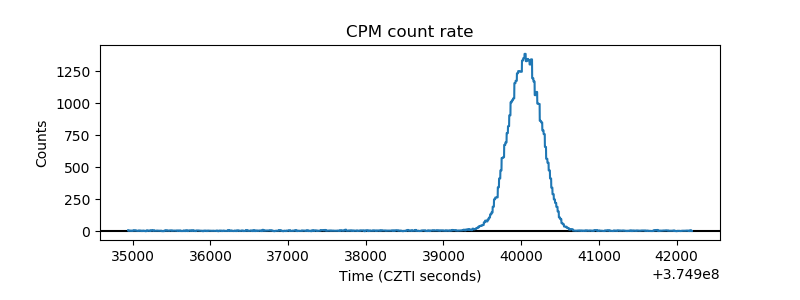 |
| CZT Counter | 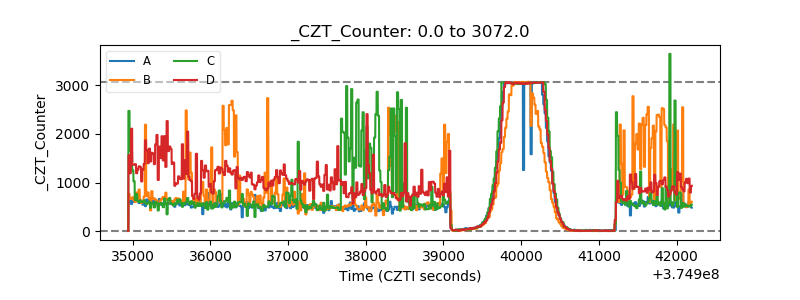 |
| +2.5 Volts monitor |  |
| +5 Volts monitor |  |
| _ROLL_ROT | 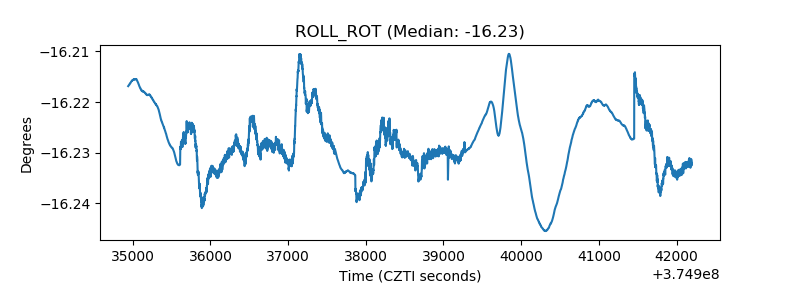 |
| _Roll_DEC | 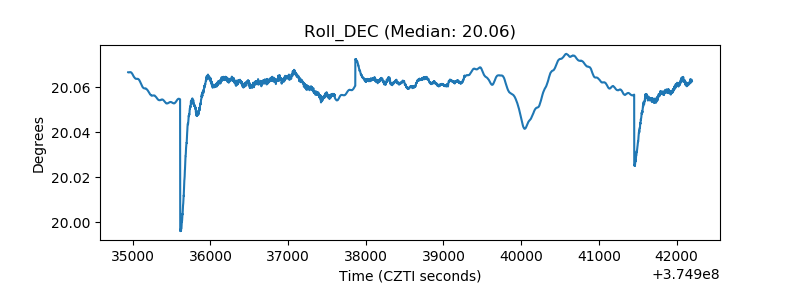 |
| _Roll_RA | 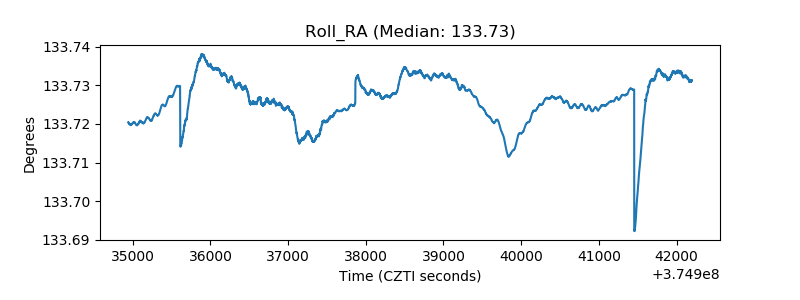 |
| Veto Counter | 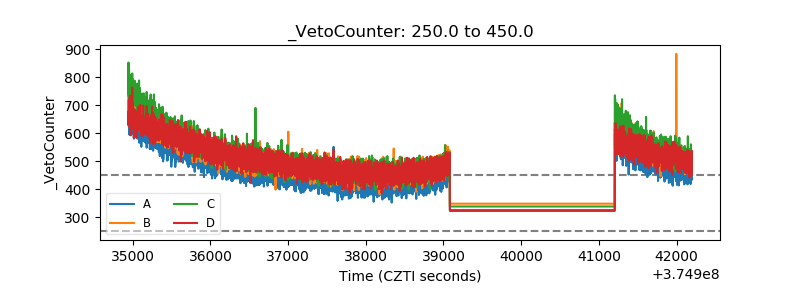 |