| Param | Original file | Final file |
|---|---|---|
| Filename | modeM0/AS1A10_067T01_9000004770_33208cztM0_level2.evt | modeM0/AS1A10_067T01_9000004770_33208cztM0_level2_quad_clean.evt |
| Size (bytes) | 451,661,760 | 60,946,560 |
| Size | 430.7 MB | 58.1 MB |
| Events in quadrant A | 2,535,717 | 379,952 |
| Events in quadrant B | 3,843,503 | 373,946 |
| Events in quadrant C | 3,022,449 | 372,137 |
| Events in quadrant D | 3,931,546 | 362,406 |
| Mode M9 | |||
|---|---|---|---|
| Quadrant | BADHDUFLAG | Total packets | Discarded packets |
| A | 0 | 28 | 0 |
| B | 0 | 28 | 0 |
| C | 0 | 28 | 0 |
| D | 0 | 29 | 0 |
| Mode M0 | |||
|---|---|---|---|
| Quadrant | BADHDUFLAG | Total packets | Discarded packets |
| A | 0 | 10494 | 3 |
| B | 0 | 14679 | 2 |
| C | 0 | 12053 | 2 |
| D | 0 | 15360 | 2 |
| Mode SS | |||
|---|---|---|---|
| Quadrant | BADHDUFLAG | Total packets | Discarded packets |
| A | 0 | 104 | 0 |
| B | 0 | 104 | 0 |
| C | 0 | 104 | 0 |
| D | 0 | 104 | 0 |
| Quadrant | Total seconds | Saturated seconds | Saturation percentage |
|---|---|---|---|
| A | 5090 | 6 | 0.117878% |
| B | 5090 | 491 | 9.646365% |
| C | 5090 | 125 | 2.455796% |
| D | 5090 | 56 | 1.100196% |
Noise dominated data is calculated using 1-second bins in cleaned event files. If a bin has >2000 counts, and if more than 50% of those come from <1% of pixels, then it is considered to be noise-dominated and hence unusable.
| Quadrant | # 1 sec bins | Bins with >0 counts | Bins with >2000 counts | High rate bins dominated by noise | Noise dominated (total time) | Noise dominated (detector-on time) | Marked lightcurve |
|---|---|---|---|---|---|---|---|
| A | 7153 | 5091 | 0 | 0 | 0.00% | 0.00% | 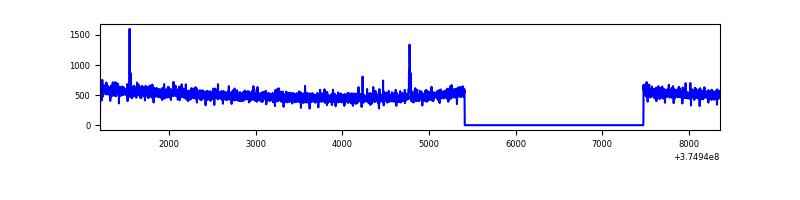 |
| B | 7153 | 5091 | 320 | 320 | 4.47% | 6.29% | 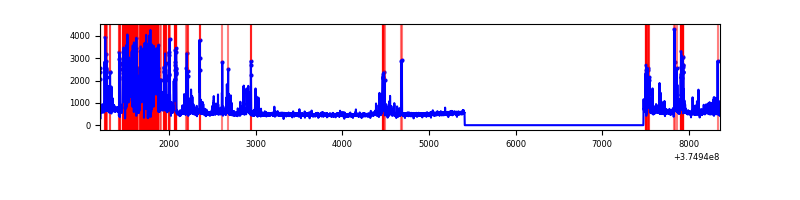 |
| C | 7153 | 5091 | 98 | 98 | 1.37% | 1.92% | 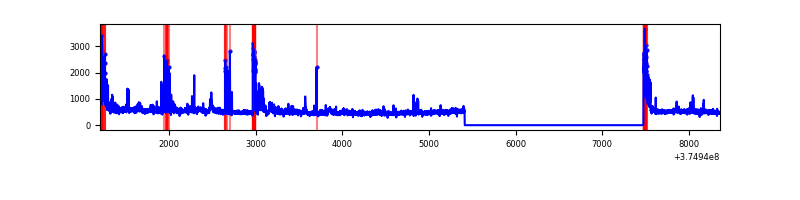 |
| D | 7153 | 5091 | 35 | 35 | 0.49% | 0.69% | 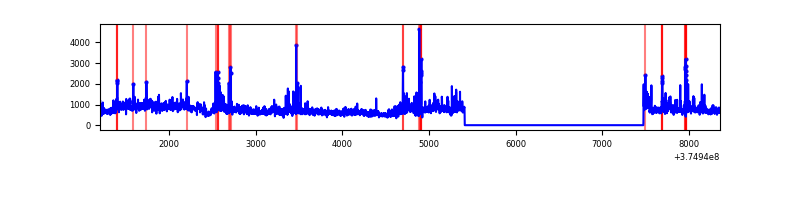 |
Top three noisy pixels from each quadrant. If the there are fewer than three noisy pixels in the level2.evt file, extra rows are filled as -1
| Pixel properties | Quadrant properties | ||||||
|---|---|---|---|---|---|---|---|
| Quadrant | DetID | PixID | Counts | Sigma | Mean | Median | Sigma |
| A | 14 | 254 | 13320 | 97.73 | 649 | 637 | 129.8 |
| A | 13 | 254 | 9353 | 67.16 | 649 | 637 | 129.8 |
| A | 13 | 6 | 7655 | 54.08 | 649 | 637 | 129.8 |
| B | 5 | 172 | 1167806 | 10102.15 | 614 | 601 | 115.5 |
| B | 4 | 170 | 56451 | 483.38 | 614 | 601 | 115.5 |
| B | 0 | 219 | 48722 | 416.49 | 614 | 601 | 115.5 |
| C | 0 | 10 | 229790 | 1603.88 | 625 | 632 | 142.9 |
| C | 9 | 187 | 136184 | 948.73 | 625 | 632 | 142.9 |
| C | 1 | 23 | 89065 | 618.94 | 625 | 632 | 142.9 |
| D | 8 | 195 | 987756 | 5950.93 | 629 | 617 | 165.9 |
| D | 13 | 249 | 108844 | 652.44 | 629 | 617 | 165.9 |
| D | 10 | 203 | 88581 | 530.28 | 629 | 617 | 165.9 |
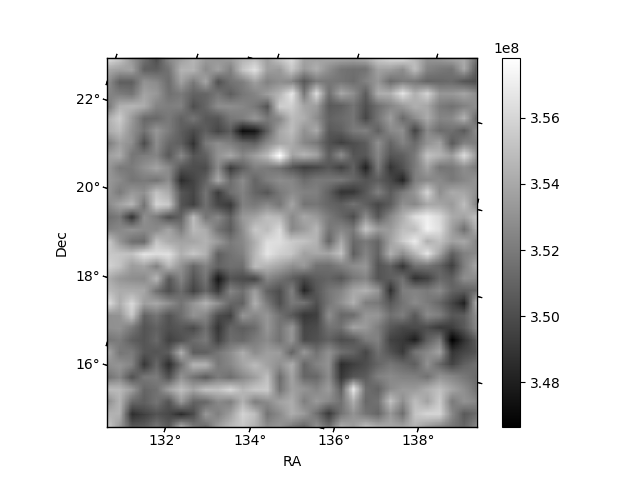
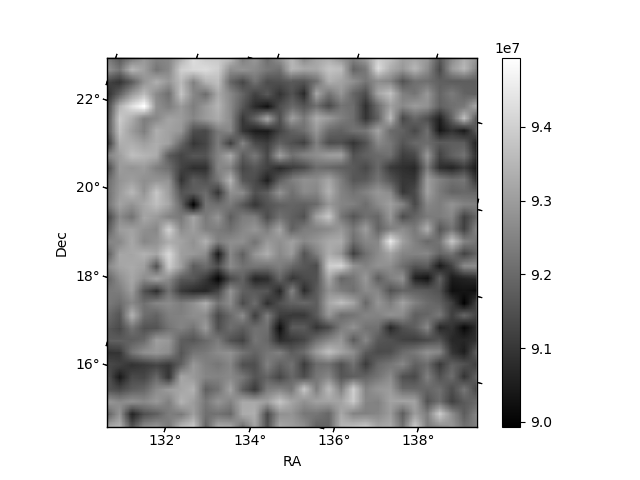
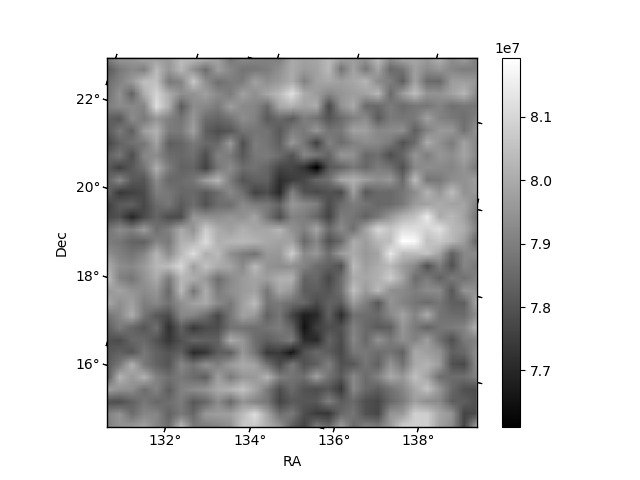
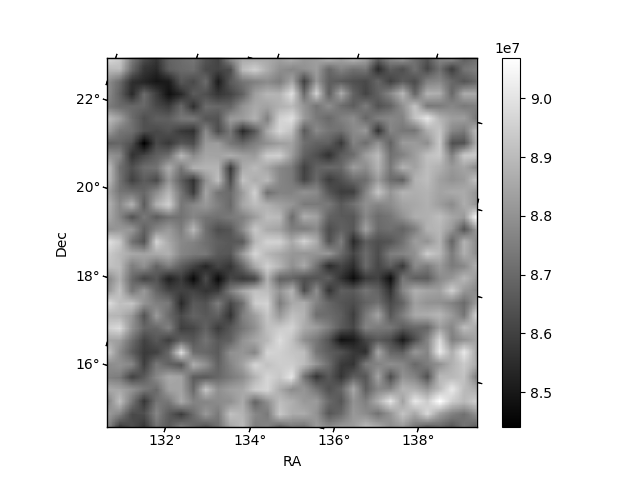
Histogram calculated using DETX and DETY for each event in the final _common_clean file
| Quadrant A | 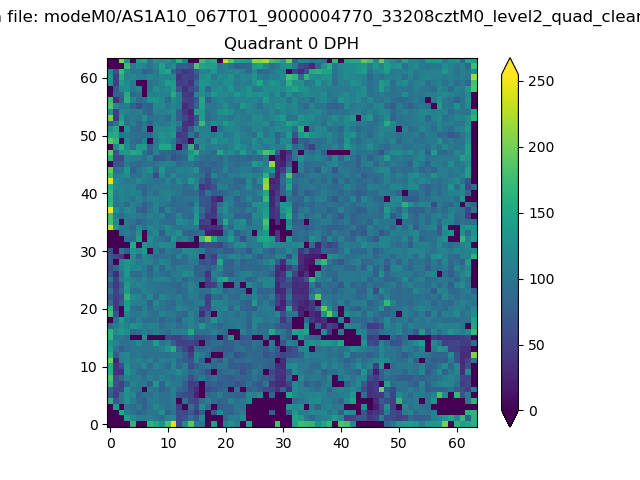 |
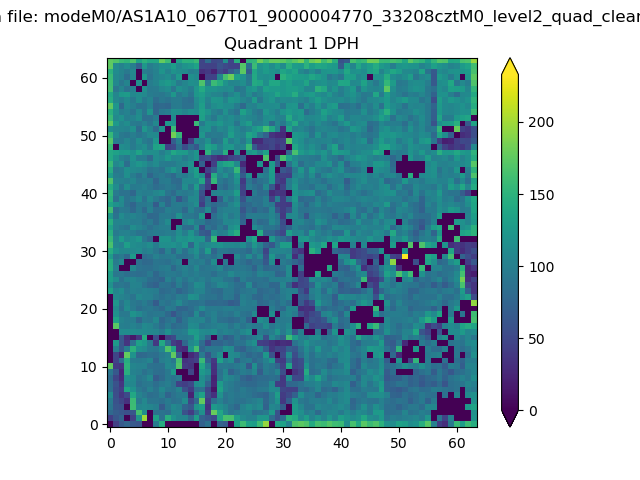 |
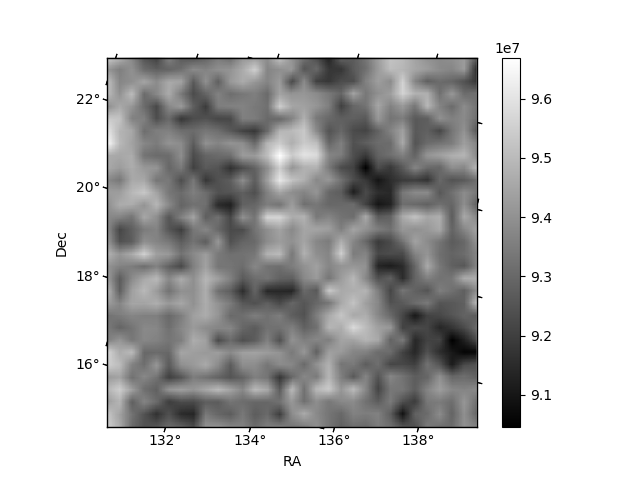
Quadrant B |
|---|---|---|---|
| Quadrant D | 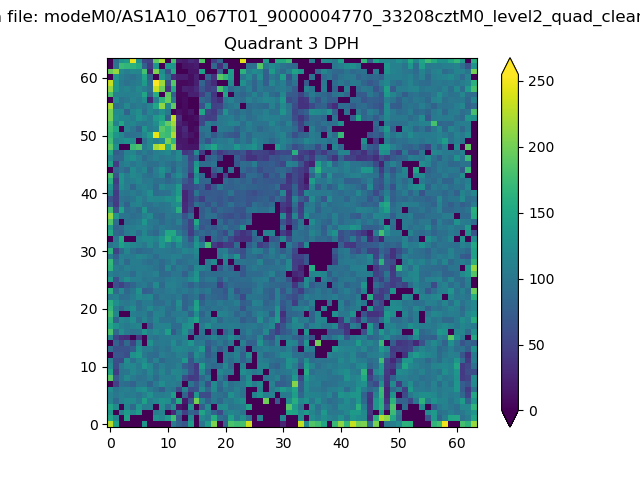 |
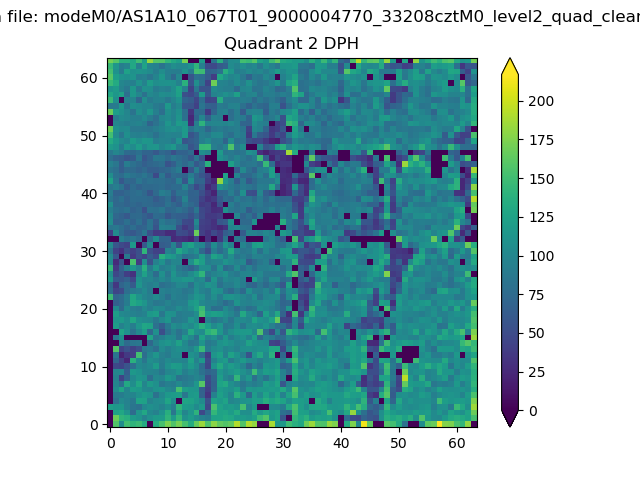 |
Quadrant C |
| Plot type | Count rate plots | Images |
|---|---|---|
| Comparison with Poisson distribution Blue bars denote a histogram of data divided into 1 sec bins. Red curve is a Poisson curve with rate = median count rate of data. |
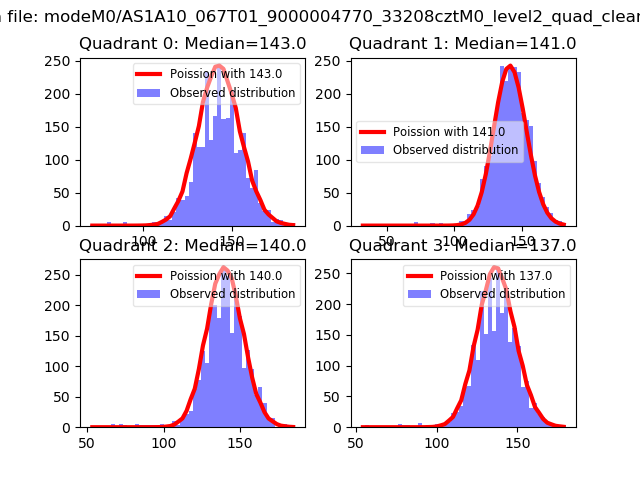 |
 |
| Quadrant-wise count rates Data is divided into 100 sec bins |
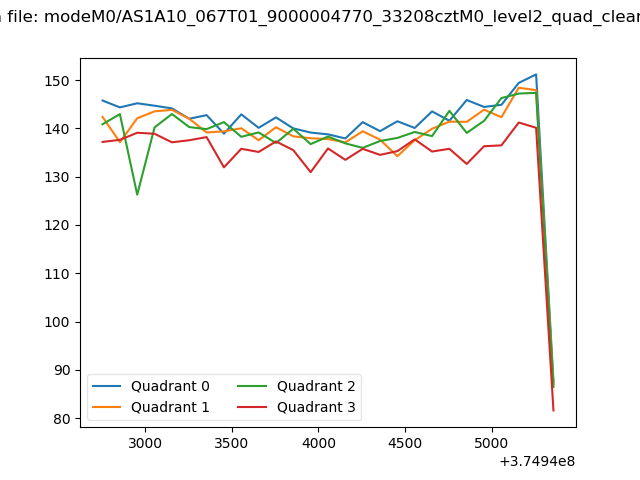 |
|
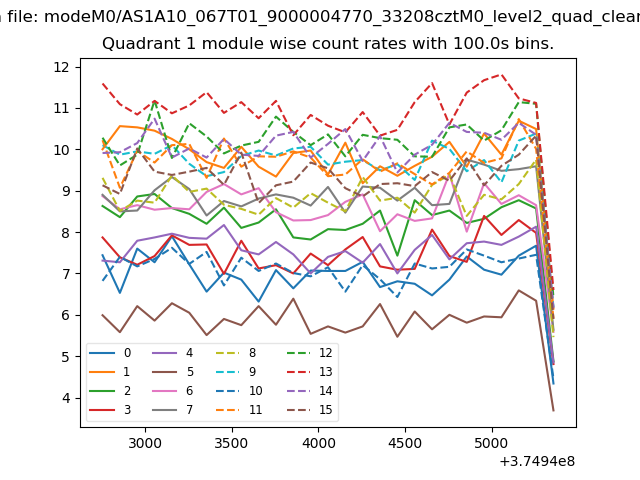
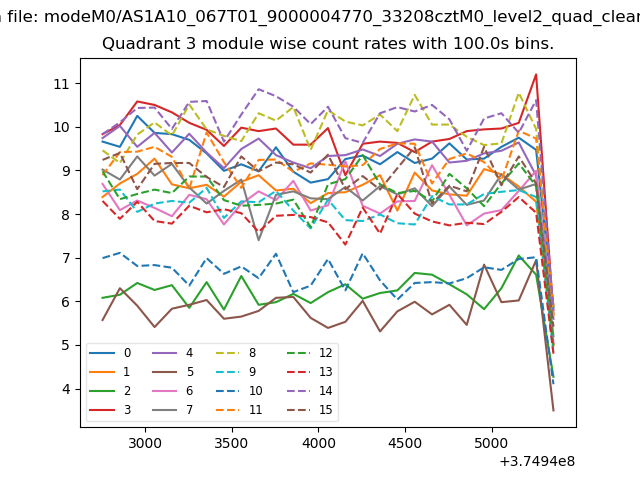
| Module-wise count rates for Quadrant A Data is divided into 100 sec bins |
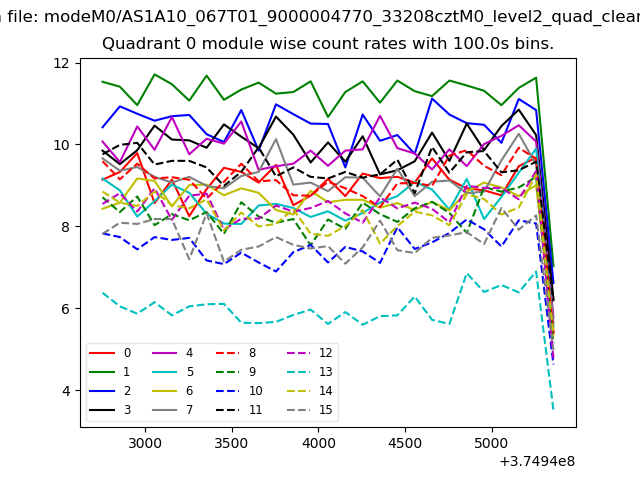 |
 |
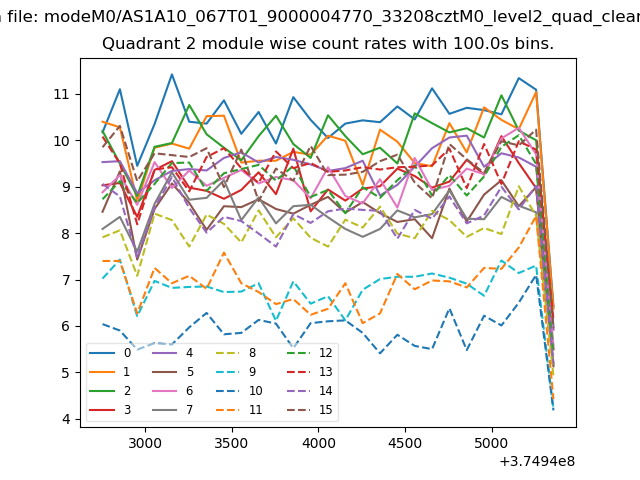
| Module-wise count rates for Quadrant B Data is divided into 100 sec bins |
 |
 |
| Module-wise count rates for Quadrant C Data is divided into 100 sec bins |
 |
 |
| Module-wise count rates for Quadrant D Data is divided into 100 sec bins |
 |
 |
| Parameter | Plot |
|---|---|
| CZT HV Monitor |  |
| D_VDD | 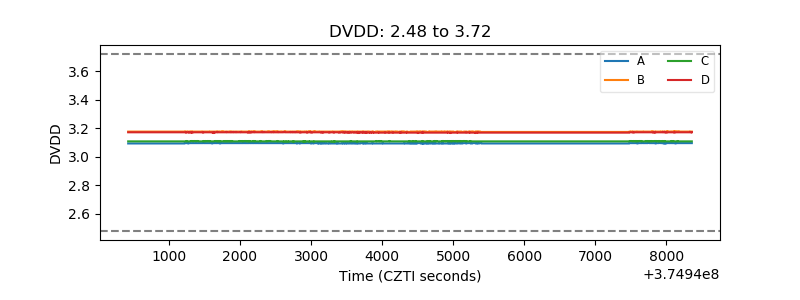 |
| Temperature 1 | 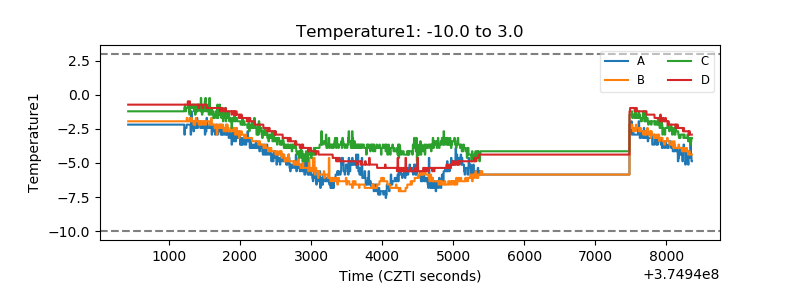 |
| Veto HV Monitor | 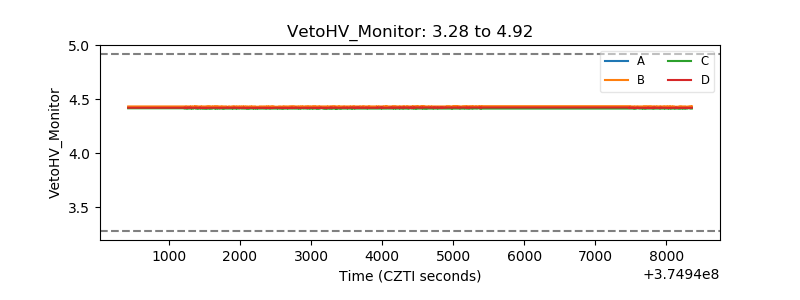 |
| Veto LLD | 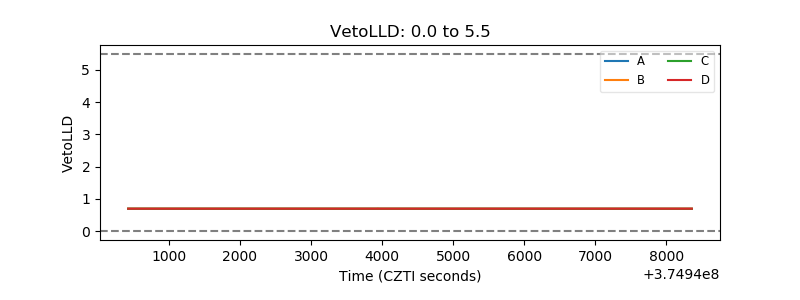 |
| Alpha Counter | 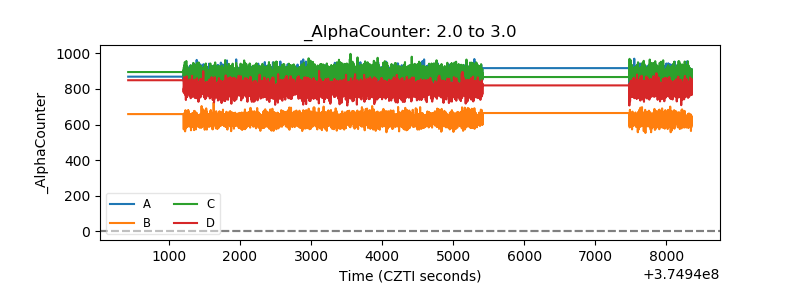 |
| _CPM_Rate | 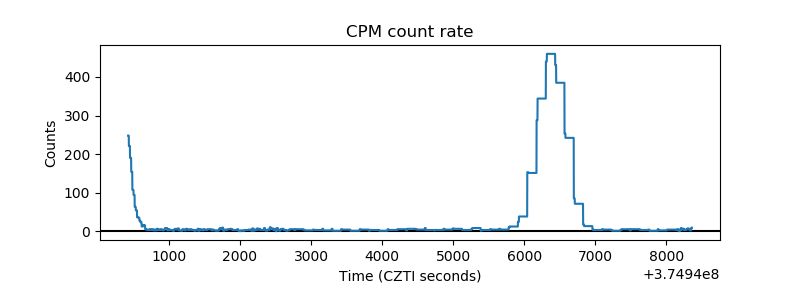 |
| CZT Counter | 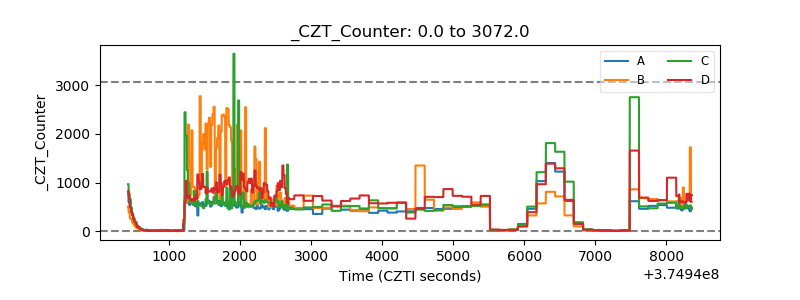 |
| +2.5 Volts monitor |  |
| +5 Volts monitor |  |
| _ROLL_ROT | 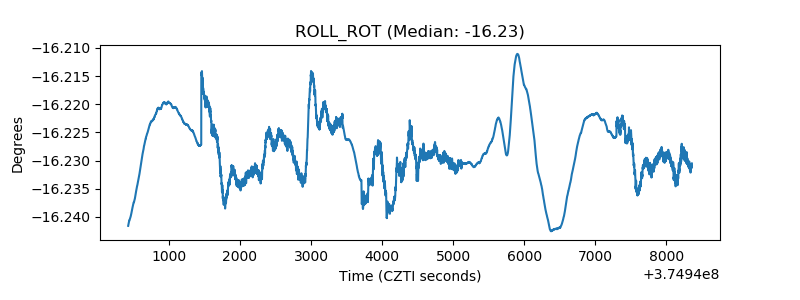 |
| _Roll_DEC | 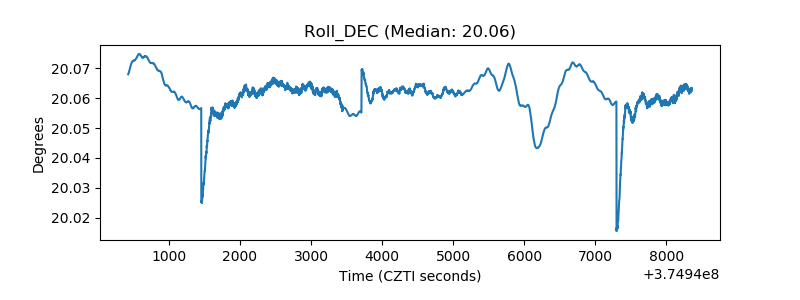 |
| _Roll_RA | 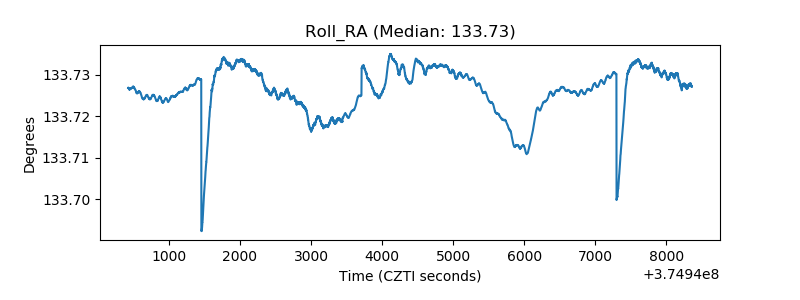 |
| Veto Counter | 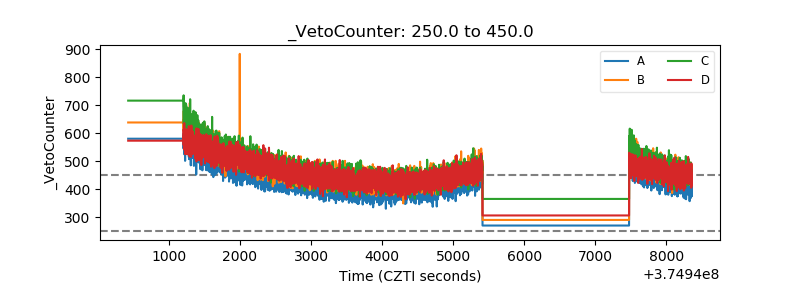 |