| Param | Original file | Final file |
|---|---|---|
| Filename | modeM0/AS1A10_067T01_9000004770_33209cztM0_level2.evt | modeM0/AS1A10_067T01_9000004770_33209cztM0_level2_quad_clean.evt |
| Size (bytes) | 450,155,520 | 72,031,680 |
| Size | 429.3 MB | 68.7 MB |
| Events in quadrant A | 2,484,388 | 465,351 |
| Events in quadrant B | 3,172,710 | 457,577 |
| Events in quadrant C | 2,764,922 | 458,253 |
| Events in quadrant D | 4,854,205 | 431,494 |
| Mode M9 | |||
|---|---|---|---|
| Quadrant | BADHDUFLAG | Total packets | Discarded packets |
| A | 0 | 30 | 0 |
| B | 0 | 30 | 0 |
| C | 0 | 30 | 0 |
| D | 0 | 31 | 0 |
| Mode M0 | |||
|---|---|---|---|
| Quadrant | BADHDUFLAG | Total packets | Discarded packets |
| A | 0 | 10650 | 3 |
| B | 0 | 12748 | 2 |
| C | 0 | 11514 | 2 |
| D | 0 | 18182 | 2 |
| Mode SS | |||
|---|---|---|---|
| Quadrant | BADHDUFLAG | Total packets | Discarded packets |
| A | 0 | 106 | 0 |
| B | 0 | 106 | 0 |
| C | 0 | 106 | 0 |
| D | 0 | 106 | 0 |
| Quadrant | Total seconds | Saturated seconds | Saturation percentage |
|---|---|---|---|
| A | 5263 | 7 | 0.133004% |
| B | 5263 | 137 | 2.603078% |
| C | 5263 | 93 | 1.767053% |
| D | 5263 | 235 | 4.465134% |
Noise dominated data is calculated using 1-second bins in cleaned event files. If a bin has >2000 counts, and if more than 50% of those come from <1% of pixels, then it is considered to be noise-dominated and hence unusable.
| Quadrant | # 1 sec bins | Bins with >0 counts | Bins with >2000 counts | High rate bins dominated by noise | Noise dominated (total time) | Noise dominated (detector-on time) | Marked lightcurve |
|---|---|---|---|---|---|---|---|
| A | 7116 | 5264 | 0 | 0 | 0.00% | 0.00% | 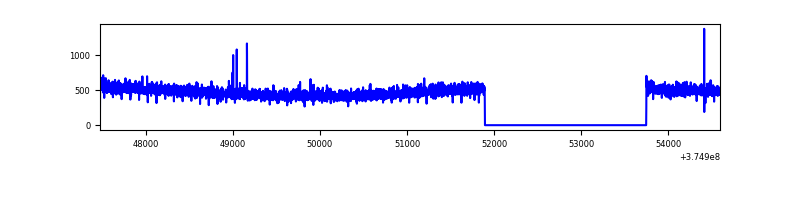 |
| B | 7116 | 5264 | 83 | 83 | 1.17% | 1.58% | 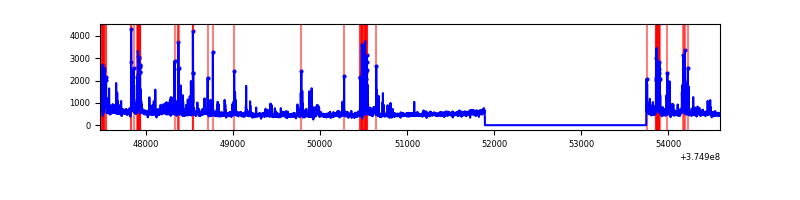 |
| C | 7116 | 5264 | 68 | 68 | 0.96% | 1.29% | 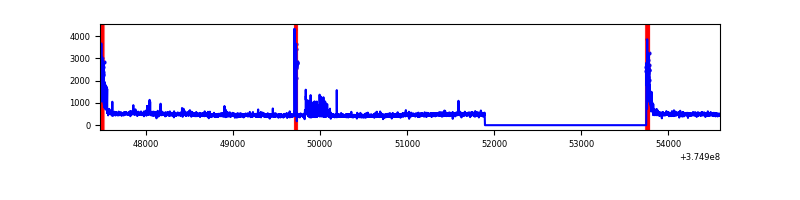 |
| D | 7116 | 5264 | 184 | 184 | 2.59% | 3.50% | 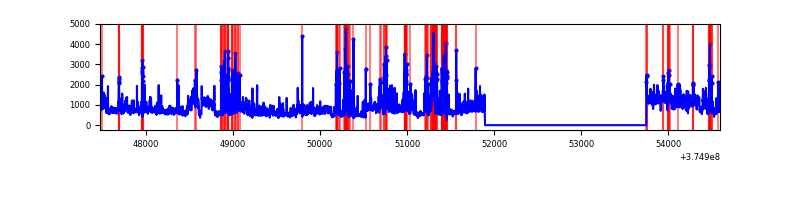 |
Top three noisy pixels from each quadrant. If the there are fewer than three noisy pixels in the level2.evt file, extra rows are filled as -1
| Pixel properties | Quadrant properties | ||||||
|---|---|---|---|---|---|---|---|
| Quadrant | DetID | PixID | Counts | Sigma | Mean | Median | Sigma |
| A | 13 | 254 | 9362 | 67.34 | 639 | 629 | 129.7 |
| A | 13 | 6 | 7372 | 51.99 | 639 | 629 | 129.7 |
| A | 3 | 137 | 5983 | 41.28 | 639 | 629 | 129.7 |
| B | 5 | 172 | 322070 | 2670.56 | 629 | 615 | 120.4 |
| B | 0 | 190 | 100074 | 826.28 | 629 | 615 | 120.4 |
| B | 0 | 219 | 95224 | 785.99 | 629 | 615 | 120.4 |
| C | 0 | 10 | 232115 | 1630.91 | 614 | 621 | 141.9 |
| C | 9 | 187 | 112734 | 789.85 | 614 | 621 | 141.9 |
| C | 14 | 67 | 8414 | 54.9 | 614 | 621 | 141.9 |
| D | 8 | 195 | 1265824 | 7744.01 | 610 | 597 | 163.4 |
| D | 2 | 250 | 354502 | 2166.13 | 610 | 597 | 163.4 |
| D | 13 | 249 | 277518 | 1694.94 | 610 | 597 | 163.4 |
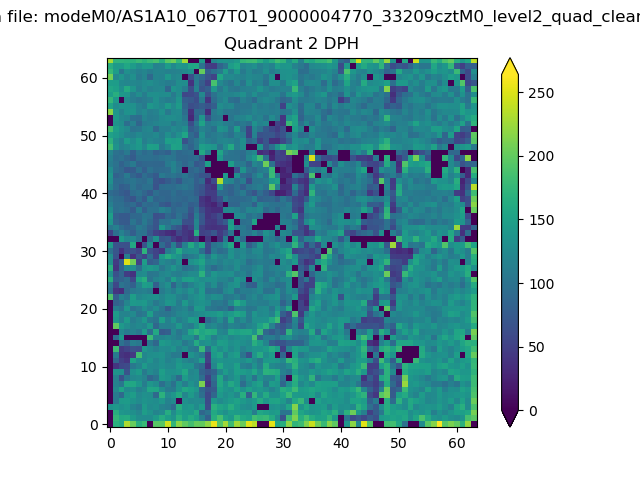
Histogram calculated using DETX and DETY for each event in the final _common_clean file
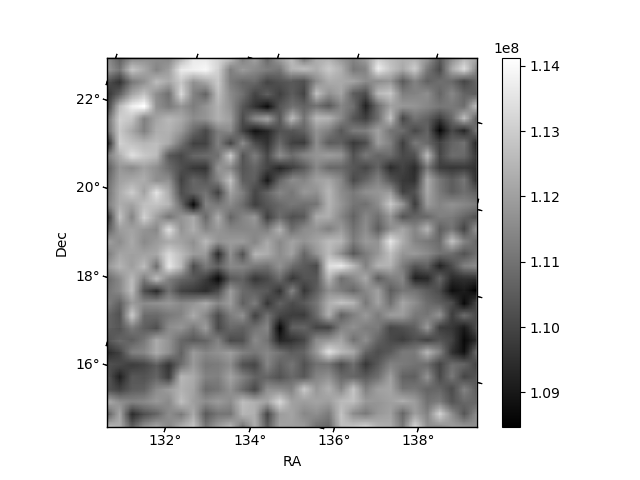
| Quadrant A |  |
 |
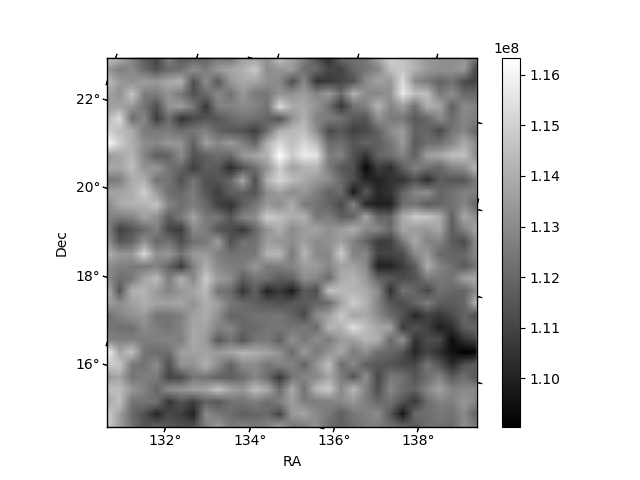
Quadrant B |
|---|---|---|---|
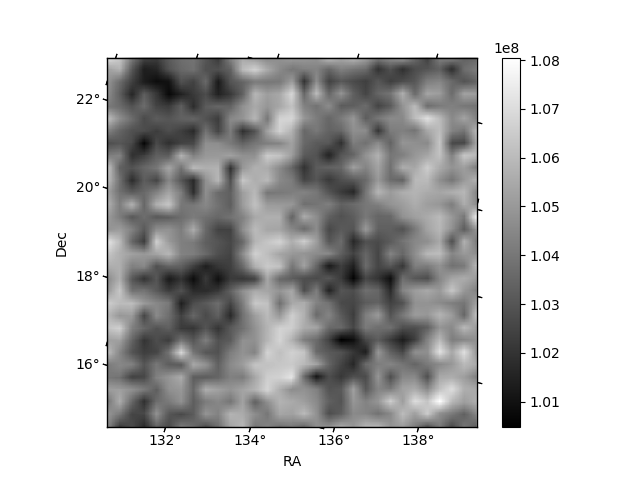
| Quadrant D |  |
 |
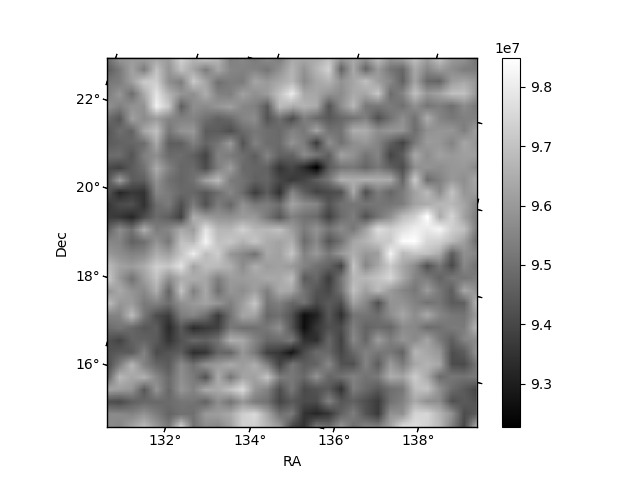
Quadrant C |
| Plot type | Count rate plots | Images |
|---|---|---|
| Comparison with Poisson distribution Blue bars denote a histogram of data divided into 1 sec bins. Red curve is a Poisson curve with rate = median count rate of data. |
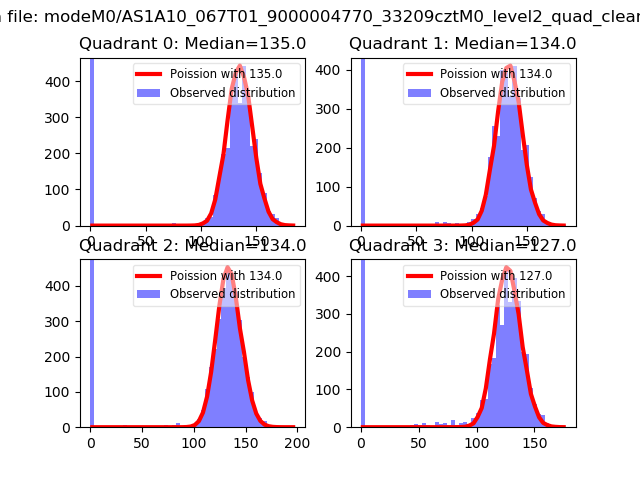 |
 |
| Quadrant-wise count rates Data is divided into 100 sec bins |
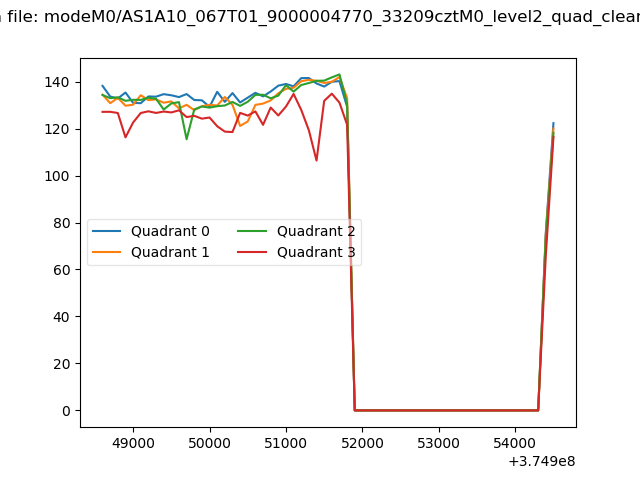 |
|
| Module-wise count rates for Quadrant A Data is divided into 100 sec bins |
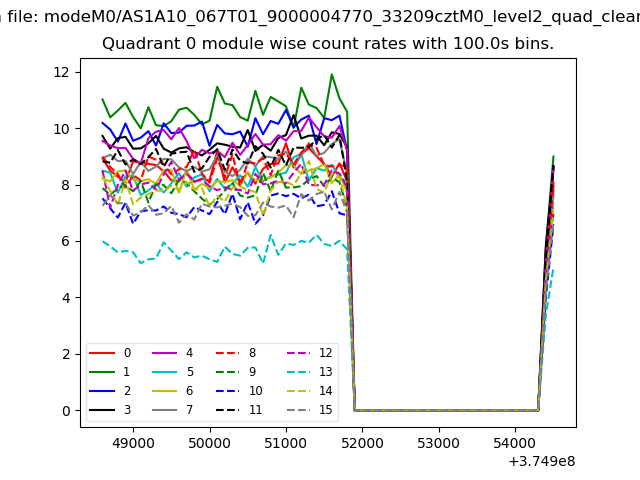 |
 |
| Module-wise count rates for Quadrant B Data is divided into 100 sec bins |
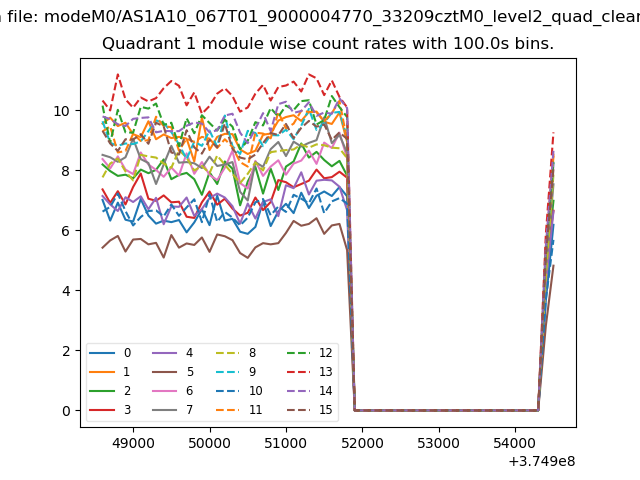 |
 |
| Module-wise count rates for Quadrant C Data is divided into 100 sec bins |
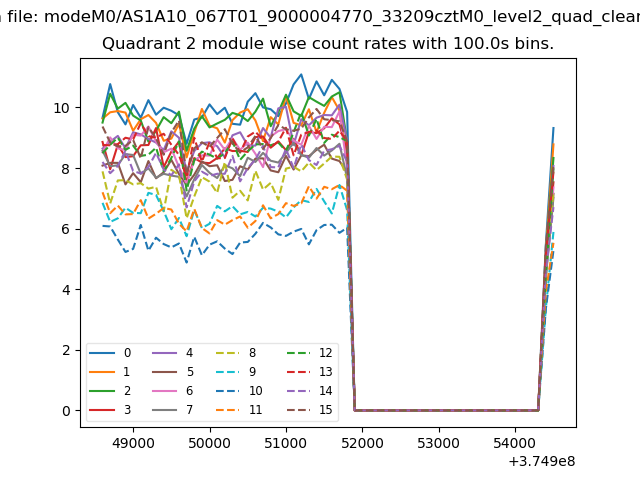 |
 |
| Module-wise count rates for Quadrant D Data is divided into 100 sec bins |
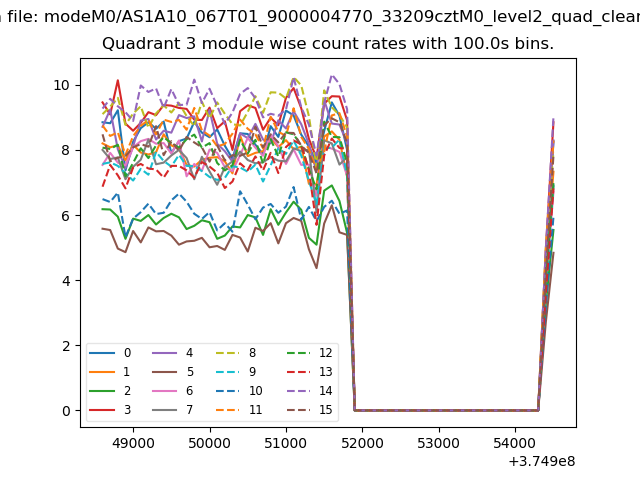 |
 |
| Parameter | Plot |
|---|---|
| CZT HV Monitor | 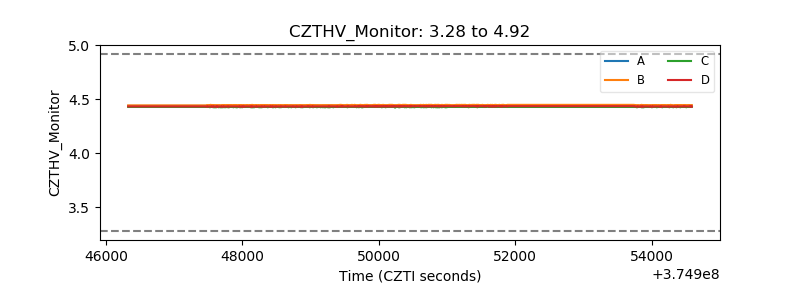 |
| D_VDD | 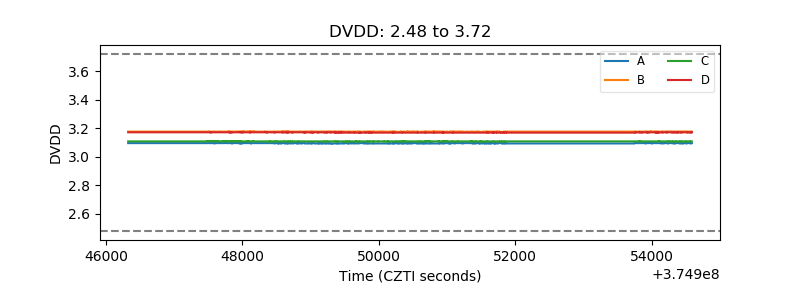 |
| Temperature 1 | 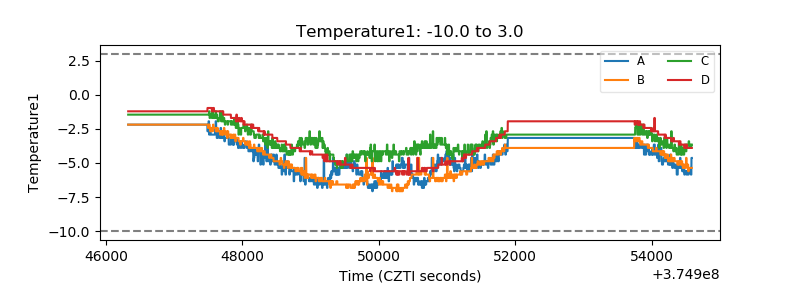 |
| Veto HV Monitor | 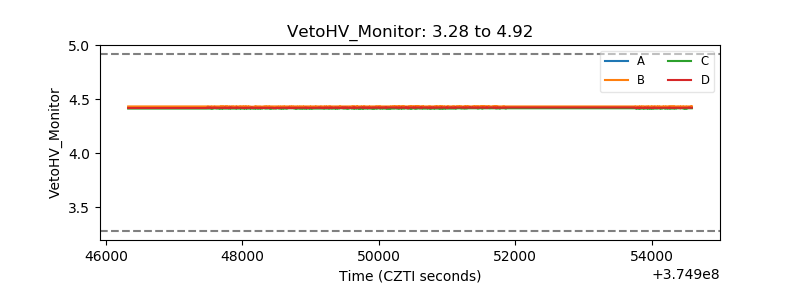 |
| Veto LLD |  |
| Alpha Counter | 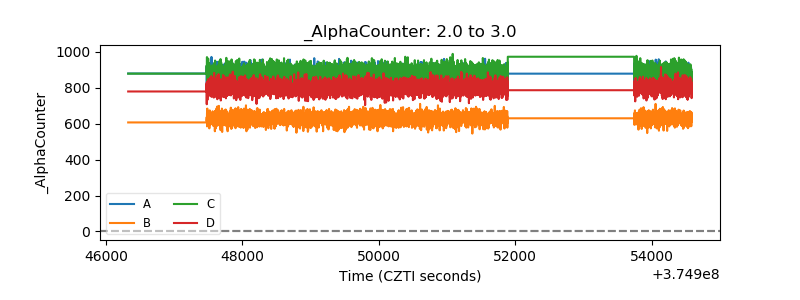 |
| _CPM_Rate | 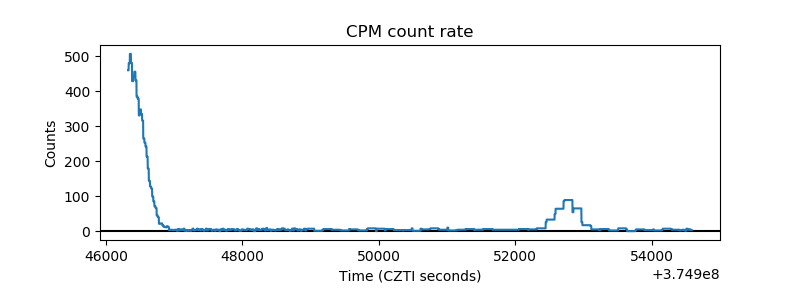 |
| CZT Counter | 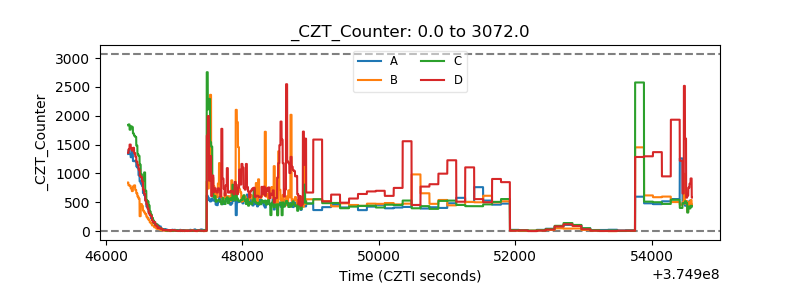 |
| +2.5 Volts monitor |  |
| +5 Volts monitor | 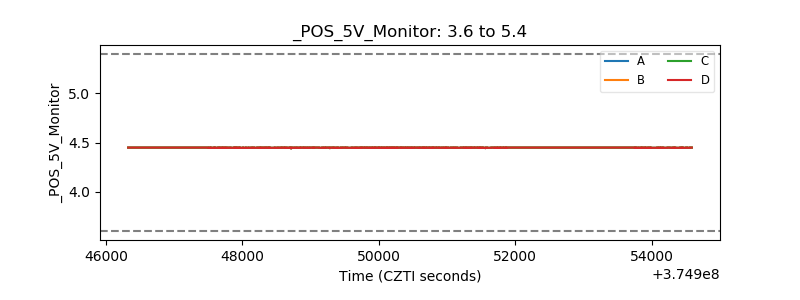 |
| _ROLL_ROT | 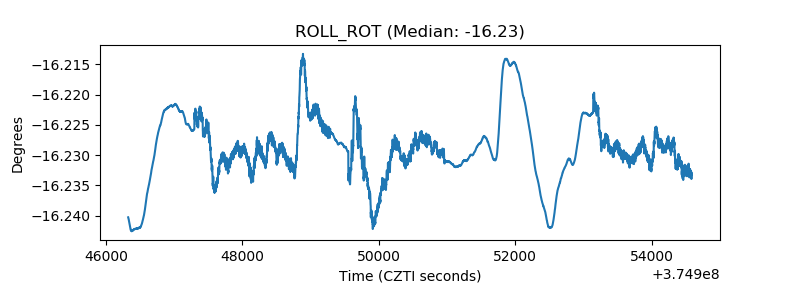 |
| _Roll_DEC | 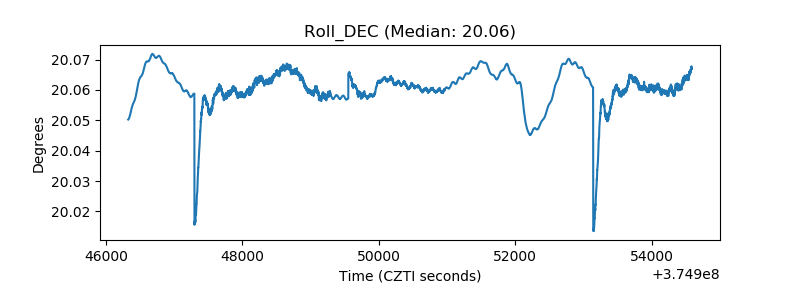 |
| _Roll_RA | 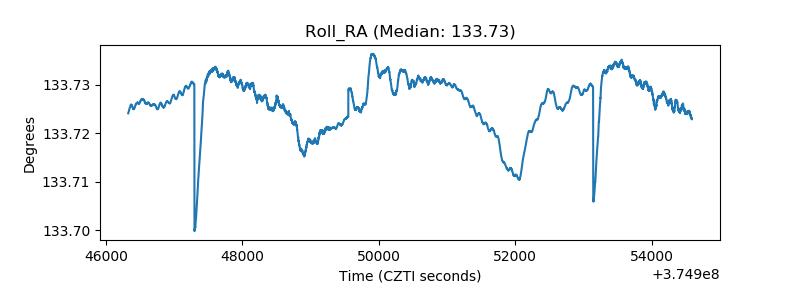 |
| Veto Counter | 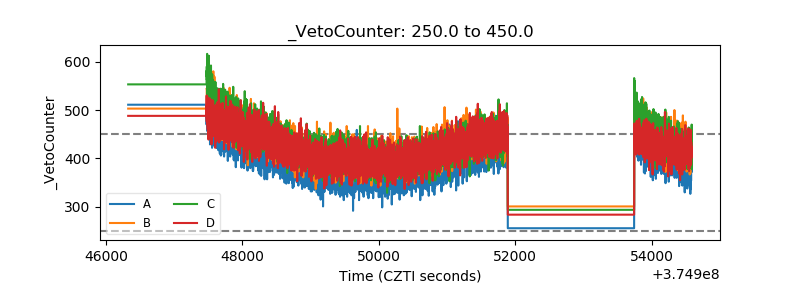 |