| Param | Original file | Final file |
|---|---|---|
| Filename | modeM0/AS1A10_067T01_9000004770_33210cztM0_level2.evt | modeM0/AS1A10_067T01_9000004770_33210cztM0_level2_quad_clean.evt |
| Size (bytes) | 502,980,480 | 81,469,440 |
| Size | 479.7 MB | 77.7 MB |
| Events in quadrant A | 2,560,009 | 535,774 |
| Events in quadrant B | 3,447,499 | 524,021 |
| Events in quadrant C | 2,772,321 | 527,442 |
| Events in quadrant D | 6,079,326 | 493,705 |
| Mode M9 | |||
|---|---|---|---|
| Quadrant | BADHDUFLAG | Total packets | Discarded packets |
| A | 0 | 30 | 0 |
| B | 0 | 30 | 0 |
| C | 0 | 30 | 0 |
| D | 0 | 31 | 0 |
| Mode M0 | |||
|---|---|---|---|
| Quadrant | BADHDUFLAG | Total packets | Discarded packets |
| A | 0 | 11134 | 3 |
| B | 0 | 13898 | 2 |
| C | 0 | 11861 | 2 |
| D | 0 | 21934 | 2 |
| Mode SS | |||
|---|---|---|---|
| Quadrant | BADHDUFLAG | Total packets | Discarded packets |
| A | 0 | 112 | 0 |
| B | 0 | 112 | 0 |
| C | 0 | 112 | 0 |
| D | 0 | 112 | 0 |
| Quadrant | Total seconds | Saturated seconds | Saturation percentage |
|---|---|---|---|
| A | 5517 | 7 | 0.126881% |
| B | 5517 | 226 | 4.096429% |
| C | 5517 | 75 | 1.359434% |
| D | 5517 | 285 | 5.165851% |
Noise dominated data is calculated using 1-second bins in cleaned event files. If a bin has >2000 counts, and if more than 50% of those come from <1% of pixels, then it is considered to be noise-dominated and hence unusable.
| Quadrant | # 1 sec bins | Bins with >0 counts | Bins with >2000 counts | High rate bins dominated by noise | Noise dominated (total time) | Noise dominated (detector-on time) | Marked lightcurve |
|---|---|---|---|---|---|---|---|
| A | 7010 | 5518 | 0 | 0 | 0.00% | 0.00% | 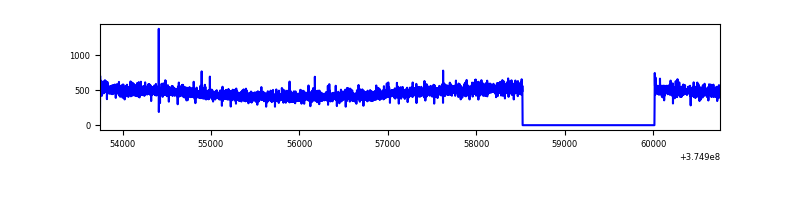 |
| B | 7010 | 5518 | 137 | 137 | 1.95% | 2.48% | 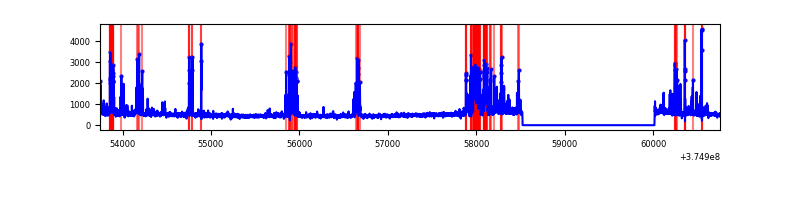 |
| C | 7010 | 5518 | 59 | 59 | 0.84% | 1.07% | 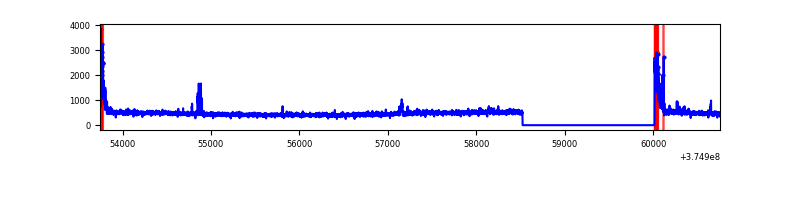 |
| D | 7010 | 5518 | 234 | 234 | 3.34% | 4.24% | 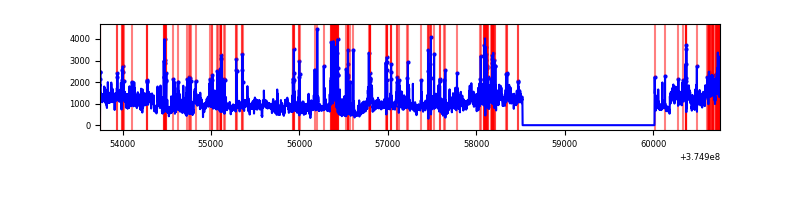 |
Top three noisy pixels from each quadrant. If the there are fewer than three noisy pixels in the level2.evt file, extra rows are filled as -1
| Pixel properties | Quadrant properties | ||||||
|---|---|---|---|---|---|---|---|
| Quadrant | DetID | PixID | Counts | Sigma | Mean | Median | Sigma |
| A | 13 | 6 | 10037 | 70.83 | 658 | 646 | 132.6 |
| A | 13 | 254 | 8876 | 62.07 | 658 | 646 | 132.6 |
| A | 3 | 137 | 6191 | 41.82 | 658 | 646 | 132.6 |
| B | 5 | 172 | 557934 | 4523.03 | 643 | 627 | 123.2 |
| B | 0 | 190 | 90338 | 728.08 | 643 | 627 | 123.2 |
| B | 0 | 219 | 68625 | 551.86 | 643 | 627 | 123.2 |
| C | 0 | 10 | 216207 | 1468.0 | 631 | 637 | 146.8 |
| C | 14 | 67 | 26882 | 178.72 | 631 | 637 | 146.8 |
| C | 9 | 187 | 21437 | 141.64 | 631 | 637 | 146.8 |
| D | 8 | 195 | 2362353 | 13779.57 | 625 | 613 | 171.4 |
| D | 2 | 250 | 420505 | 2449.86 | 625 | 613 | 171.4 |
| D | 12 | 218 | 394208 | 2296.43 | 625 | 613 | 171.4 |
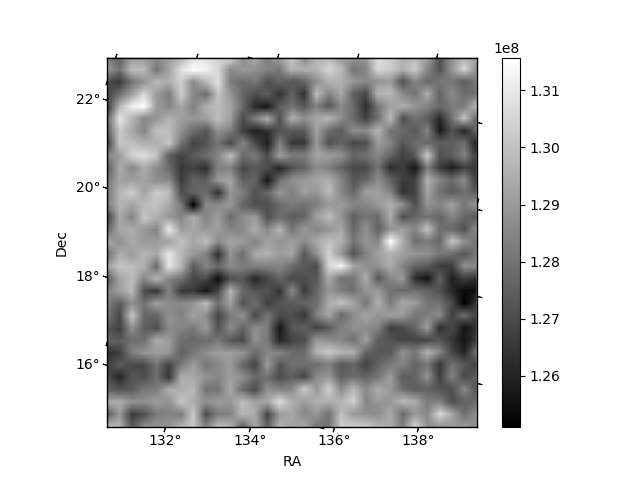
Histogram calculated using DETX and DETY for each event in the final _common_clean file
| Quadrant A | 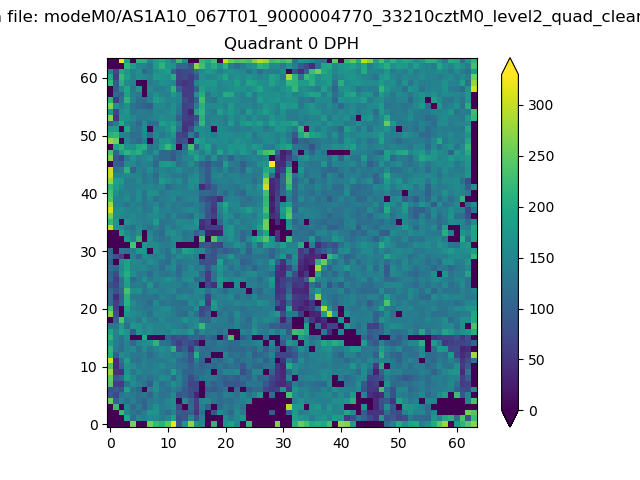 |
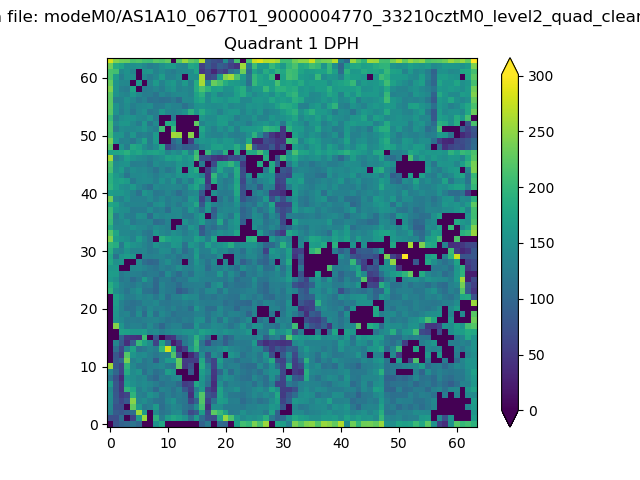 |
Quadrant B |
|---|---|---|---|
| Quadrant D |  |
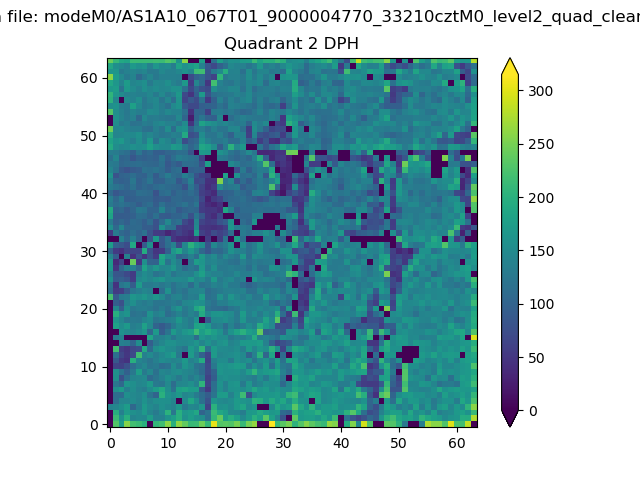 |
Quadrant C |
| Plot type | Count rate plots | Images |
|---|---|---|
| Comparison with Poisson distribution Blue bars denote a histogram of data divided into 1 sec bins. Red curve is a Poisson curve with rate = median count rate of data. |
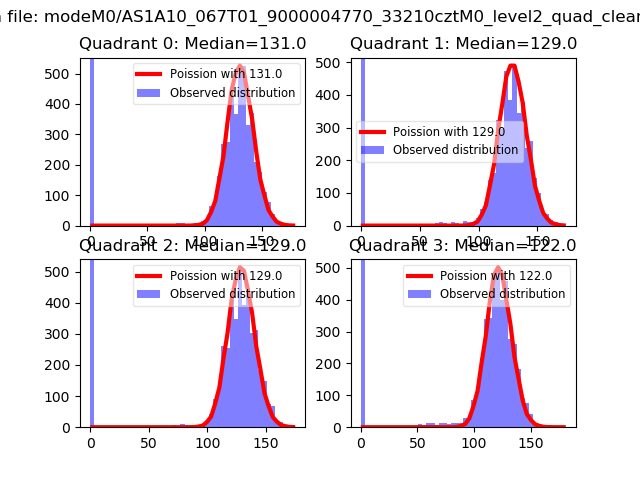 |
 |
| Quadrant-wise count rates Data is divided into 100 sec bins |
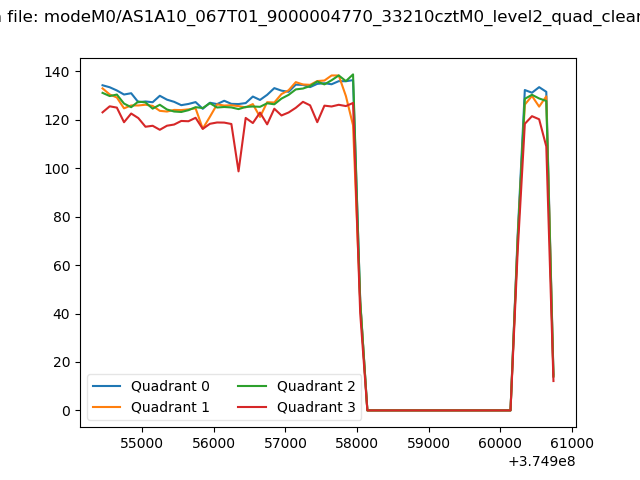 |
|
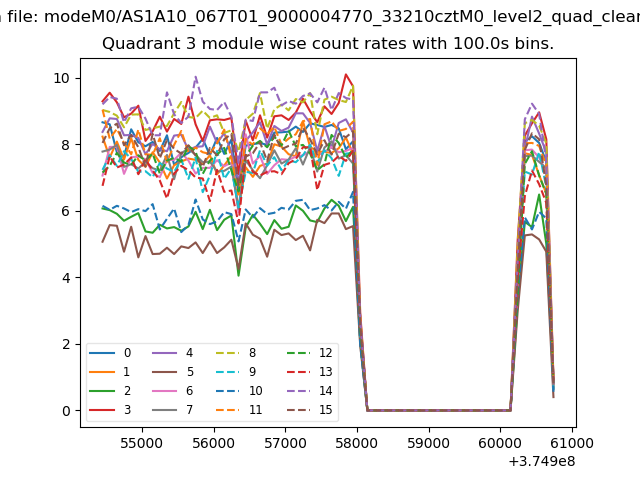
| Module-wise count rates for Quadrant A Data is divided into 100 sec bins |
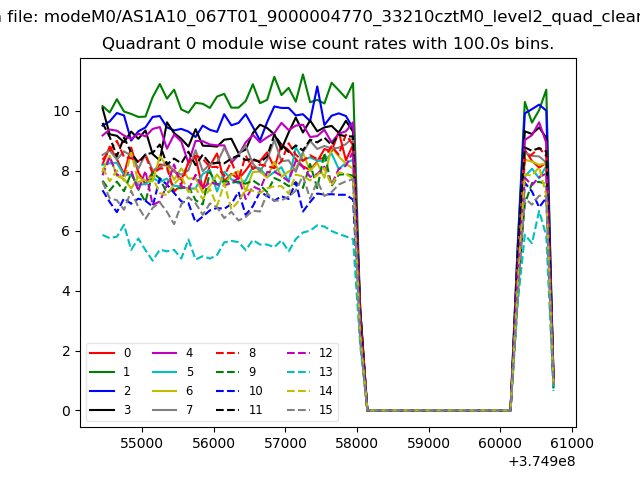 |
 |
| Module-wise count rates for Quadrant B Data is divided into 100 sec bins |
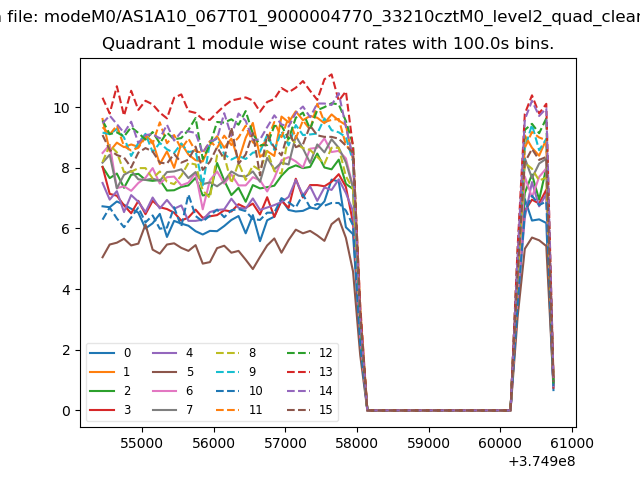 |
 |
| Module-wise count rates for Quadrant C Data is divided into 100 sec bins |
 |
 |
| Module-wise count rates for Quadrant D Data is divided into 100 sec bins |
 |
 |
| Parameter | Plot |
|---|---|
| CZT HV Monitor |  |
| D_VDD | 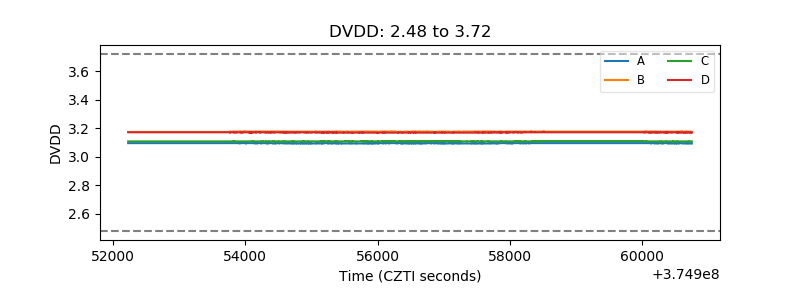 |
| Temperature 1 | 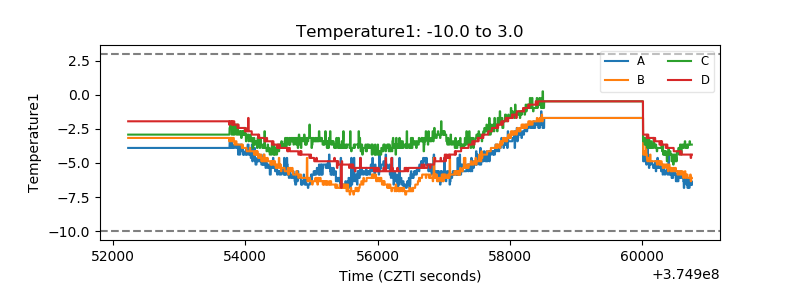 |
| Veto HV Monitor | 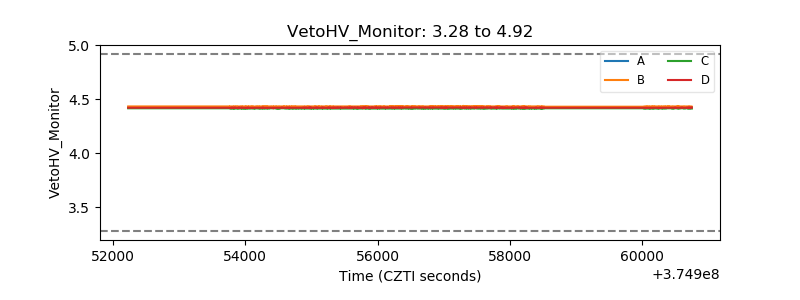 |
| Veto LLD | 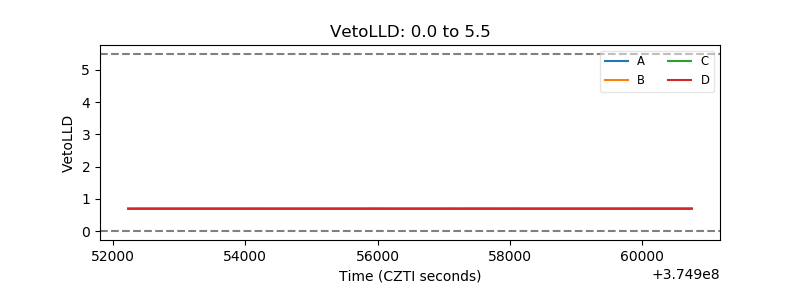 |
| Alpha Counter | 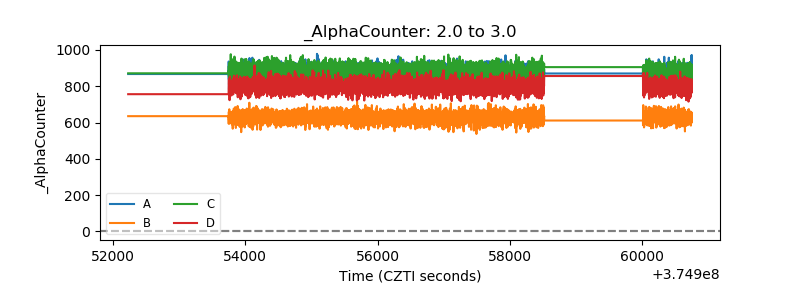 |
| _CPM_Rate | 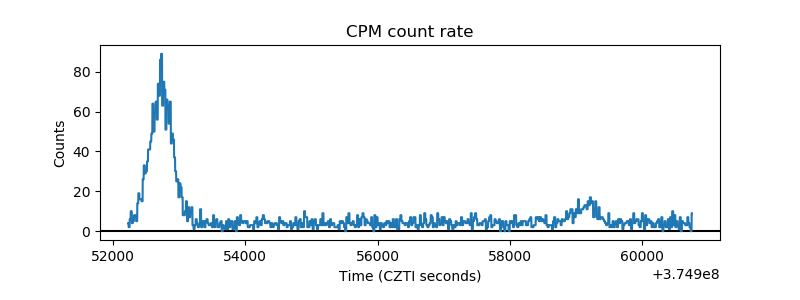 |
| CZT Counter | 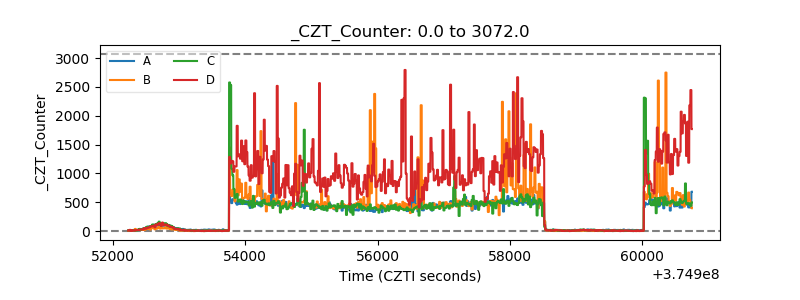 |
| +2.5 Volts monitor | 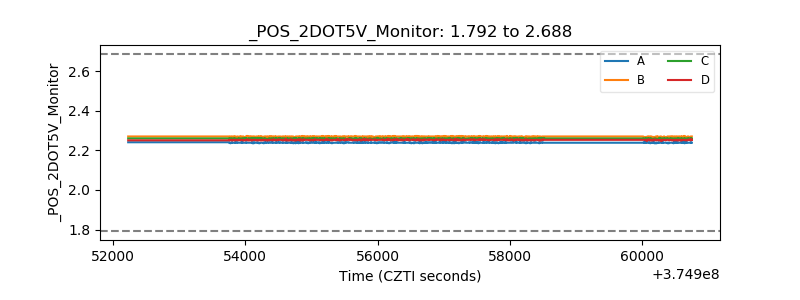 |
| +5 Volts monitor | 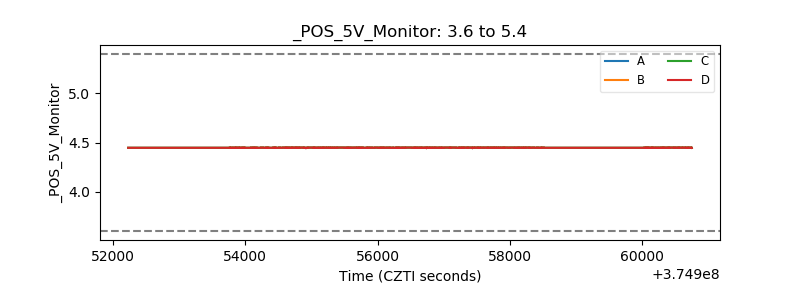 |
| _ROLL_ROT | 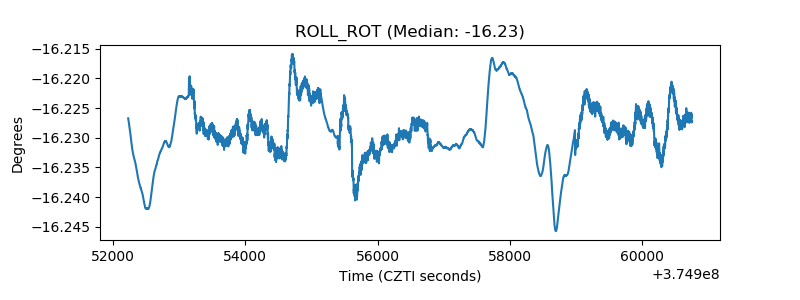 |
| _Roll_DEC | 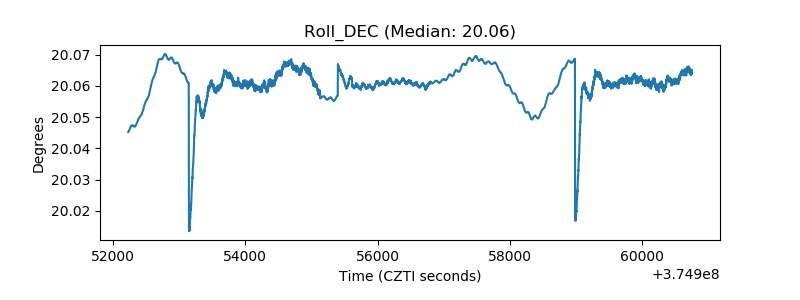 |
| _Roll_RA | 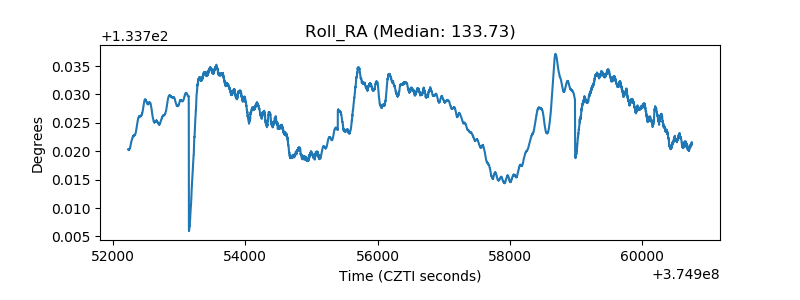 |
| Veto Counter | 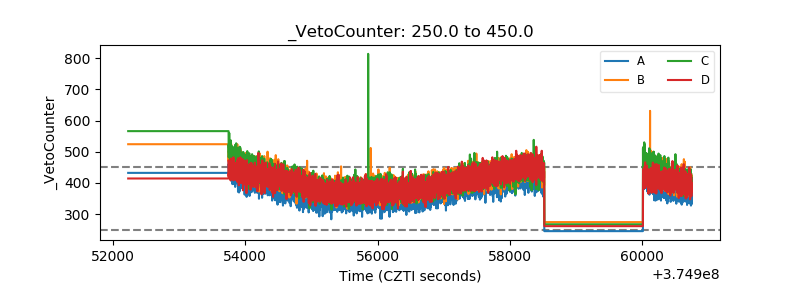 |