| Param | Original file | Final file |
|---|---|---|
| Filename | modeM0/AS1A10_067T01_9000004770_33212cztM0_level2.evt | modeM0/AS1A10_067T01_9000004770_33212cztM0_level2_quad_clean.evt |
| Size (bytes) | 186,292,800 | 40,651,200 |
| Size | 177.7 MB | 38.8 MB |
| Events in quadrant A | 939,577 | 277,412 |
| Events in quadrant B | 1,320,101 | 268,347 |
| Events in quadrant C | 990,202 | 270,522 |
| Events in quadrant D | 2,239,440 | 254,456 |
| Mode M9 | |||
|---|---|---|---|
| Quadrant | BADHDUFLAG | Total packets | Discarded packets |
| A | 0 | 10 | 0 |
| B | 0 | 10 | 0 |
| C | 0 | 10 | 0 |
| D | 0 | 11 | 0 |
| Mode M0 | |||
|---|---|---|---|
| Quadrant | BADHDUFLAG | Total packets | Discarded packets |
| A | 0 | 4441 | 1 |
| B | 0 | 5415 | 1 |
| C | 0 | 4626 | 1 |
| D | 0 | 8206 | 1 |
| Mode SS | |||
|---|---|---|---|
| Quadrant | BADHDUFLAG | Total packets | Discarded packets |
| A | 0 | 44 | 0 |
| B | 0 | 44 | 0 |
| C | 0 | 44 | 0 |
| D | 0 | 44 | 0 |
| Quadrant | Total seconds | Saturated seconds | Saturation percentage |
|---|---|---|---|
| A | 2215 | 1 | 0.045147% |
| B | 2215 | 85 | 3.837472% |
| C | 2215 | 16 | 0.722348% |
| D | 2215 | 87 | 3.927765% |
Noise dominated data is calculated using 1-second bins in cleaned event files. If a bin has >2000 counts, and if more than 50% of those come from <1% of pixels, then it is considered to be noise-dominated and hence unusable.
| Quadrant | # 1 sec bins | Bins with >0 counts | Bins with >2000 counts | High rate bins dominated by noise | Noise dominated (total time) | Noise dominated (detector-on time) | Marked lightcurve |
|---|---|---|---|---|---|---|---|
| A | 2215 | 2215 | 0 | 0 | 0.00% | 0.00% | 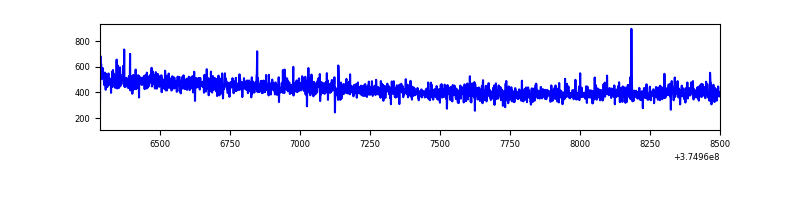 |
| B | 2215 | 2215 | 63 | 63 | 2.84% | 2.84% | 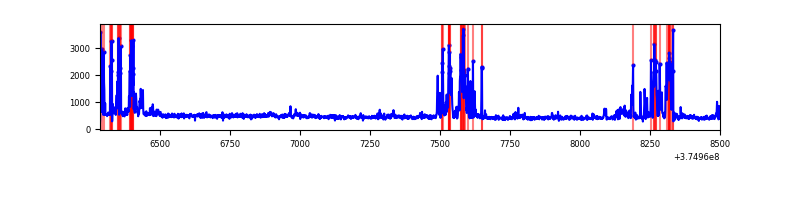 |
| C | 2215 | 2215 | 11 | 11 | 0.50% | 0.50% | 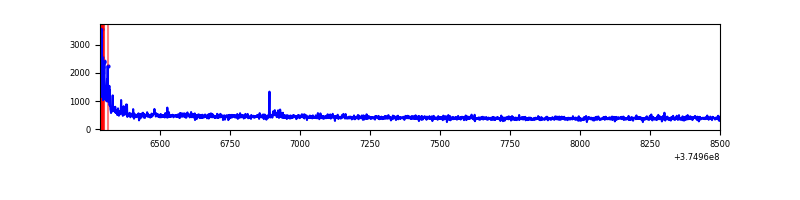 |
| D | 2215 | 2215 | 91 | 91 | 4.11% | 4.11% | 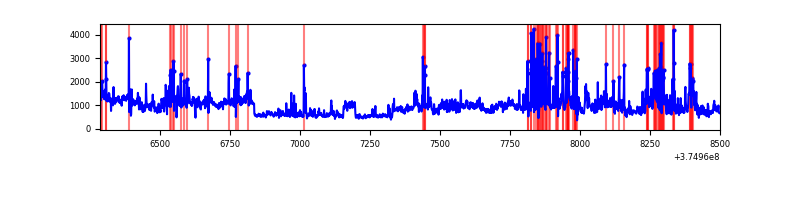 |
Top three noisy pixels from each quadrant. If the there are fewer than three noisy pixels in the level2.evt file, extra rows are filled as -1
| Pixel properties | Quadrant properties | ||||||
|---|---|---|---|---|---|---|---|
| Quadrant | DetID | PixID | Counts | Sigma | Mean | Median | Sigma |
| A | 13 | 254 | 3842 | 72.47 | 241 | 236 | 49.8 |
| A | 13 | 6 | 3350 | 62.59 | 241 | 236 | 49.8 |
| A | 14 | 254 | 2563 | 46.77 | 241 | 236 | 49.8 |
| B | 5 | 172 | 268074 | 5560.51 | 239 | 234 | 48.2 |
| B | 5 | 200 | 21535 | 442.22 | 239 | 234 | 48.2 |
| B | 0 | 190 | 18936 | 388.26 | 239 | 234 | 48.2 |
| C | 0 | 10 | 58991 | 1033.97 | 235 | 237 | 56.8 |
| C | 7 | 221 | 8634 | 147.77 | 235 | 237 | 56.8 |
| C | 10 | 49 | 2508 | 39.97 | 235 | 237 | 56.8 |
| D | 8 | 195 | 898582 | 14291.25 | 227 | 222 | 62.9 |
| D | 2 | 250 | 255484 | 4060.75 | 227 | 222 | 62.9 |
| D | 13 | 249 | 106204 | 1685.98 | 227 | 222 | 62.9 |
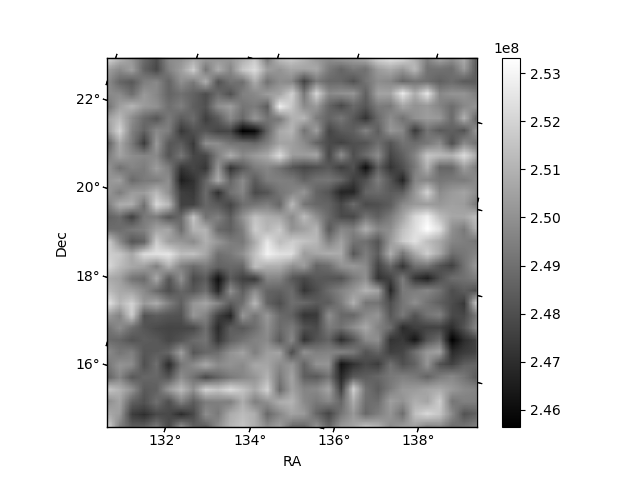
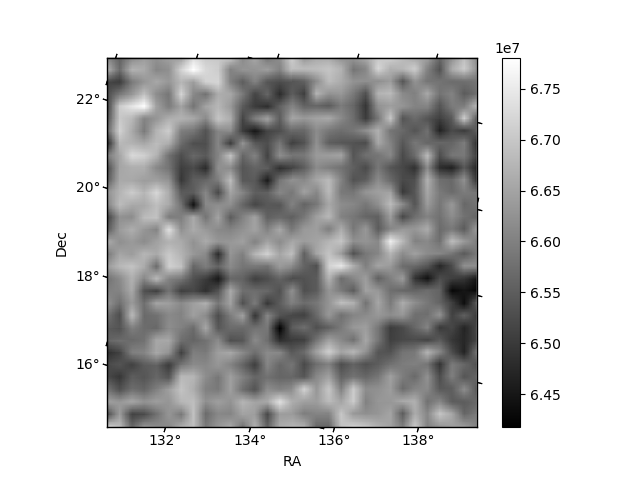
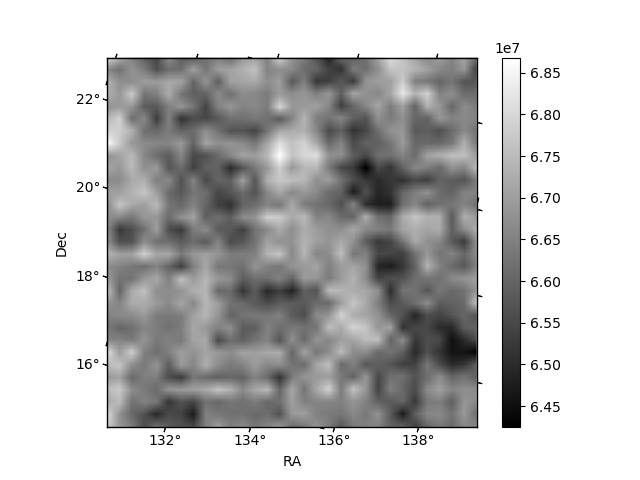
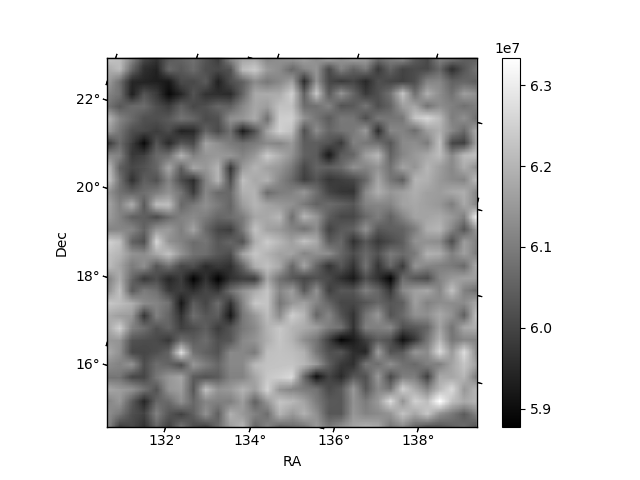
Histogram calculated using DETX and DETY for each event in the final _common_clean file
| Quadrant A | 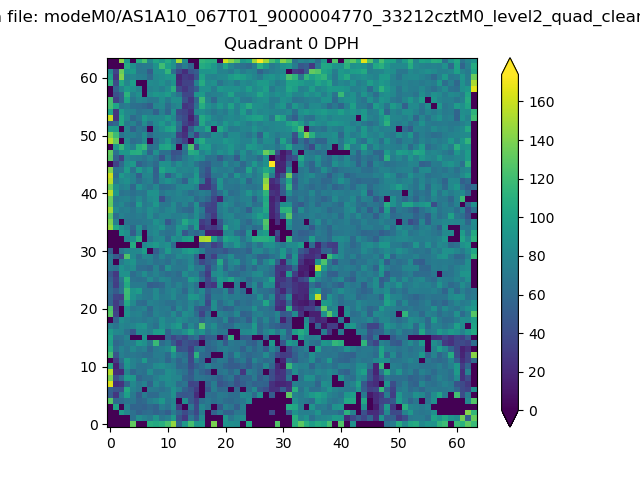 |
 |
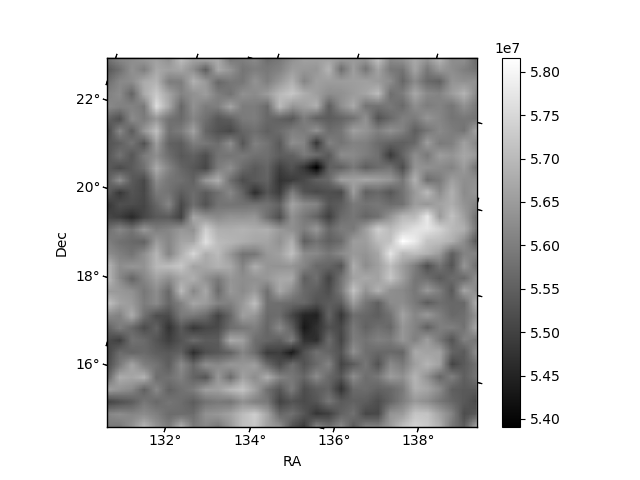
Quadrant B |
|---|---|---|---|
| Quadrant D | 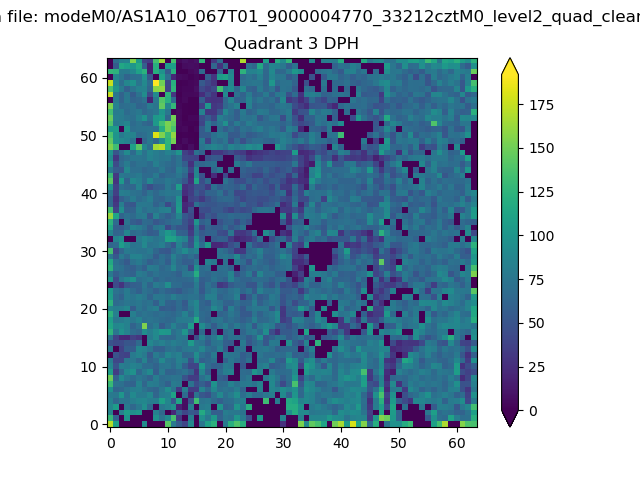 |
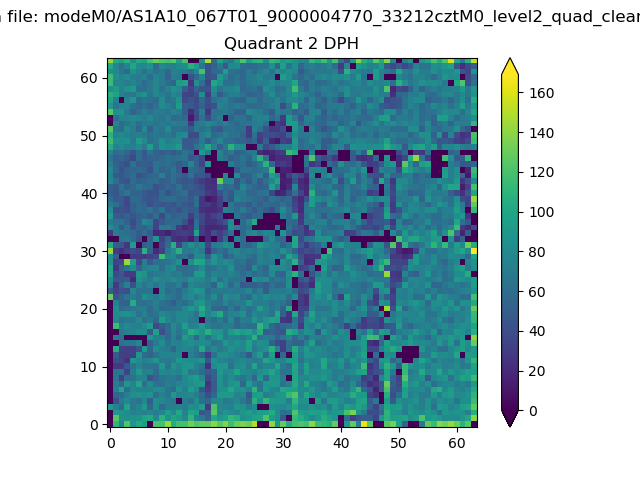 |
Quadrant C |
| Plot type | Count rate plots | Images |
|---|---|---|
| Comparison with Poisson distribution Blue bars denote a histogram of data divided into 1 sec bins. Red curve is a Poisson curve with rate = median count rate of data. |
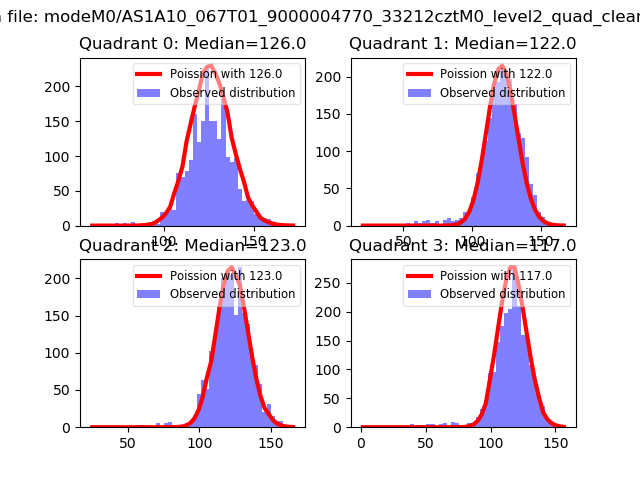 |
 |
| Quadrant-wise count rates Data is divided into 100 sec bins |
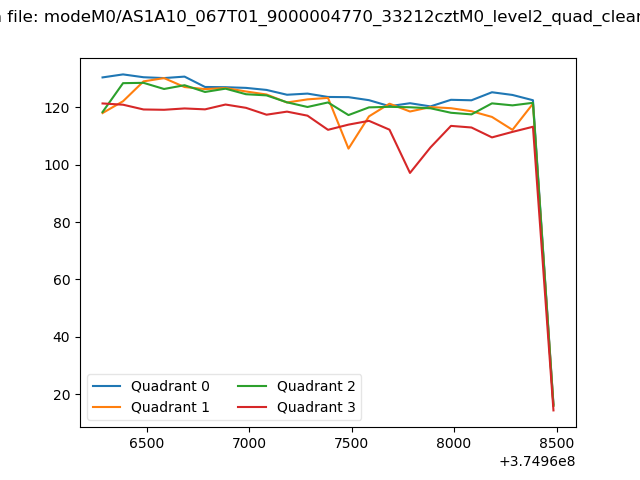 |
|
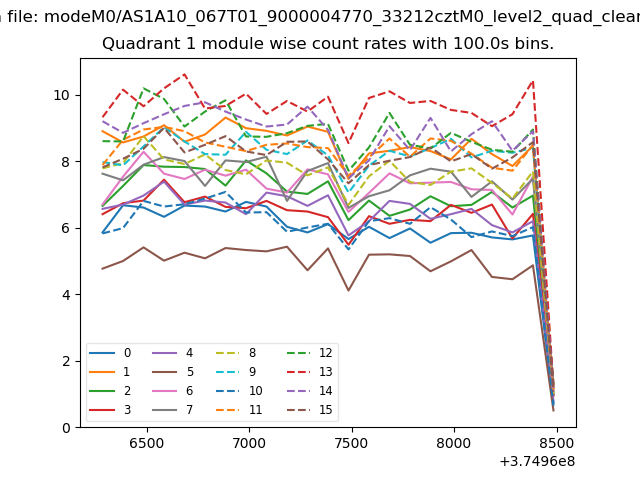
| Module-wise count rates for Quadrant A Data is divided into 100 sec bins |
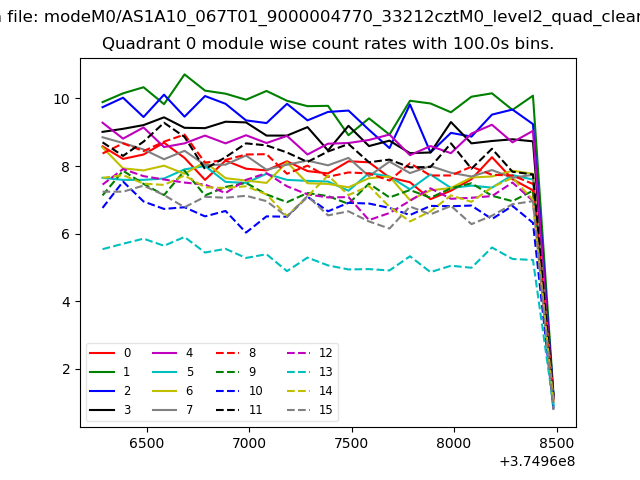 |
 |
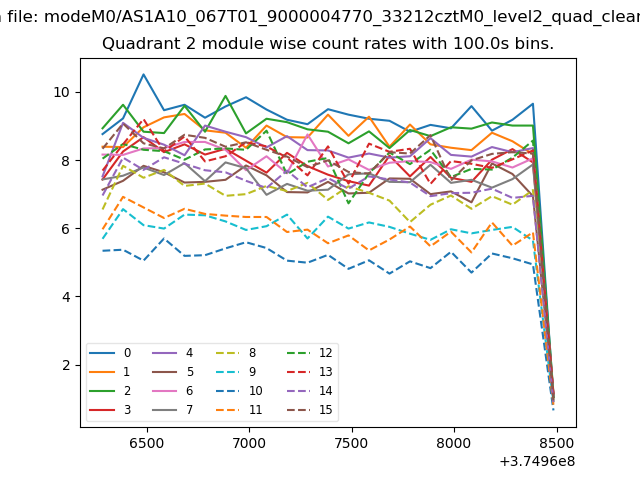
| Module-wise count rates for Quadrant B Data is divided into 100 sec bins |
 |
 |
| Module-wise count rates for Quadrant C Data is divided into 100 sec bins |
 |
 |
| Module-wise count rates for Quadrant D Data is divided into 100 sec bins |
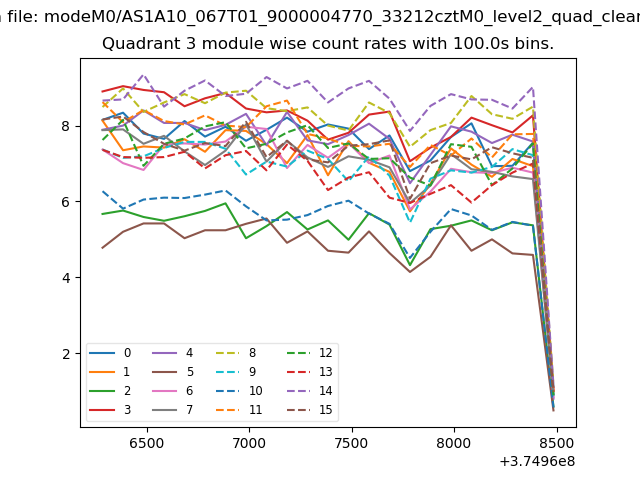 |
 |
| Parameter | Plot |
|---|---|
| CZT HV Monitor | 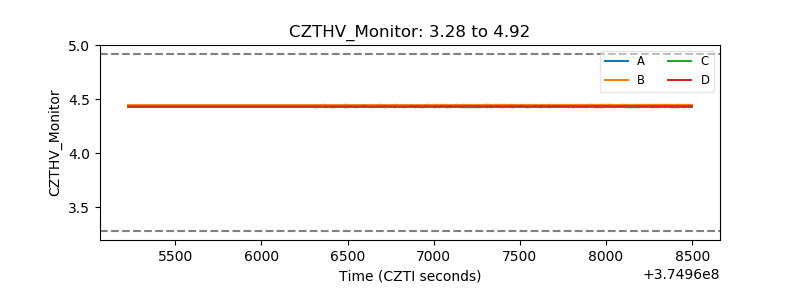 |
| D_VDD | 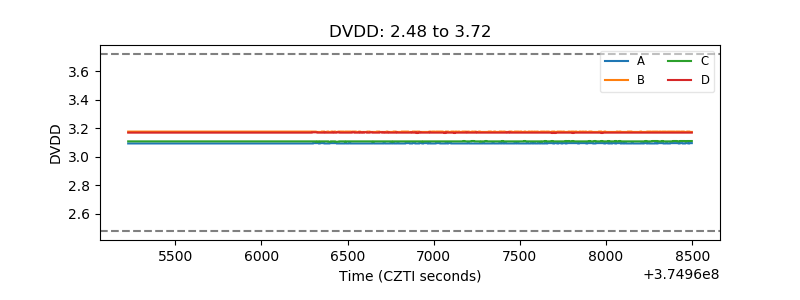 |
| Temperature 1 | 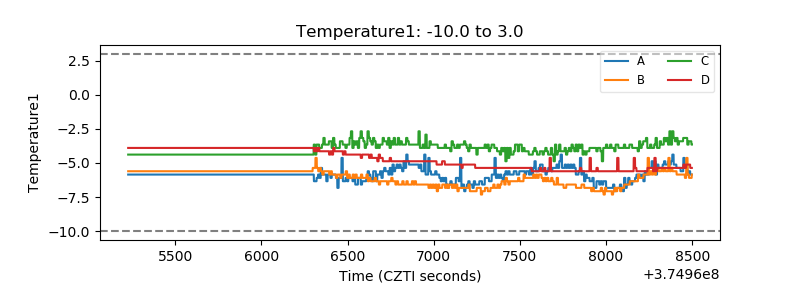 |
| Veto HV Monitor |  |
| Veto LLD | 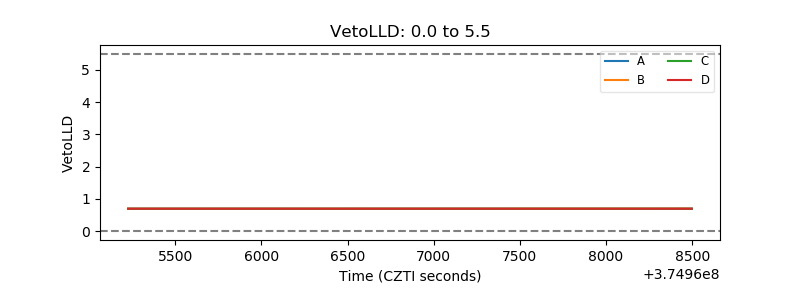 |
| Alpha Counter | 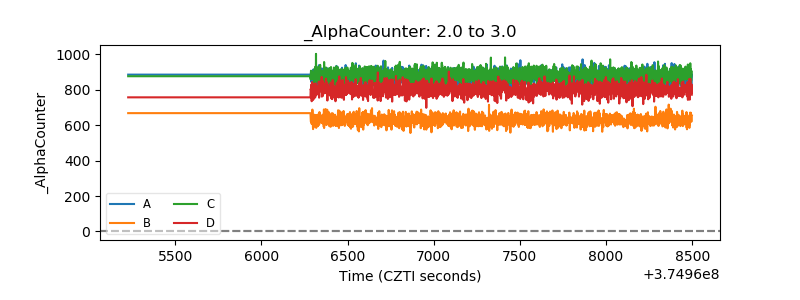 |
| _CPM_Rate | 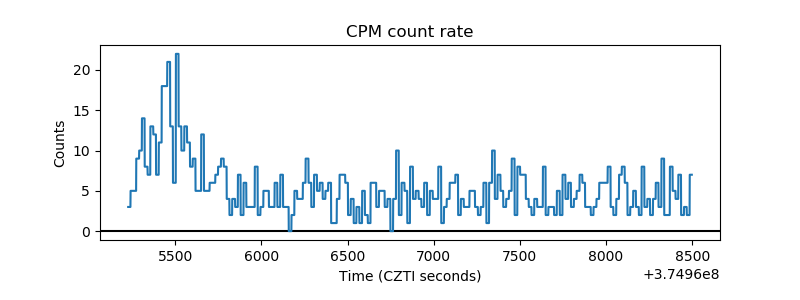 |
| CZT Counter | 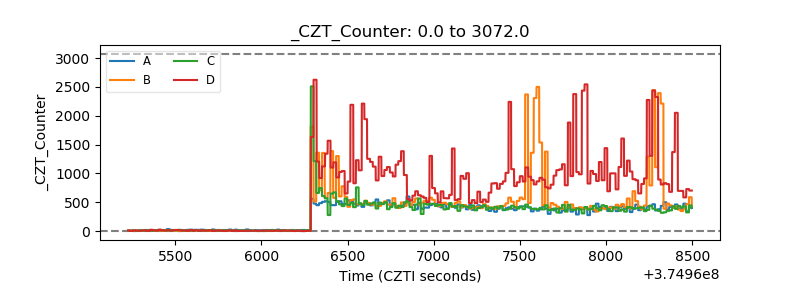 |
| +2.5 Volts monitor |  |
| +5 Volts monitor | 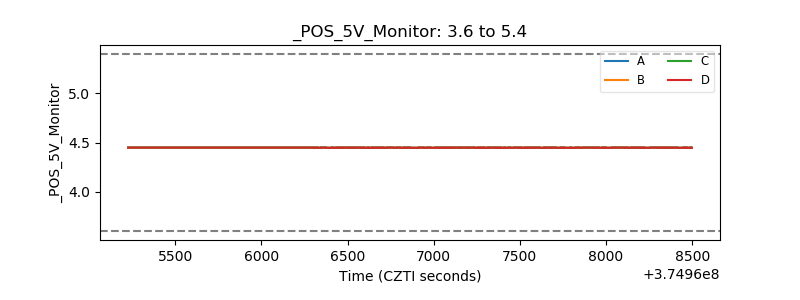 |
| _ROLL_ROT | 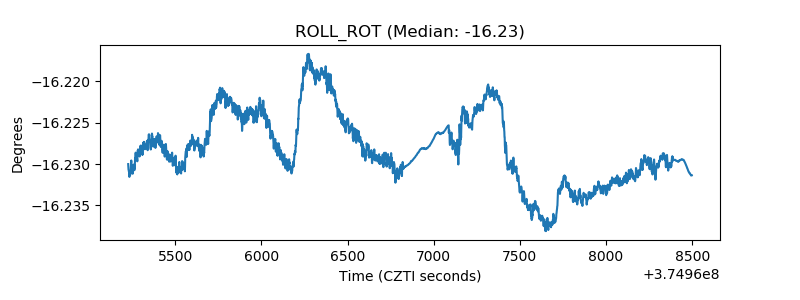 |
| _Roll_DEC | 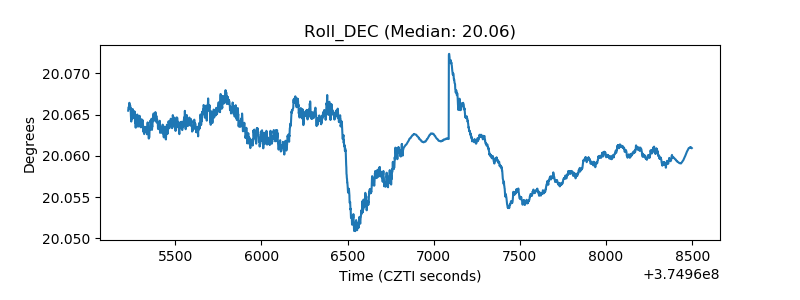 |
| _Roll_RA | 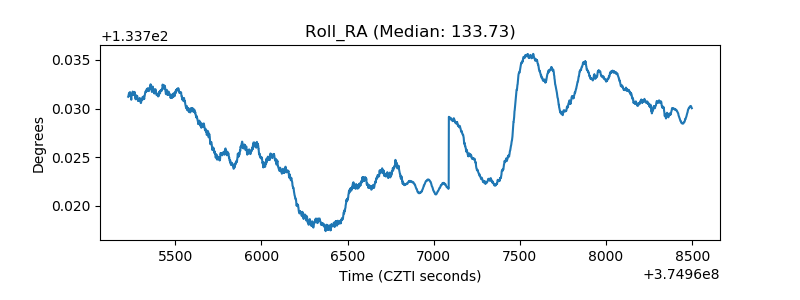 |
| Veto Counter | 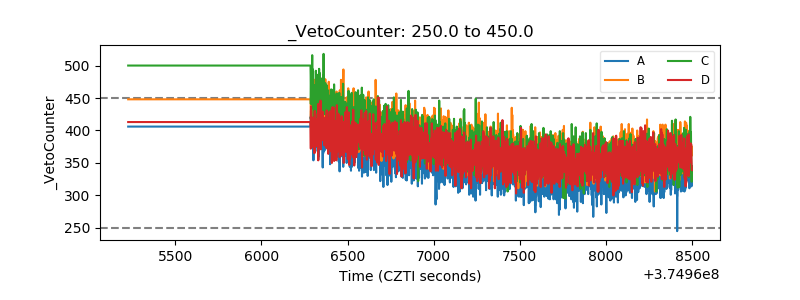 |