| Param | Original file | Final file |
|---|---|---|
| Filename | modeM0/AS1T04_066T01_9000004772cztM0_level2.fits | modeM0/AS1T04_066T01_9000004772cztM0_level2_quad_clean.evt |
| Size (bytes) | 396,095,040 | 297,959,040 |
| Size | 377.7 MB | 284.2 MB |
| Events in quadrant A | 2,552,348 | 1,738,733 |
| Events in quadrant B | 2,329,804 | 1,619,169 |
| Events in quadrant C | 2,415,244 | 1,633,289 |
| Events in quadrant D | 1,971,730 | 1,305,259 |
| Mode M0 | |||
|---|---|---|---|
| Quadrant | BADHDUFLAG | Total packets | Discarded packets |
| A | 0 | 82854 | 0 |
| B | 0 | 114912 | 0 |
| C | 0 | 84967 | 0 |
| D | 0 | 188552 | 0 |
| Mode SS | |||
|---|---|---|---|
| Quadrant | BADHDUFLAG | Total packets | Discarded packets |
| A | 0 | 814 | 0 |
| B | 0 | 814 | 0 |
| C | 0 | 814 | 0 |
| D | 0 | 814 | 0 |
| Mode M9 | |||
|---|---|---|---|
| Quadrant | BADHDUFLAG | Total packets | Discarded packets |
| A | 0 | 153 | 0 |
| B | 0 | 153 | 0 |
| C | 0 | 153 | 0 |
| D | 0 | 153 | 0 |
| Quadrant | Total seconds | Saturated seconds | Saturation percentage |
|---|---|---|---|
| A | 39670 | 58 | 0.146206% |
| B | 39670 | 2004 | 5.051676% |
| C | 39670 | 325 | 0.819259% |
| D | 39670 | 4977 | 12.546005% |
Noise dominated data is calculated using 1-second bins in cleaned event files. If a bin has >2000 counts, and if more than 50% of those come from <1% of pixels, then it is considered to be noise-dominated and hence unusable.
| Quadrant | # 1 sec bins | Bins with >0 counts | Bins with >2000 counts | High rate bins dominated by noise | Noise dominated (total time) | Noise dominated (detector-on time) | Marked lightcurve |
|---|---|---|---|---|---|---|---|
| A | 55084 | 39670 | 0 | 0 | 0.00% | 0.00% |  |
| B | 55084 | 39656 | 0 | 0 | 0.00% | 0.00% |  |
| C | 55084 | 39664 | 0 | 0 | 0.00% | 0.00% |  |
| D | 55084 | 39654 | 0 | 0 | 0.00% | 0.00% |  |
Top three noisy pixels from each quadrant. If the there are fewer than three noisy pixels in the level2.evt file, extra rows are filled as -1
| Pixel properties | Quadrant properties | ||||||
|---|---|---|---|---|---|---|---|
| Quadrant | DetID | PixID | Counts | Sigma | Mean | Median | Sigma |
| A | 0 | 29 | 2097 | 8.99 | 667 | 632 | 162.9 |
| A | 9 | 19 | 2084 | 8.91 | 667 | 632 | 162.9 |
| A | 7 | 110 | 1981 | 8.28 | 667 | 632 | 162.9 |
| B | 2 | 9 | 1943 | 11.21 | 619 | 595 | 120.2 |
| B | 3 | 80 | 1750 | 9.61 | 619 | 595 | 120.2 |
| B | 5 | 128 | 1650 | 8.77 | 619 | 595 | 120.2 |
| C | 1 | 81 | 2013 | 8.78 | 639 | 604 | 160.5 |
| C | 1 | 80 | 1969 | 8.51 | 639 | 604 | 160.5 |
| C | 3 | 187 | 1708 | 6.88 | 639 | 604 | 160.5 |
| D | 10 | 189 | 1504 | 6.72 | 565 | 519 | 146.5 |
| D | 6 | 231 | 1429 | 6.21 | 565 | 519 | 146.5 |
| D | 10 | 113 | 1422 | 6.16 | 565 | 519 | 146.5 |
Histogram calculated using DETX and DETY for each event in the final _common_clean file
| Quadrant A | 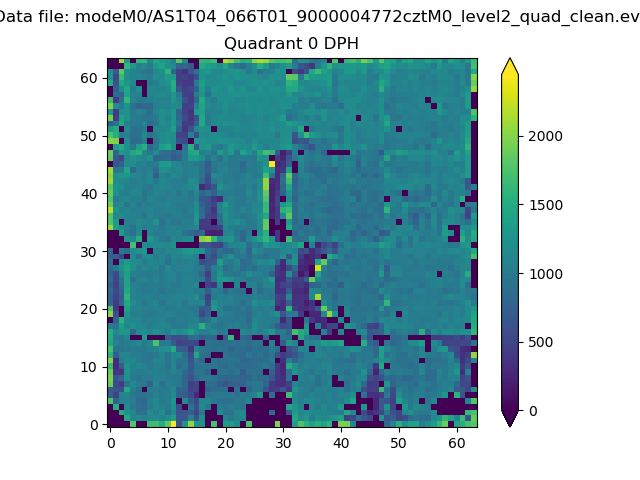 |
 |
Quadrant B |
|---|---|---|---|
| Quadrant D |  |
 |
Quadrant C |
| Plot type | Count rate plots | Images |
|---|---|---|
| Comparison with Poisson distribution Blue bars denote a histogram of data divided into 1 sec bins. Red curve is a Poisson curve with rate = median count rate of data. |
 |
 |
| Quadrant-wise count rates Data is divided into 100 sec bins |
 |
|
| Module-wise count rates for Quadrant A Data is divided into 100 sec bins |
 |
 |
| Module-wise count rates for Quadrant B Data is divided into 100 sec bins |
 |
 |
| Module-wise count rates for Quadrant C Data is divided into 100 sec bins |
 |
 |
| Module-wise count rates for Quadrant D Data is divided into 100 sec bins |
 |
 |
| Parameter | Plot |
|---|---|
| CZT HV Monitor |  |
| D_VDD |  |
| Temperature 1 |  |
| Veto HV Monitor |  |
| Veto LLD |  |
| Alpha Counter |  |
| _CPM_Rate |  |
| CZT Counter |  |
| +2.5 Volts monitor |  |
| +5 Volts monitor |  |
| _ROLL_ROT |  |
| _Roll_DEC |  |
| _Roll_RA |  |
| Veto Counter |  |