| Param | Original file | Final file |
|---|---|---|
| Filename | modeM0/AS1T04_066T01_9000004772_33214cztM0_level2.evt | modeM0/AS1T04_066T01_9000004772_33214cztM0_level2_quad_clean.evt |
| Size (bytes) | 1,111,587,840 | 132,099,840 |
| Size | 1.0 GB | 126.0 MB |
| Events in quadrant A | 5,448,717 | 833,100 |
| Events in quadrant B | 8,910,081 | 799,714 |
| Events in quadrant C | 5,623,413 | 824,066 |
| Events in quadrant D | 12,913,616 | 753,318 |
| Mode M0 | |||
|---|---|---|---|
| Quadrant | BADHDUFLAG | Total packets | Discarded packets |
| A | 0 | 23726 | 4 |
| B | 0 | 34209 | 3 |
| C | 0 | 24143 | 3 |
| D | 0 | 46380 | 3 |
| Mode SS | |||
|---|---|---|---|
| Quadrant | BADHDUFLAG | Total packets | Discarded packets |
| A | 0 | 236 | 0 |
| B | 0 | 236 | 0 |
| C | 0 | 236 | 0 |
| D | 0 | 236 | 0 |
| Mode M9 | |||
|---|---|---|---|
| Quadrant | BADHDUFLAG | Total packets | Discarded packets |
| A | 0 | 40 | 0 |
| B | 0 | 40 | 0 |
| C | 0 | 40 | 0 |
| D | 0 | 40 | 0 |
| Quadrant | Total seconds | Saturated seconds | Saturation percentage |
|---|---|---|---|
| A | 11411 | 14 | 0.122689% |
| B | 11411 | 730 | 6.397336% |
| C | 11411 | 106 | 0.928928% |
| D | 11411 | 1105 | 9.683639% |
Noise dominated data is calculated using 1-second bins in cleaned event files. If a bin has >2000 counts, and if more than 50% of those come from <1% of pixels, then it is considered to be noise-dominated and hence unusable.
| Quadrant | # 1 sec bins | Bins with >0 counts | Bins with >2000 counts | High rate bins dominated by noise | Noise dominated (total time) | Noise dominated (detector-on time) | Marked lightcurve |
|---|---|---|---|---|---|---|---|
| A | 15529 | 11414 | 0 | 0 | 0.00% | 0.00% | 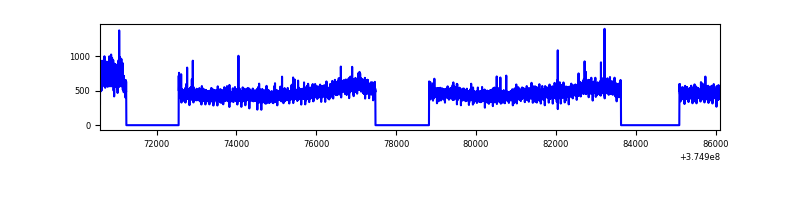 |
| B | 15529 | 11414 | 454 | 454 | 2.92% | 3.98% | 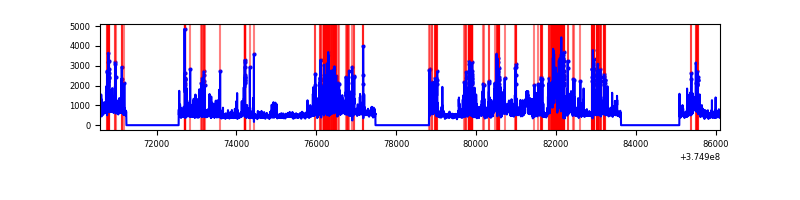 |
| C | 15529 | 11414 | 83 | 83 | 0.53% | 0.73% | 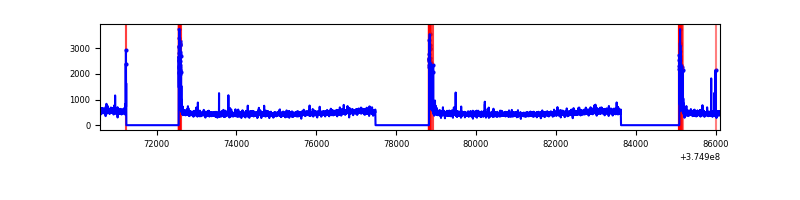 |
| D | 15529 | 11414 | 844 | 844 | 5.43% | 7.39% | 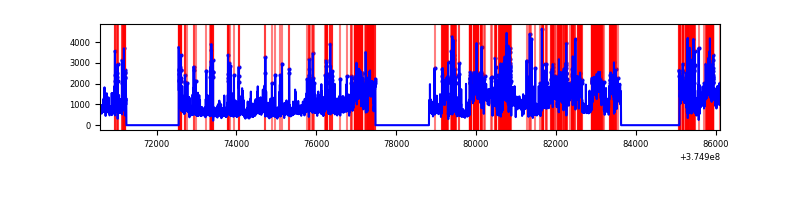 |
Top three noisy pixels from each quadrant. If the there are fewer than three noisy pixels in the level2.evt file, extra rows are filled as -1
| Pixel properties | Quadrant properties | ||||||
|---|---|---|---|---|---|---|---|
| Quadrant | DetID | PixID | Counts | Sigma | Mean | Median | Sigma |
| A | 15 | 47 | 163613 | 599.04 | 1355 | 1326 | 270.9 |
| A | 13 | 6 | 28951 | 101.97 | 1355 | 1326 | 270.9 |
| A | 13 | 254 | 21821 | 75.65 | 1355 | 1326 | 270.9 |
| B | 4 | 170 | 1617884 | 6457.28 | 1315 | 1280 | 250.4 |
| B | 5 | 172 | 968489 | 3863.37 | 1315 | 1280 | 250.4 |
| B | 0 | 219 | 268984 | 1069.3 | 1315 | 1280 | 250.4 |
| C | 0 | 10 | 399452 | 1307.04 | 1313 | 1322 | 304.6 |
| C | 14 | 67 | 34569 | 109.15 | 1313 | 1322 | 304.6 |
| C | 1 | 23 | 20430 | 62.73 | 1313 | 1322 | 304.6 |
| D | 8 | 195 | 5491221 | 15899.08 | 1274 | 1250 | 345.3 |
| D | 2 | 250 | 693982 | 2006.17 | 1274 | 1250 | 345.3 |
| D | 13 | 249 | 381699 | 1101.79 | 1274 | 1250 | 345.3 |
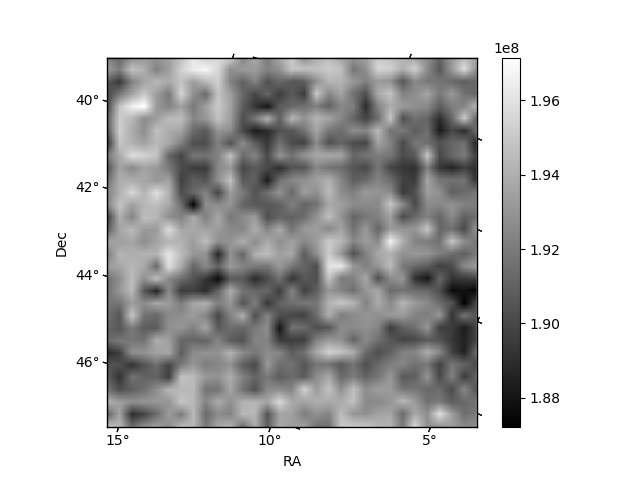
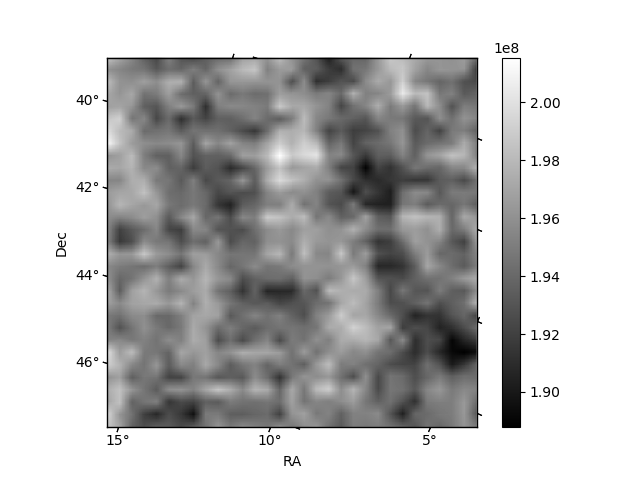
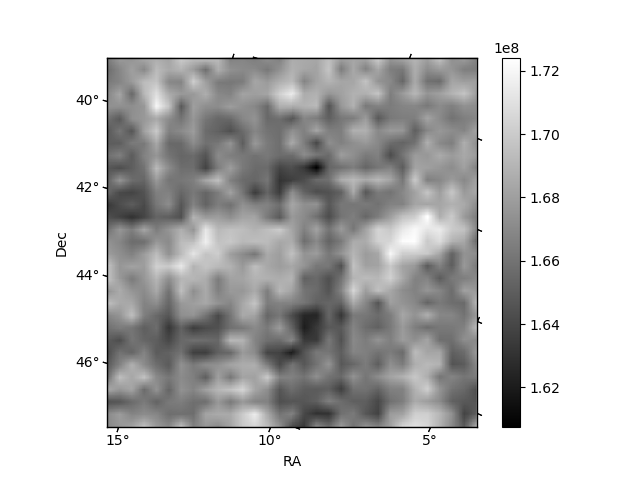
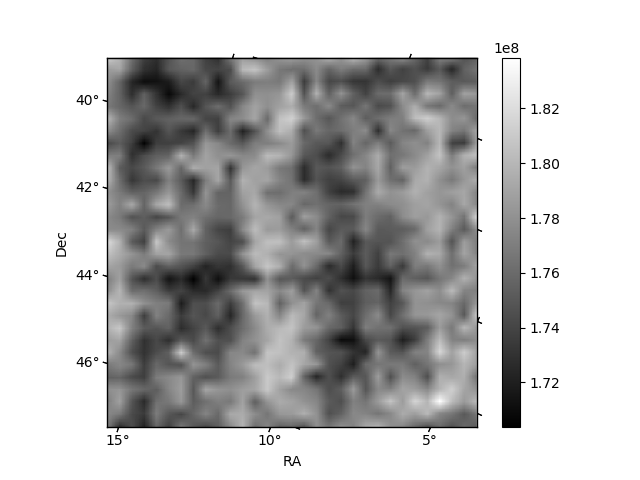
Histogram calculated using DETX and DETY for each event in the final _common_clean file
| Quadrant A |  |
 |
Quadrant B |
|---|---|---|---|
| Quadrant D |  |
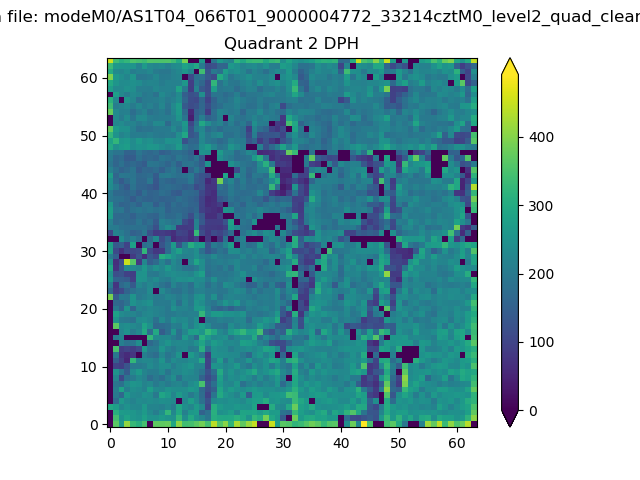 |
Quadrant C |
| Plot type | Count rate plots | Images |
|---|---|---|
| Comparison with Poisson distribution Blue bars denote a histogram of data divided into 1 sec bins. Red curve is a Poisson curve with rate = median count rate of data. |
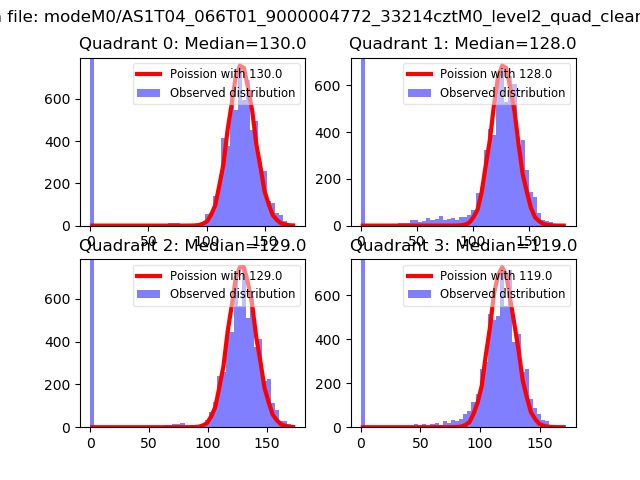 |
 |
| Quadrant-wise count rates Data is divided into 100 sec bins |
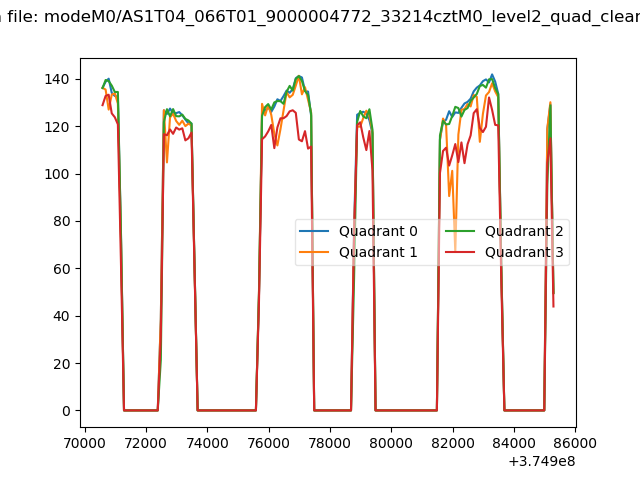 |
|
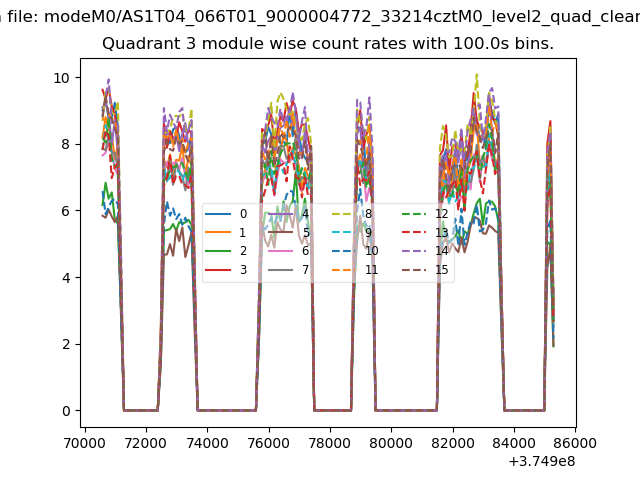
| Module-wise count rates for Quadrant A Data is divided into 100 sec bins |
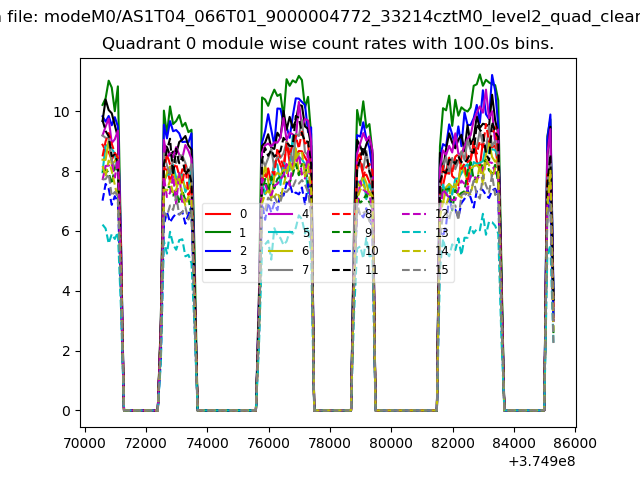 |
 |
| Module-wise count rates for Quadrant B Data is divided into 100 sec bins |
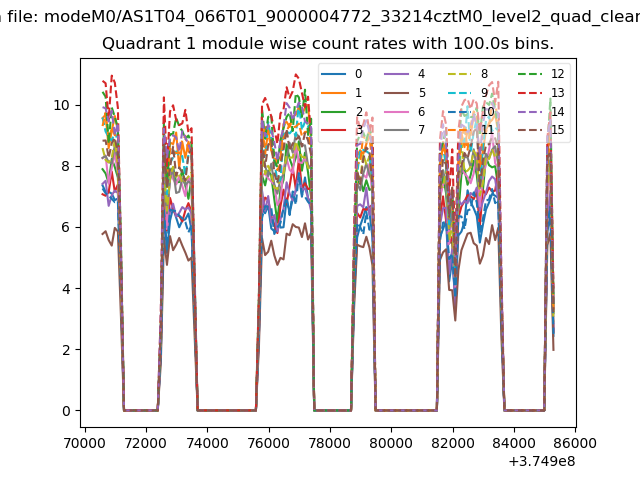 |
 |
| Module-wise count rates for Quadrant C Data is divided into 100 sec bins |
 |
 |
| Module-wise count rates for Quadrant D Data is divided into 100 sec bins |
 |
 |
| Parameter | Plot |
|---|---|
| CZT HV Monitor |  |
| D_VDD | 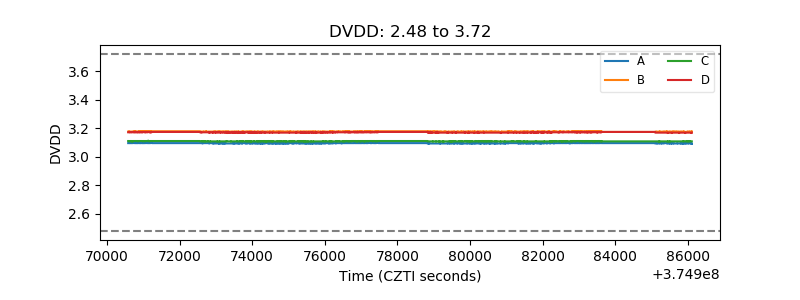 |
| Temperature 1 | 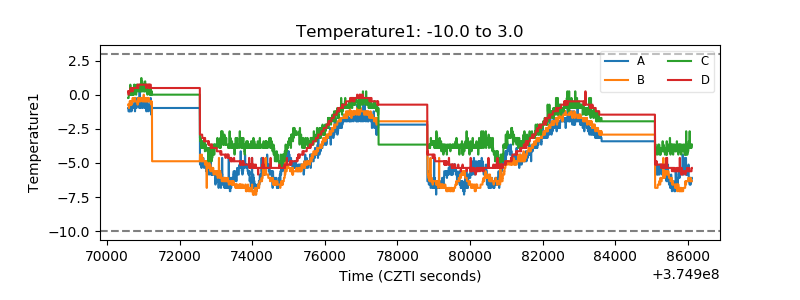 |
| Veto HV Monitor | 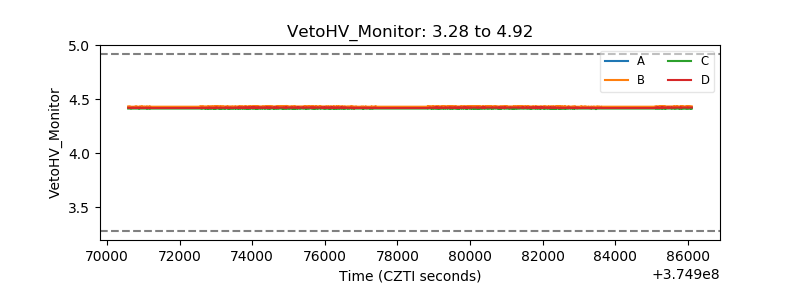 |
| Veto LLD | 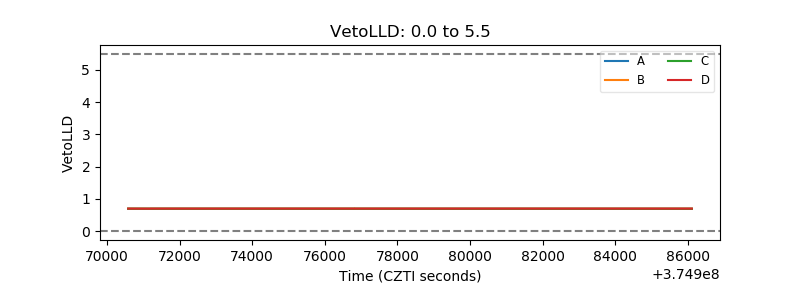 |
| Alpha Counter | 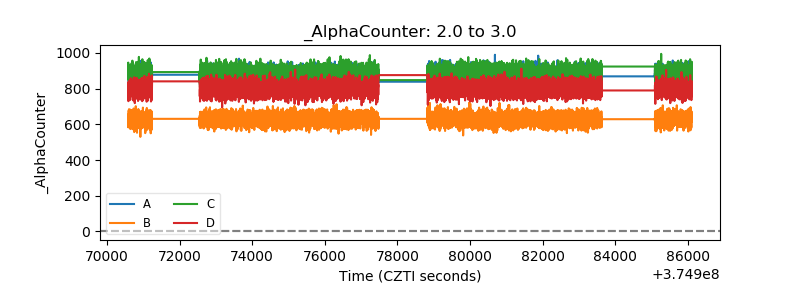 |
| _CPM_Rate | 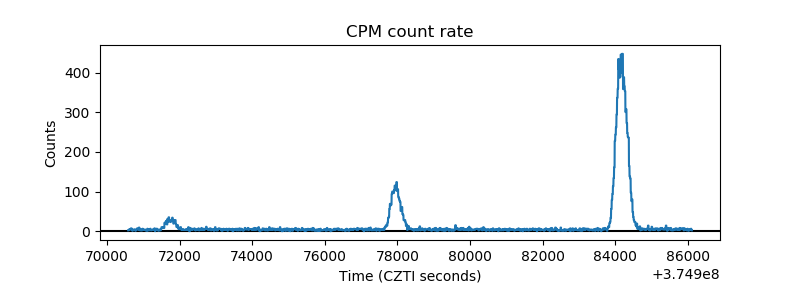 |
| CZT Counter | 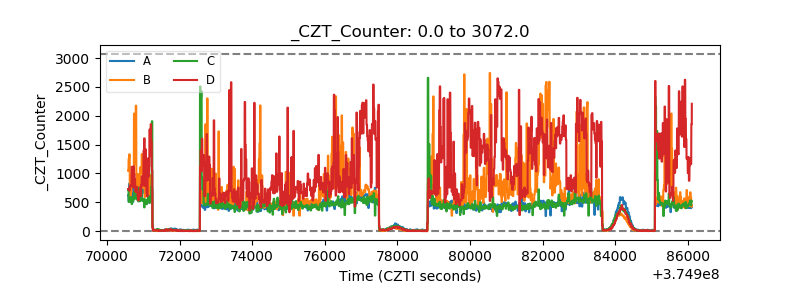 |
| +2.5 Volts monitor |  |
| +5 Volts monitor |  |
| _ROLL_ROT | 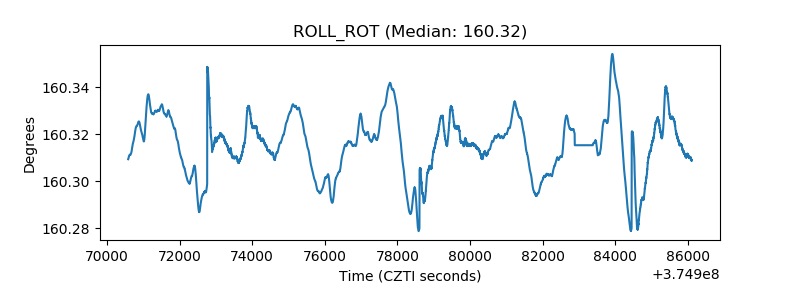 |
| _Roll_DEC | 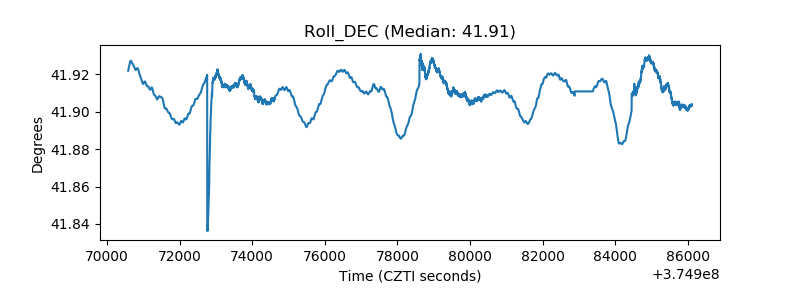 |
| _Roll_RA | 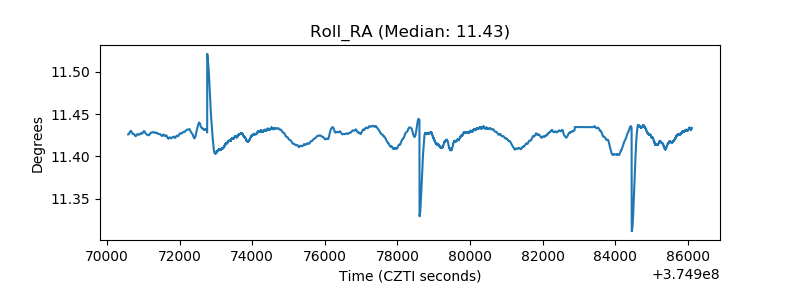 |
| Veto Counter | 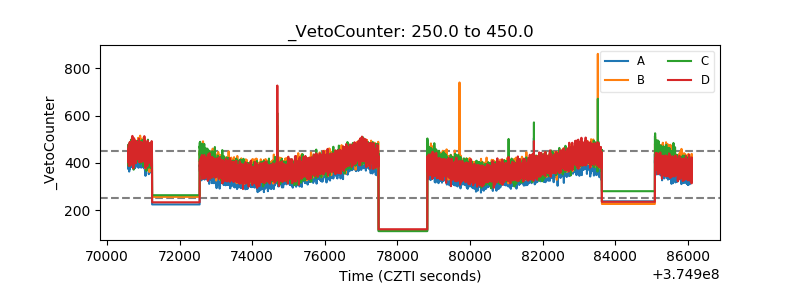 |