| Param | Original file | Final file |
|---|---|---|
| Filename | modeM0/AS1T04_066T01_9000004772_33215cztM0_level2.evt | modeM0/AS1T04_066T01_9000004772_33215cztM0_level2_quad_clean.evt |
| Size (bytes) | 597,110,400 | 55,615,680 |
| Size | 569.4 MB | 53.0 MB |
| Events in quadrant A | 2,740,703 | 332,472 |
| Events in quadrant B | 3,871,070 | 323,035 |
| Events in quadrant C | 2,952,075 | 329,106 |
| Events in quadrant D | 8,128,752 | 294,167 |
| Mode M0 | |||
|---|---|---|---|
| Quadrant | BADHDUFLAG | Total packets | Discarded packets |
| A | 0 | 11729 | 3 |
| B | 0 | 15174 | 2 |
| C | 0 | 12634 | 2 |
| D | 0 | 28234 | 2 |
| Mode SS | |||
|---|---|---|---|
| Quadrant | BADHDUFLAG | Total packets | Discarded packets |
| A | 0 | 118 | 0 |
| B | 0 | 118 | 0 |
| C | 0 | 118 | 0 |
| D | 0 | 118 | 0 |
| Mode M9 | |||
|---|---|---|---|
| Quadrant | BADHDUFLAG | Total packets | Discarded packets |
| A | 0 | 16 | 0 |
| B | 0 | 16 | 0 |
| C | 0 | 16 | 0 |
| D | 0 | 16 | 0 |
| Quadrant | Total seconds | Saturated seconds | Saturation percentage |
|---|---|---|---|
| A | 5787 | 8 | 0.138241% |
| B | 5787 | 237 | 4.095386% |
| C | 5787 | 69 | 1.192328% |
| D | 5787 | 706 | 12.199758% |
Noise dominated data is calculated using 1-second bins in cleaned event files. If a bin has >2000 counts, and if more than 50% of those come from <1% of pixels, then it is considered to be noise-dominated and hence unusable.
| Quadrant | # 1 sec bins | Bins with >0 counts | Bins with >2000 counts | High rate bins dominated by noise | Noise dominated (total time) | Noise dominated (detector-on time) | Marked lightcurve |
|---|---|---|---|---|---|---|---|
| A | 7370 | 5788 | 1 | 1 | 0.01% | 0.02% | 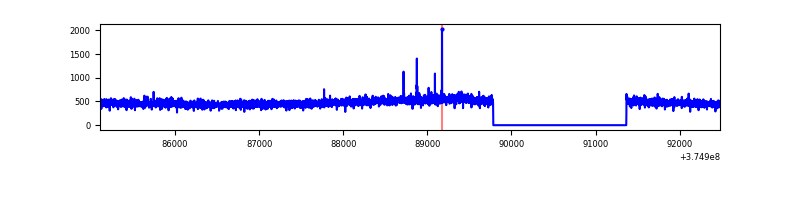 |
| B | 7370 | 5788 | 139 | 139 | 1.89% | 2.40% | 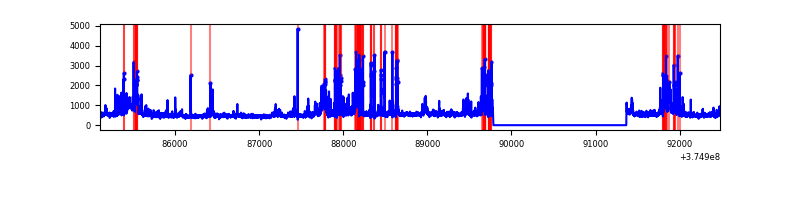 |
| C | 7370 | 5788 | 48 | 48 | 0.65% | 0.83% | 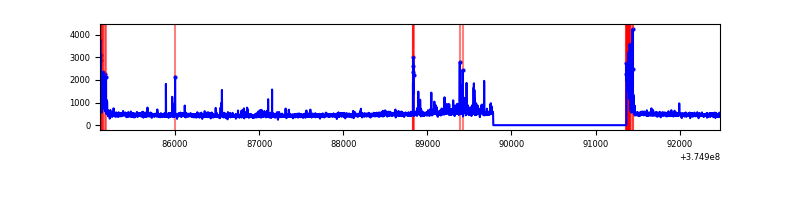 |
| D | 7370 | 5788 | 656 | 656 | 8.90% | 11.33% | 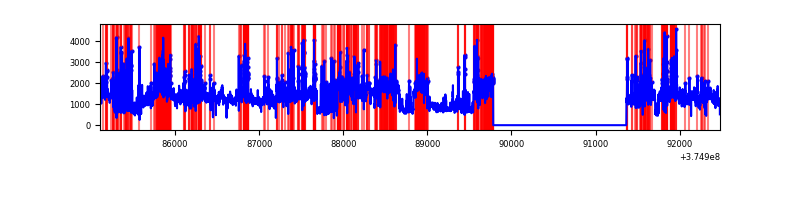 |
Top three noisy pixels from each quadrant. If the there are fewer than three noisy pixels in the level2.evt file, extra rows are filled as -1
| Pixel properties | Quadrant properties | ||||||
|---|---|---|---|---|---|---|---|
| Quadrant | DetID | PixID | Counts | Sigma | Mean | Median | Sigma |
| A | 15 | 47 | 82252 | 587.91 | 682 | 670 | 138.8 |
| A | 13 | 254 | 10856 | 73.4 | 682 | 670 | 138.8 |
| A | 14 | 254 | 10781 | 72.86 | 682 | 670 | 138.8 |
| B | 5 | 172 | 501430 | 3899.69 | 671 | 655 | 128.4 |
| B | 4 | 170 | 358213 | 2784.41 | 671 | 655 | 128.4 |
| B | 5 | 200 | 121105 | 937.98 | 671 | 655 | 128.4 |
| C | 0 | 10 | 206507 | 1345.92 | 660 | 665 | 152.9 |
| C | 15 | 159 | 81644 | 529.49 | 660 | 665 | 152.9 |
| C | 1 | 23 | 29178 | 186.44 | 660 | 665 | 152.9 |
| D | 8 | 195 | 4093448 | 23829.81 | 637 | 621 | 171.8 |
| D | 2 | 250 | 687439 | 3998.88 | 637 | 621 | 171.8 |
| D | 12 | 6 | 254035 | 1475.46 | 637 | 621 | 171.8 |
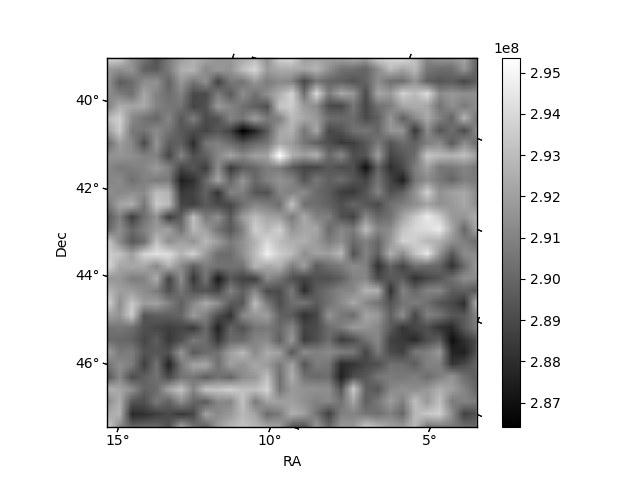
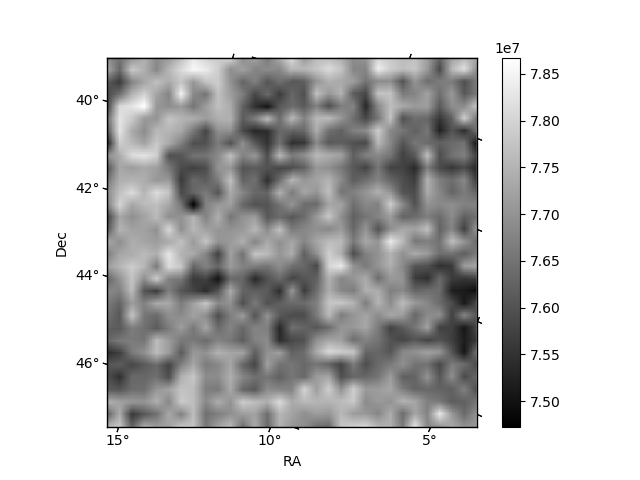
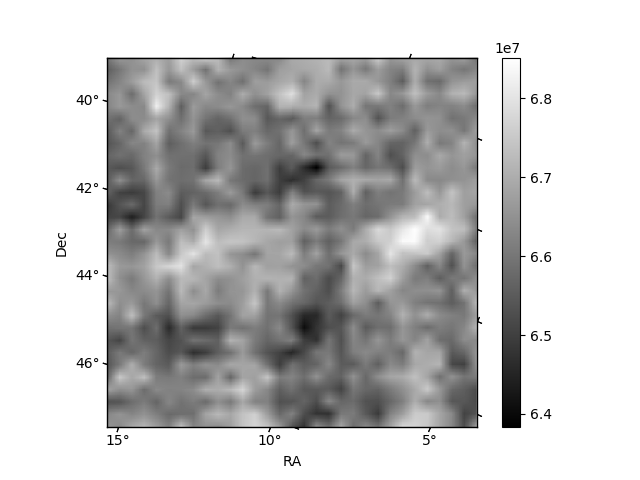
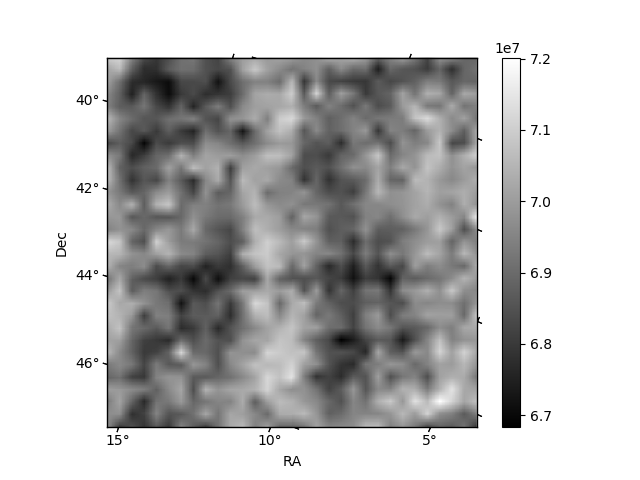
Histogram calculated using DETX and DETY for each event in the final _common_clean file
| Quadrant A | 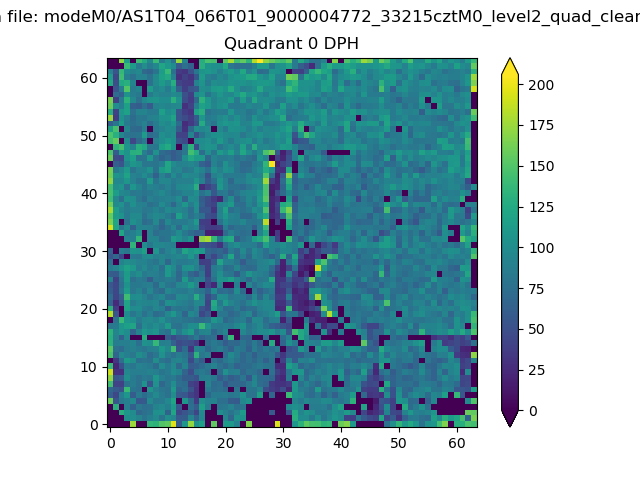 |
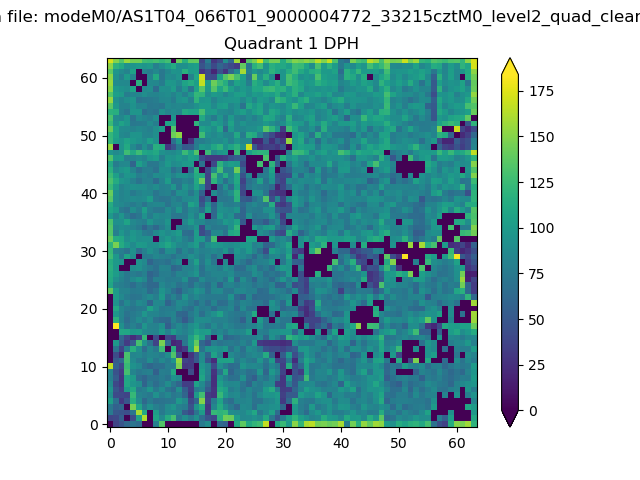 |
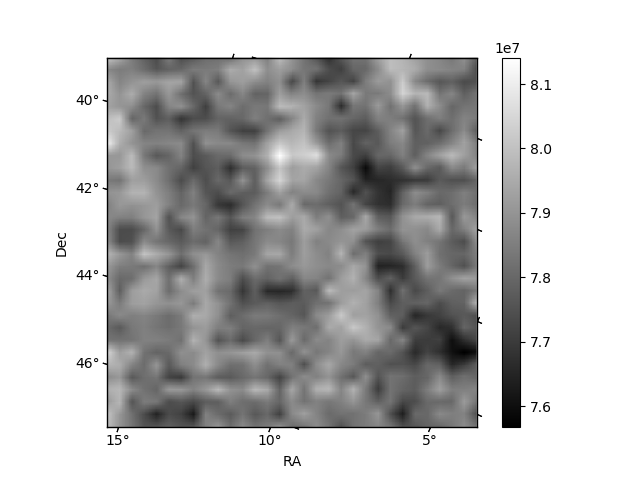
Quadrant B |
|---|---|---|---|
| Quadrant D | 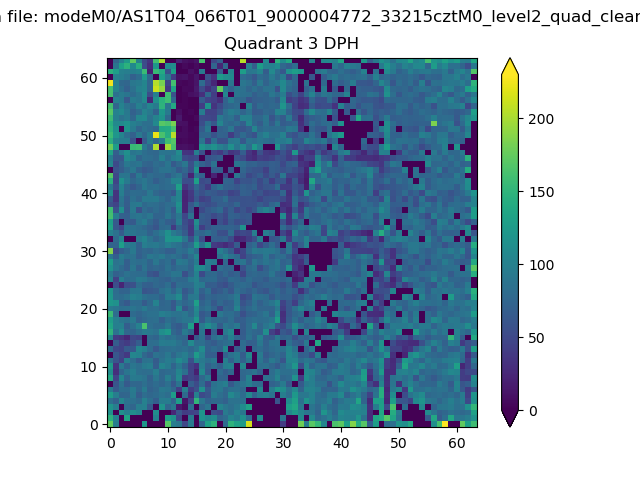 |
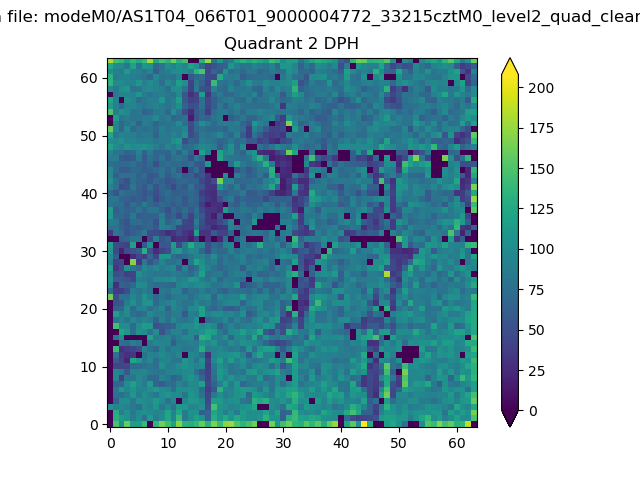 |
Quadrant C |
| Plot type | Count rate plots | Images |
|---|---|---|
| Comparison with Poisson distribution Blue bars denote a histogram of data divided into 1 sec bins. Red curve is a Poisson curve with rate = median count rate of data. |
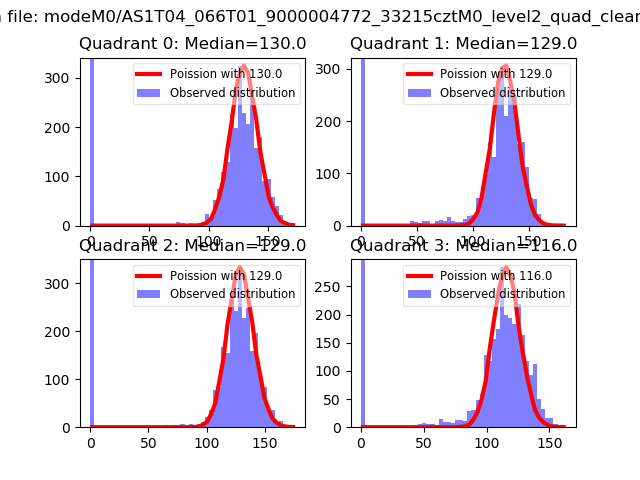 |
 |
| Quadrant-wise count rates Data is divided into 100 sec bins |
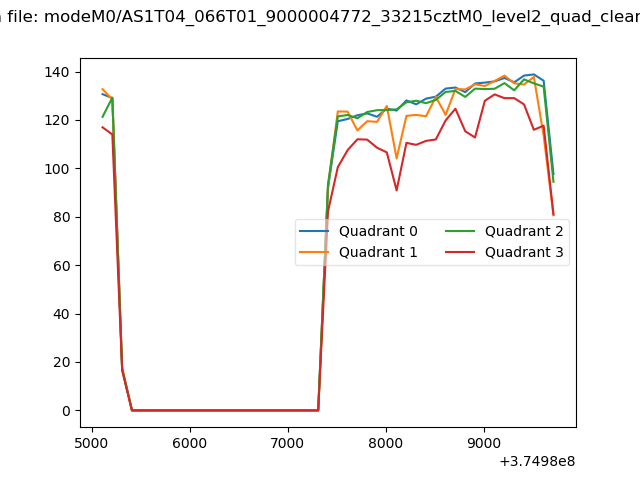 |
|
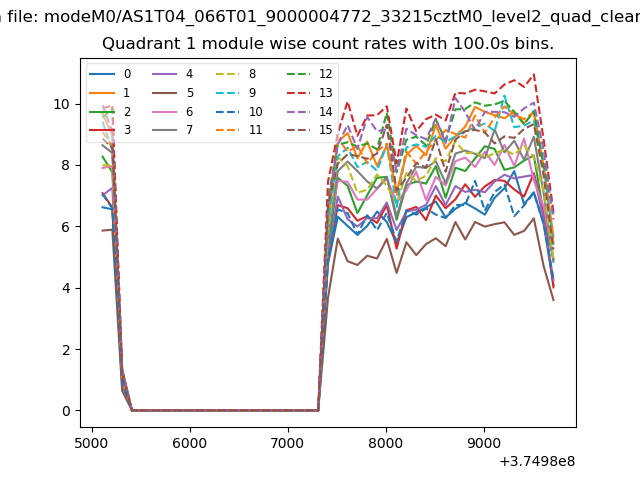
| Module-wise count rates for Quadrant A Data is divided into 100 sec bins |
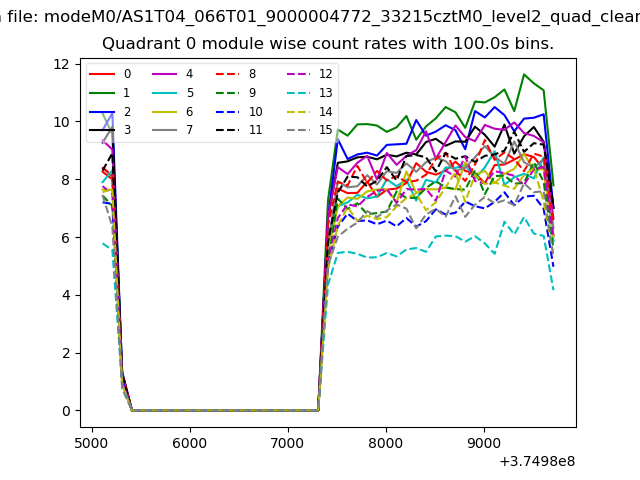 |
 |
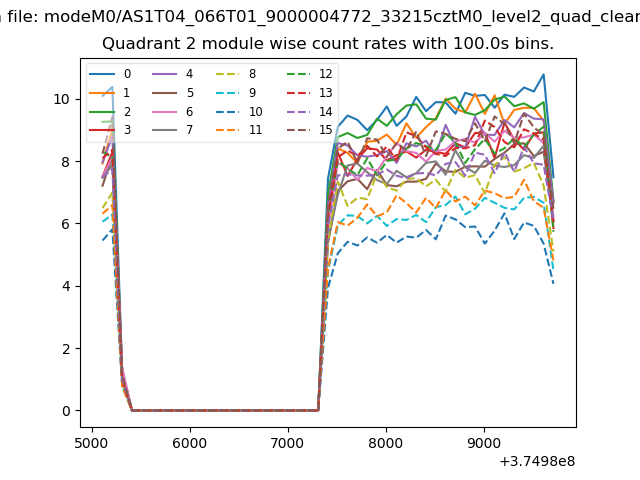
| Module-wise count rates for Quadrant B Data is divided into 100 sec bins |
 |
 |
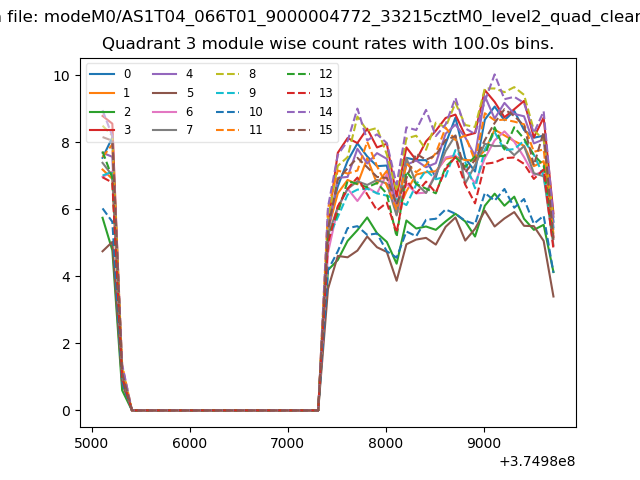
| Module-wise count rates for Quadrant C Data is divided into 100 sec bins |
 |
 |
| Module-wise count rates for Quadrant D Data is divided into 100 sec bins |
 |
 |
| Parameter | Plot |
|---|---|
| CZT HV Monitor | 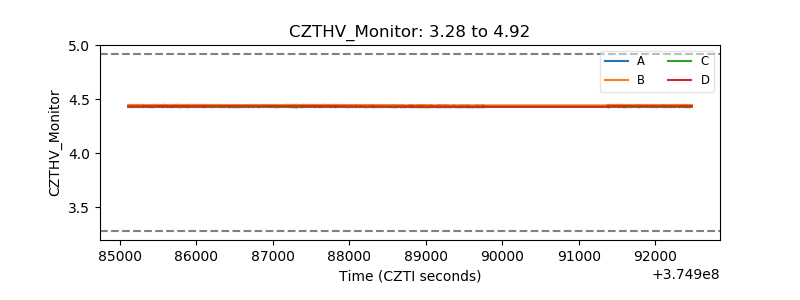 |
| D_VDD | 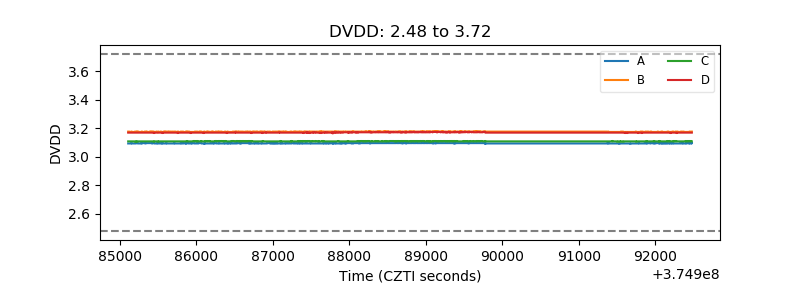 |
| Temperature 1 | 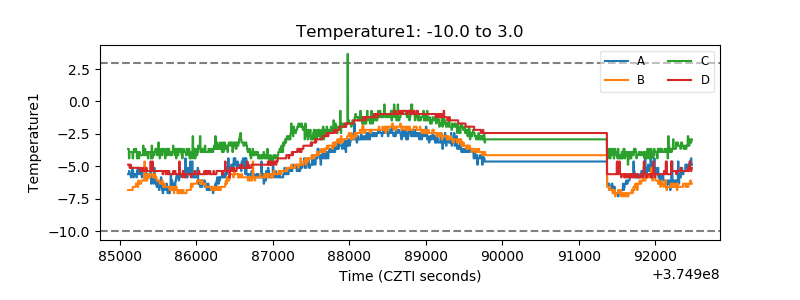 |
| Veto HV Monitor | 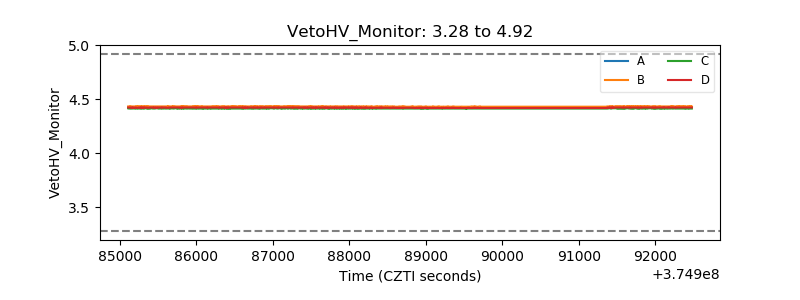 |
| Veto LLD | 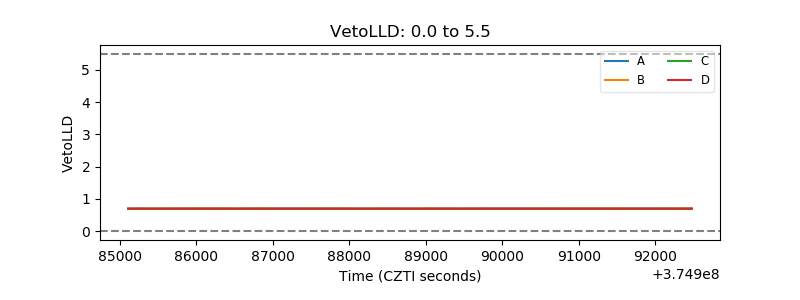 |
| Alpha Counter | 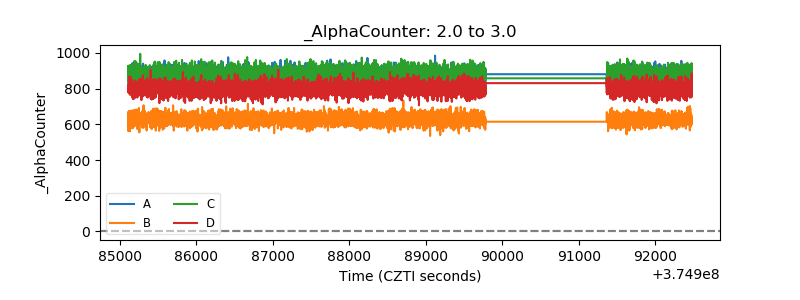 |
| _CPM_Rate | 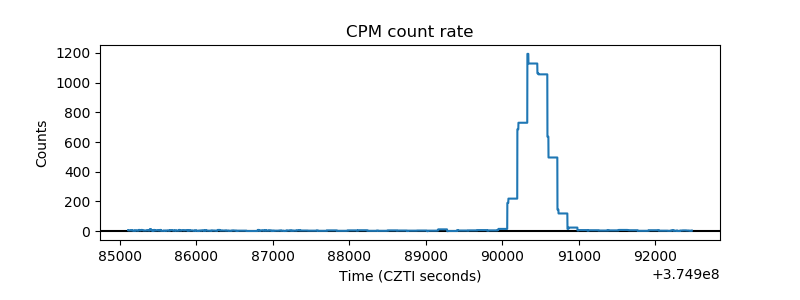 |
| CZT Counter | 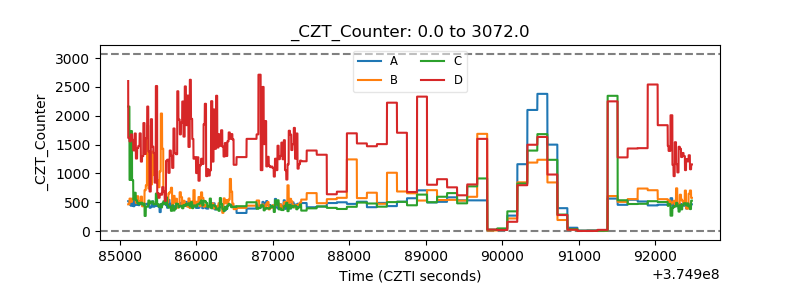 |
| +2.5 Volts monitor |  |
| +5 Volts monitor | 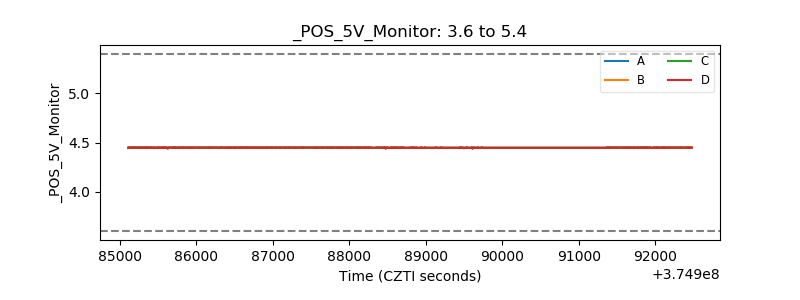 |
| _ROLL_ROT | 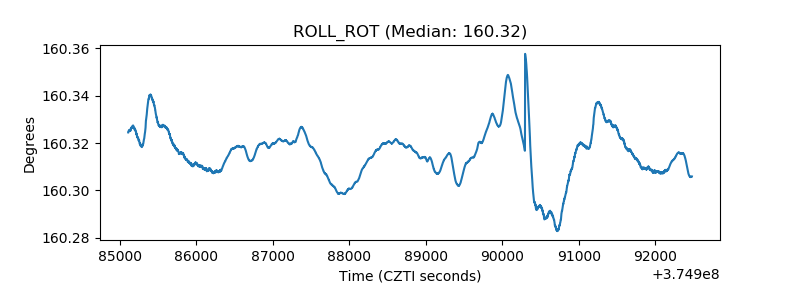 |
| _Roll_DEC | 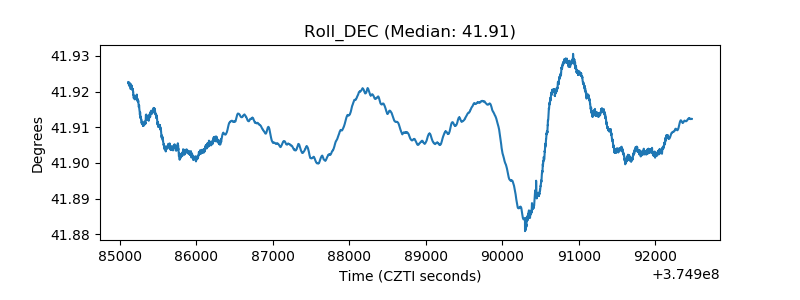 |
| _Roll_RA | 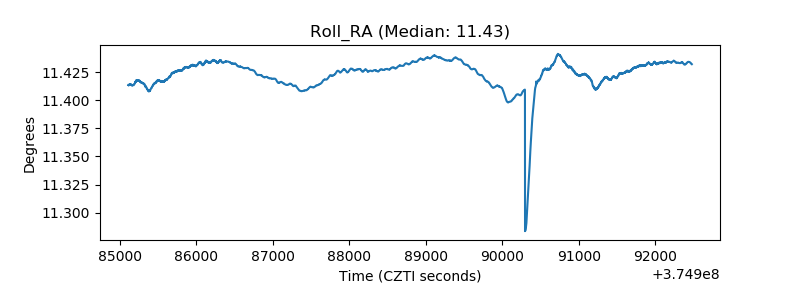 |
| Veto Counter | 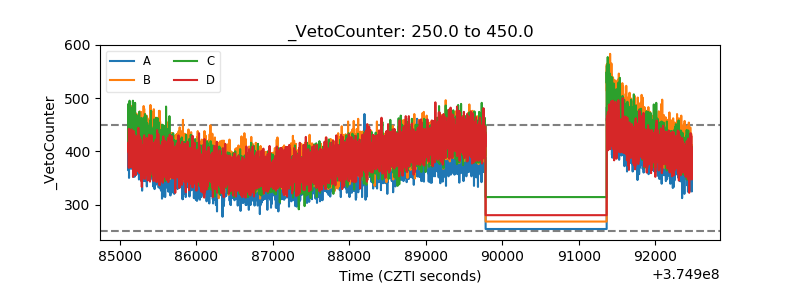 |