| Param | Original file | Final file |
|---|---|---|
| Filename | modeM0/AS1T04_066T01_9000004772_33216cztM0_level2.evt | modeM0/AS1T04_066T01_9000004772_33216cztM0_level2_quad_clean.evt |
| Size (bytes) | 574,081,920 | 57,202,560 |
| Size | 547.5 MB | 54.6 MB |
| Events in quadrant A | 2,668,120 | 348,121 |
| Events in quadrant B | 3,649,610 | 344,470 |
| Events in quadrant C | 2,801,839 | 344,803 |
| Events in quadrant D | 7,890,790 | 305,190 |
| Mode M0 | |||
|---|---|---|---|
| Quadrant | BADHDUFLAG | Total packets | Discarded packets |
| A | 0 | 11229 | 3 |
| B | 0 | 14364 | 2 |
| C | 0 | 11804 | 2 |
| D | 0 | 27353 | 2 |
| Mode SS | |||
|---|---|---|---|
| Quadrant | BADHDUFLAG | Total packets | Discarded packets |
| A | 0 | 114 | 0 |
| B | 0 | 114 | 0 |
| C | 0 | 114 | 0 |
| D | 0 | 114 | 0 |
| Mode M9 | |||
|---|---|---|---|
| Quadrant | BADHDUFLAG | Total packets | Discarded packets |
| A | 0 | 19 | 0 |
| B | 0 | 19 | 0 |
| C | 0 | 19 | 0 |
| D | 0 | 20 | 0 |
| Quadrant | Total seconds | Saturated seconds | Saturation percentage |
|---|---|---|---|
| A | 5558 | 6 | 0.107953% |
| B | 5558 | 144 | 2.590860% |
| C | 5558 | 70 | 1.259446% |
| D | 5558 | 638 | 11.478949% |
Noise dominated data is calculated using 1-second bins in cleaned event files. If a bin has >2000 counts, and if more than 50% of those come from <1% of pixels, then it is considered to be noise-dominated and hence unusable.
| Quadrant | # 1 sec bins | Bins with >0 counts | Bins with >2000 counts | High rate bins dominated by noise | Noise dominated (total time) | Noise dominated (detector-on time) | Marked lightcurve |
|---|---|---|---|---|---|---|---|
| A | 7260 | 5559 | 0 | 0 | 0.00% | 0.00% | 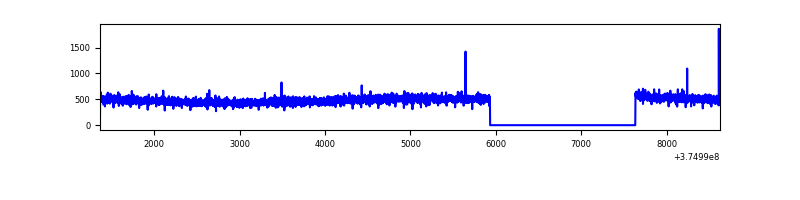 |
| B | 7260 | 5559 | 84 | 84 | 1.16% | 1.51% | 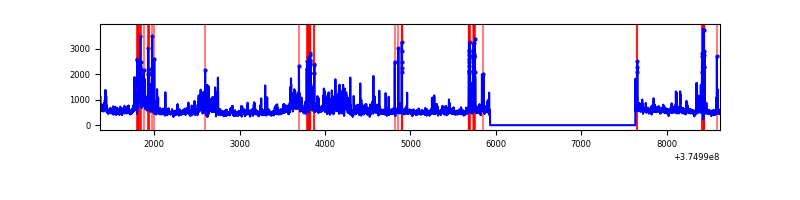 |
| C | 7260 | 5559 | 52 | 52 | 0.72% | 0.94% | 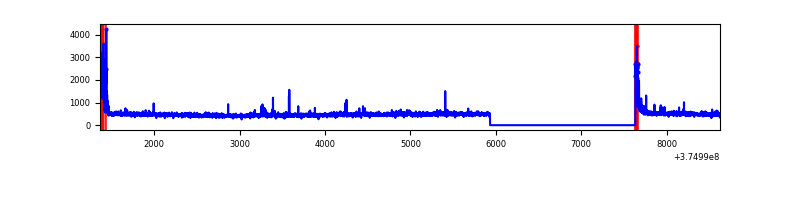 |
| D | 7260 | 5559 | 682 | 682 | 9.39% | 12.27% | 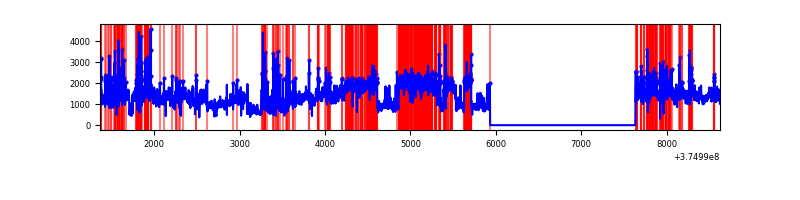 |
Top three noisy pixels from each quadrant. If the there are fewer than three noisy pixels in the level2.evt file, extra rows are filled as -1
| Pixel properties | Quadrant properties | ||||||
|---|---|---|---|---|---|---|---|
| Quadrant | DetID | PixID | Counts | Sigma | Mean | Median | Sigma |
| A | 15 | 47 | 42218 | 305.08 | 677 | 663 | 136.2 |
| A | 13 | 254 | 9523 | 65.05 | 677 | 663 | 136.2 |
| A | 14 | 254 | 6684 | 44.2 | 677 | 663 | 136.2 |
| B | 4 | 170 | 336892 | 2631.05 | 668 | 652 | 127.8 |
| B | 5 | 172 | 331272 | 2587.07 | 668 | 652 | 127.8 |
| B | 0 | 219 | 167500 | 1305.57 | 668 | 652 | 127.8 |
| C | 0 | 10 | 204812 | 1364.46 | 649 | 656 | 149.6 |
| C | 15 | 159 | 20694 | 133.92 | 649 | 656 | 149.6 |
| C | 14 | 67 | 15330 | 98.07 | 649 | 656 | 149.6 |
| D | 8 | 195 | 4061487 | 24695.94 | 634 | 619 | 164.4 |
| D | 2 | 250 | 547721 | 3327.17 | 634 | 619 | 164.4 |
| D | 10 | 203 | 262306 | 1591.43 | 634 | 619 | 164.4 |
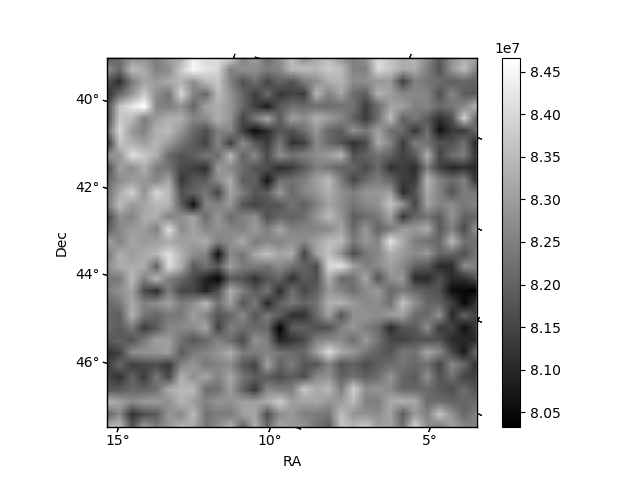
Histogram calculated using DETX and DETY for each event in the final _common_clean file
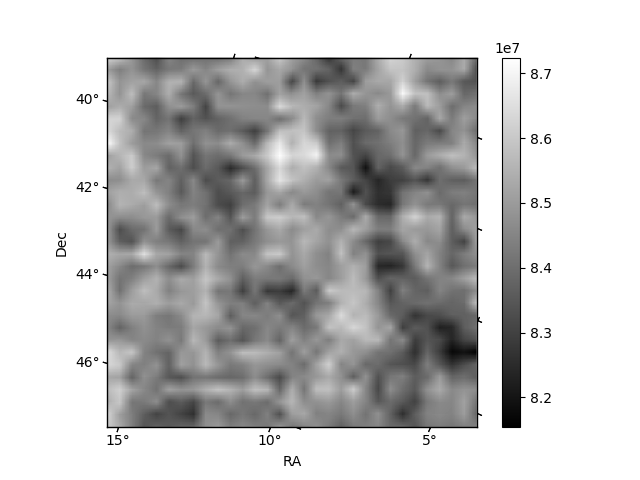
| Quadrant A |  |
 |
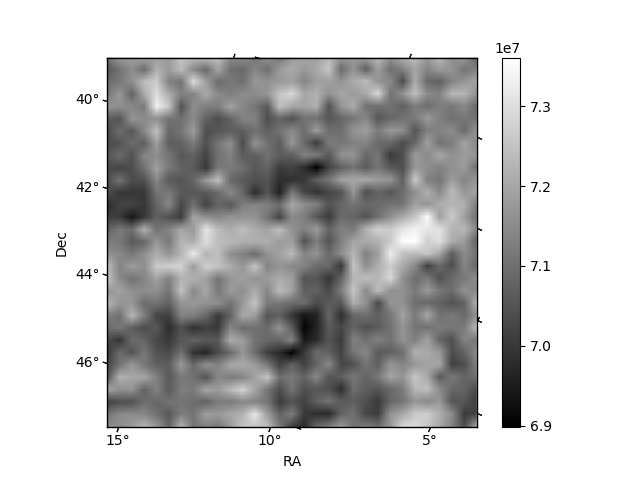
Quadrant B |
|---|---|---|---|
| Quadrant D |  |
 |
Quadrant C |
| Plot type | Count rate plots | Images |
|---|---|---|
| Comparison with Poisson distribution Blue bars denote a histogram of data divided into 1 sec bins. Red curve is a Poisson curve with rate = median count rate of data. |
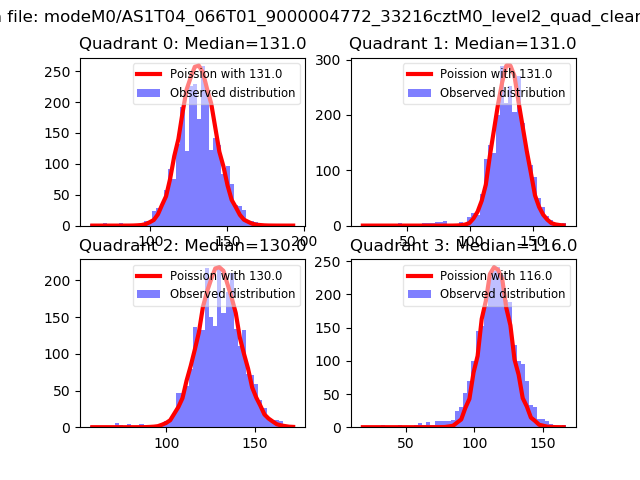 |
 |
| Quadrant-wise count rates Data is divided into 100 sec bins |
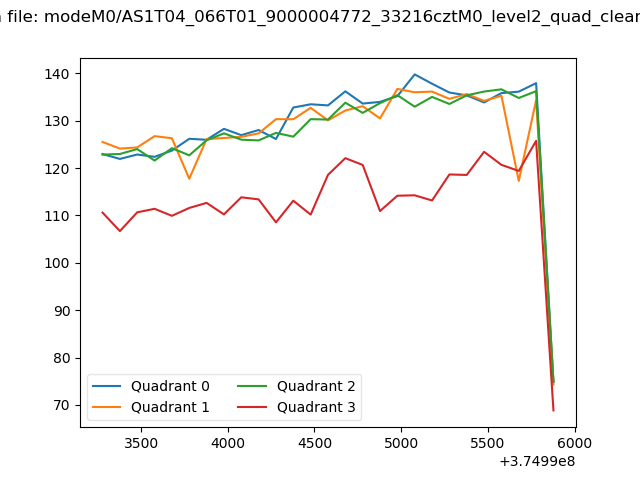 |
|
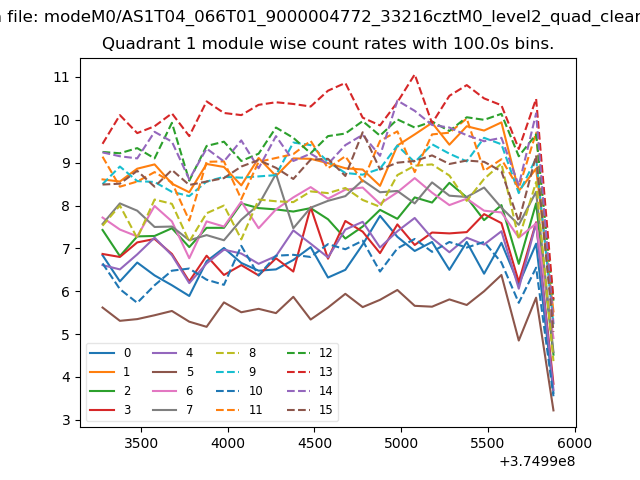
| Module-wise count rates for Quadrant A Data is divided into 100 sec bins |
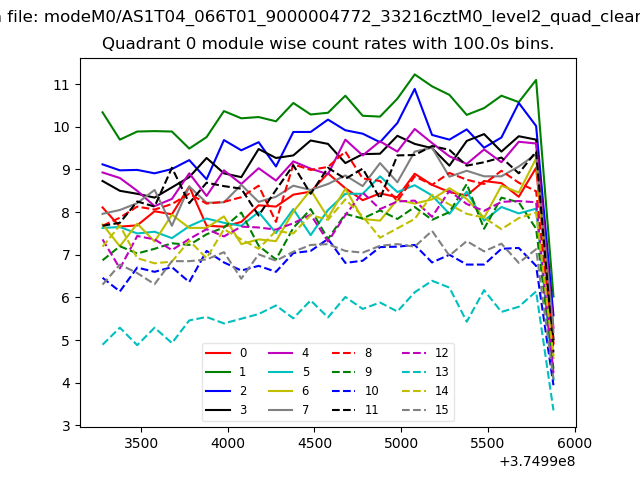 |
 |
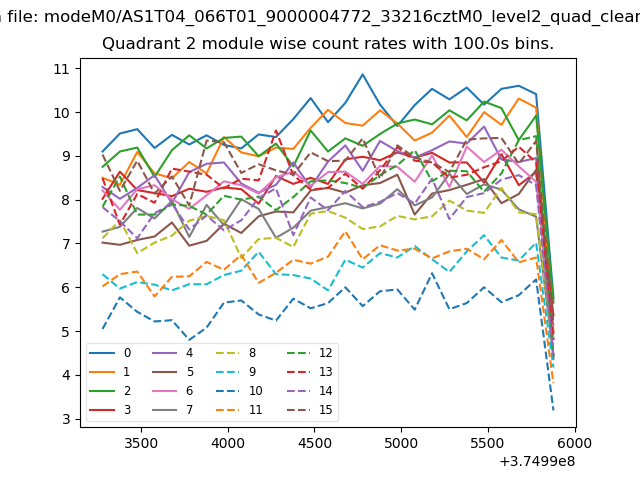
| Module-wise count rates for Quadrant B Data is divided into 100 sec bins |
 |
 |
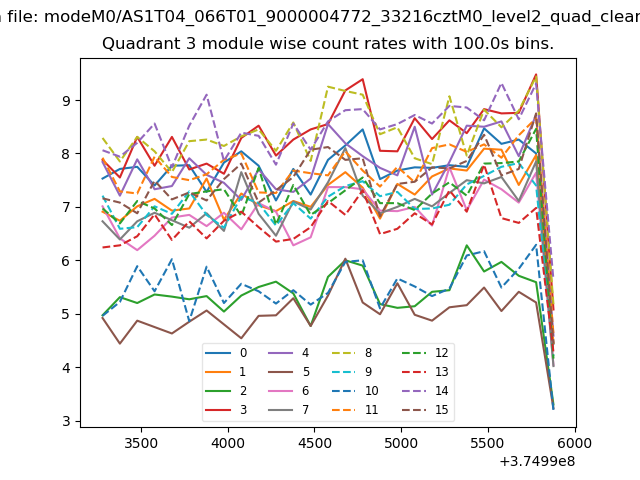
| Module-wise count rates for Quadrant C Data is divided into 100 sec bins |
 |
 |
| Module-wise count rates for Quadrant D Data is divided into 100 sec bins |
 |
 |
| Parameter | Plot |
|---|---|
| CZT HV Monitor | 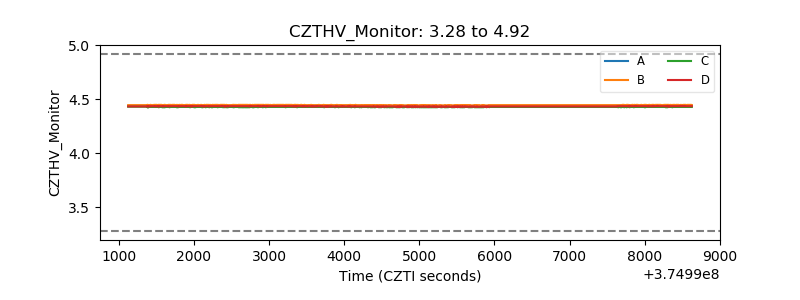 |
| D_VDD | 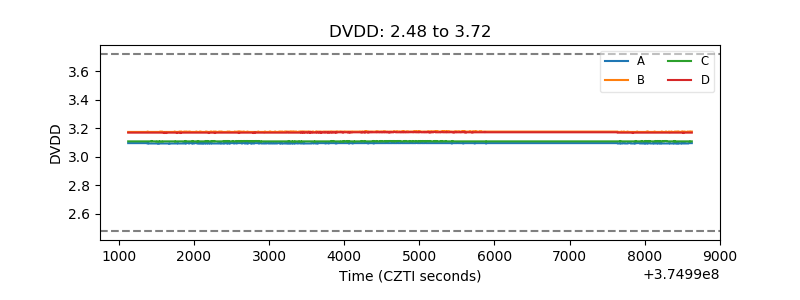 |
| Temperature 1 | 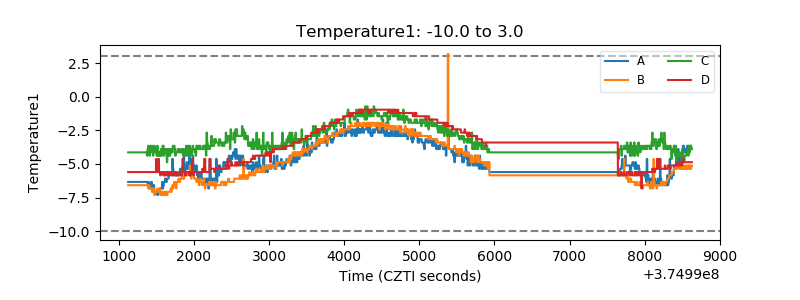 |
| Veto HV Monitor |  |
| Veto LLD | 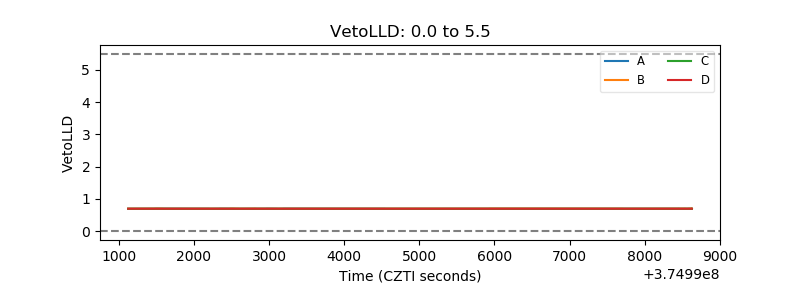 |
| Alpha Counter | 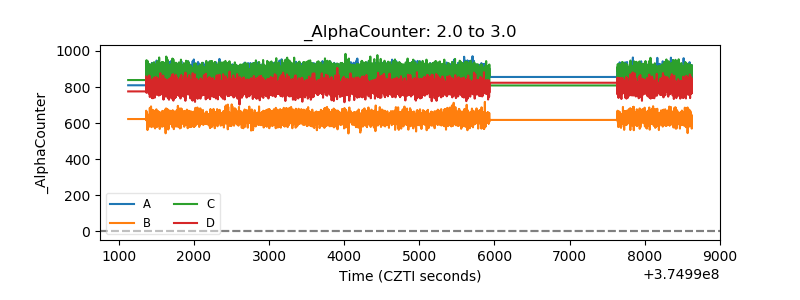 |
| _CPM_Rate | 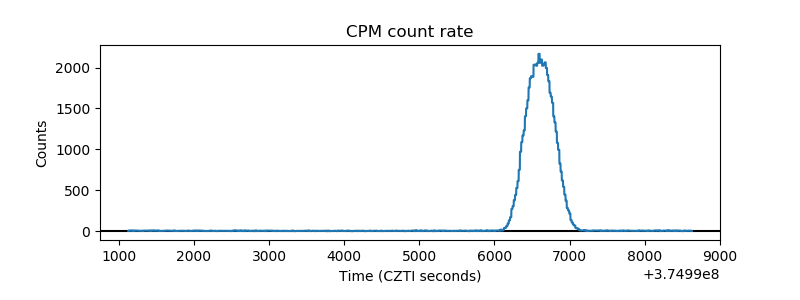 |
| CZT Counter |  |
| +2.5 Volts monitor |  |
| +5 Volts monitor | 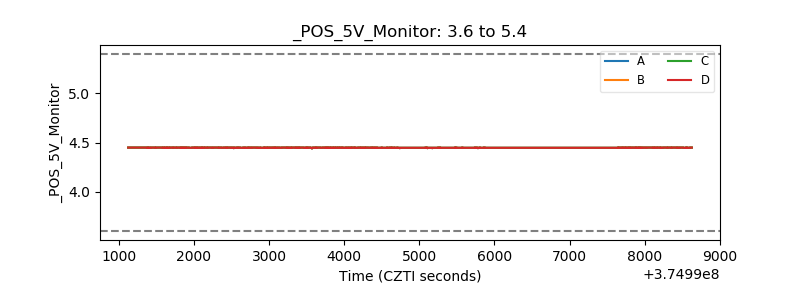 |
| _ROLL_ROT | 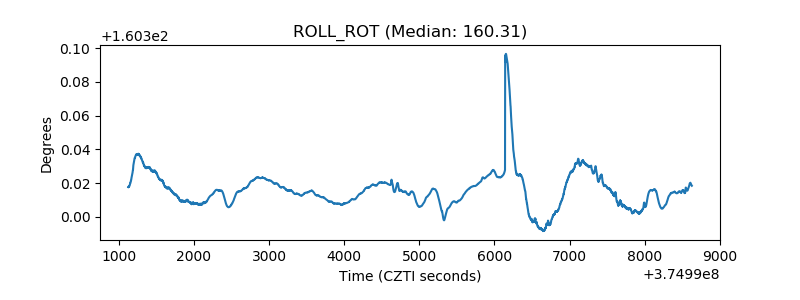 |
| _Roll_DEC |  |
| _Roll_RA |  |
| Veto Counter | 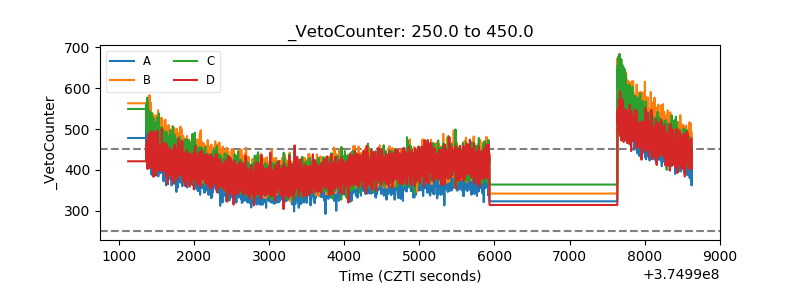 |