| Param | Original file | Final file |
|---|---|---|
| Filename | modeM0/AS1T04_066T01_9000004772_33219cztM0_level2.evt | modeM0/AS1T04_066T01_9000004772_33219cztM0_level2_quad_clean.evt |
| Size (bytes) | 561,942,720 | 77,097,600 |
| Size | 535.9 MB | 73.5 MB |
| Events in quadrant A | 2,786,543 | 515,548 |
| Events in quadrant B | 3,385,422 | 511,339 |
| Events in quadrant C | 2,870,402 | 499,803 |
| Events in quadrant D | 7,627,892 | 446,209 |
| Mode M0 | |||
|---|---|---|---|
| Quadrant | BADHDUFLAG | Total packets | Discarded packets |
| A | 0 | 11254 | 3 |
| B | 0 | 13425 | 2 |
| C | 0 | 11487 | 2 |
| D | 0 | 26336 | 2 |
| Mode SS | |||
|---|---|---|---|
| Quadrant | BADHDUFLAG | Total packets | Discarded packets |
| A | 0 | 106 | 0 |
| B | 0 | 106 | 0 |
| C | 0 | 106 | 0 |
| D | 0 | 106 | 0 |
| Mode M9 | |||
|---|---|---|---|
| Quadrant | BADHDUFLAG | Total packets | Discarded packets |
| A | 0 | 30 | 0 |
| B | 0 | 30 | 0 |
| C | 0 | 30 | 0 |
| D | 0 | 31 | 0 |
| Quadrant | Total seconds | Saturated seconds | Saturation percentage |
|---|---|---|---|
| A | 5158 | 13 | 0.252036% |
| B | 5158 | 96 | 1.861187% |
| C | 5158 | 62 | 1.202016% |
| D | 5158 | 470 | 9.112059% |
Noise dominated data is calculated using 1-second bins in cleaned event files. If a bin has >2000 counts, and if more than 50% of those come from <1% of pixels, then it is considered to be noise-dominated and hence unusable.
| Quadrant | # 1 sec bins | Bins with >0 counts | Bins with >2000 counts | High rate bins dominated by noise | Noise dominated (total time) | Noise dominated (detector-on time) | Marked lightcurve |
|---|---|---|---|---|---|---|---|
| A | 7131 | 5159 | 6 | 6 | 0.08% | 0.12% | 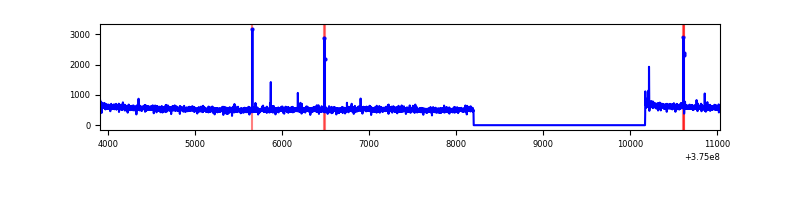 |
| B | 7131 | 5159 | 57 | 57 | 0.80% | 1.10% | 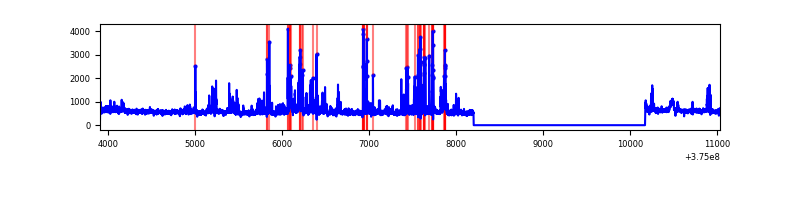 |
| C | 7131 | 5159 | 47 | 47 | 0.66% | 0.91% |  |
| D | 7131 | 5159 | 525 | 525 | 7.36% | 10.18% | 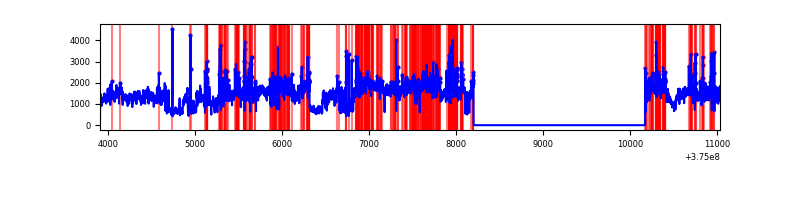 |
Top three noisy pixels from each quadrant. If the there are fewer than three noisy pixels in the level2.evt file, extra rows are filled as -1
| Pixel properties | Quadrant properties | ||||||
|---|---|---|---|---|---|---|---|
| Quadrant | DetID | PixID | Counts | Sigma | Mean | Median | Sigma |
| A | 15 | 47 | 35024 | 247.83 | 701 | 691 | 138.5 |
| A | 14 | 254 | 28359 | 199.72 | 701 | 691 | 138.5 |
| A | 13 | 254 | 9328 | 62.34 | 701 | 691 | 138.5 |
| B | 5 | 172 | 236755 | 1853.47 | 686 | 670 | 127.4 |
| B | 4 | 170 | 170602 | 1334.11 | 686 | 670 | 127.4 |
| B | 0 | 245 | 110252 | 860.31 | 686 | 670 | 127.4 |
| C | 0 | 10 | 221836 | 1489.73 | 656 | 664 | 148.5 |
| C | 1 | 23 | 30004 | 197.62 | 656 | 664 | 148.5 |
| C | 15 | 208 | 20133 | 131.14 | 656 | 664 | 148.5 |
| D | 8 | 195 | 4012160 | 24596.25 | 653 | 636 | 163.1 |
| D | 2 | 250 | 315961 | 1933.38 | 653 | 636 | 163.1 |
| D | 10 | 203 | 299126 | 1830.16 | 653 | 636 | 163.1 |
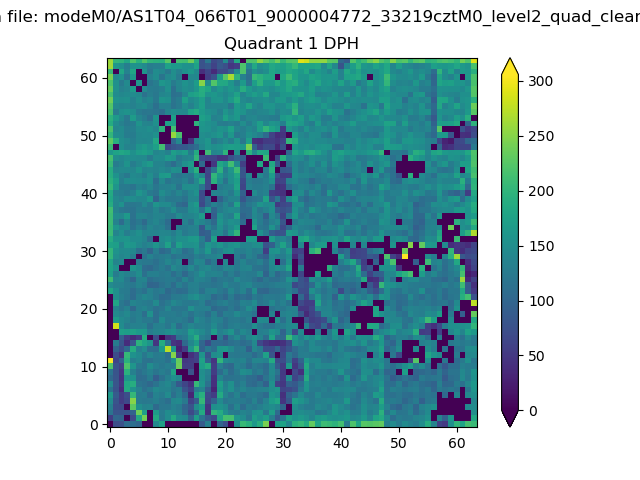
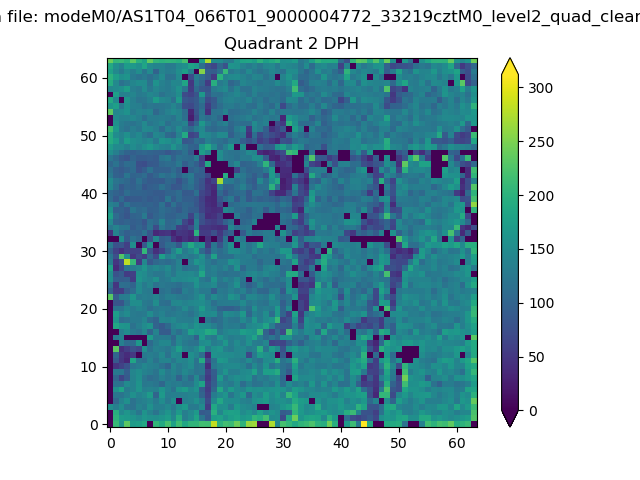
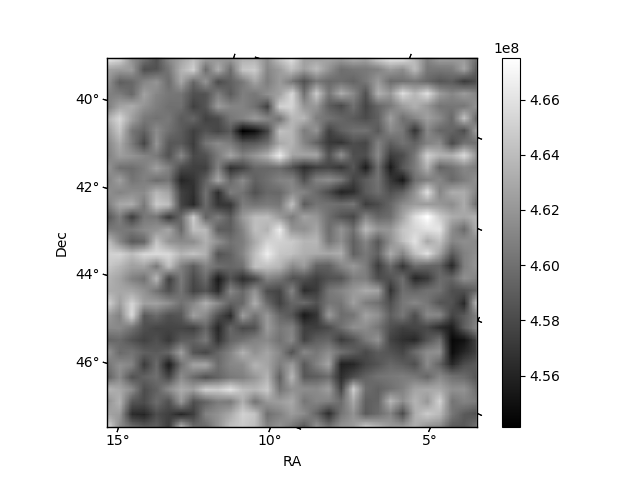
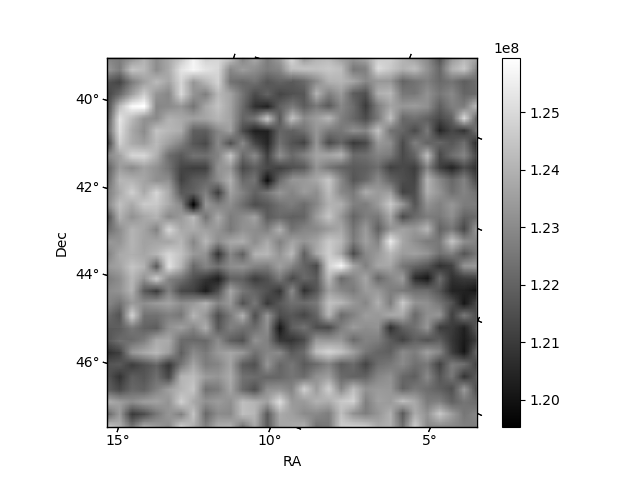
Histogram calculated using DETX and DETY for each event in the final _common_clean file
| Quadrant A | 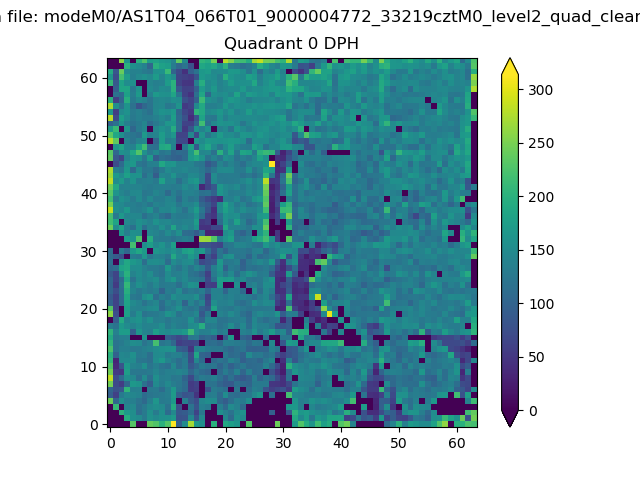 |
 |
Quadrant B |
|---|---|---|---|
| Quadrant D | 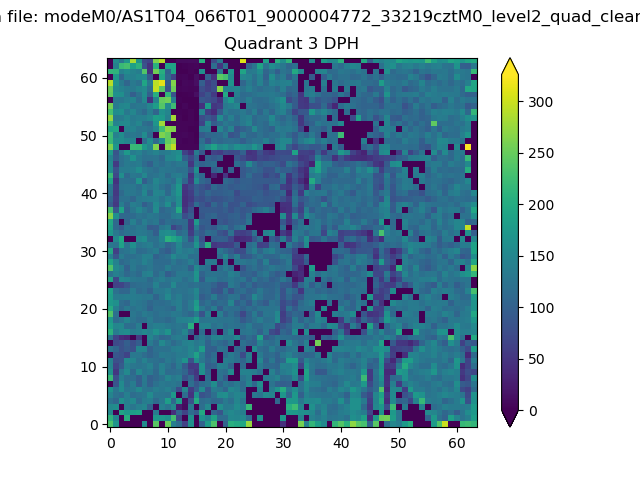 |
 |
Quadrant C |
| Plot type | Count rate plots | Images |
|---|---|---|
| Comparison with Poisson distribution Blue bars denote a histogram of data divided into 1 sec bins. Red curve is a Poisson curve with rate = median count rate of data. |
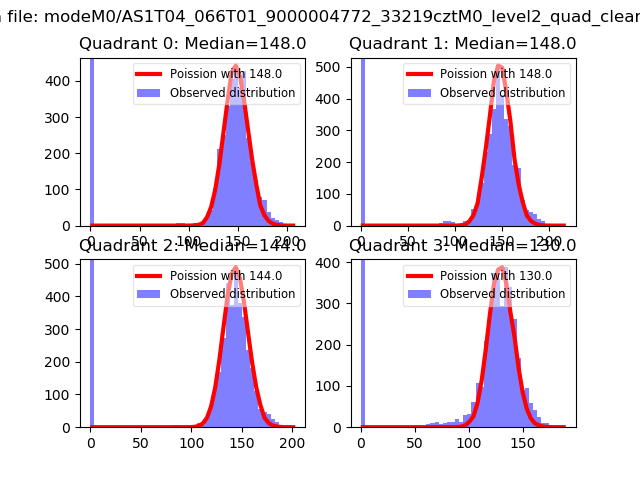 |
 |
| Quadrant-wise count rates Data is divided into 100 sec bins |
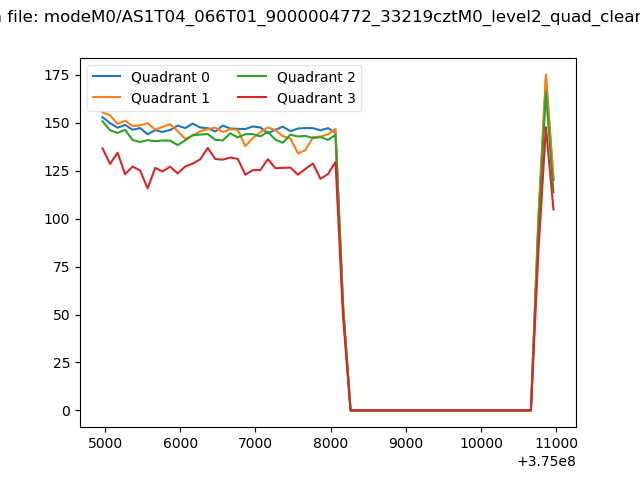 |
|
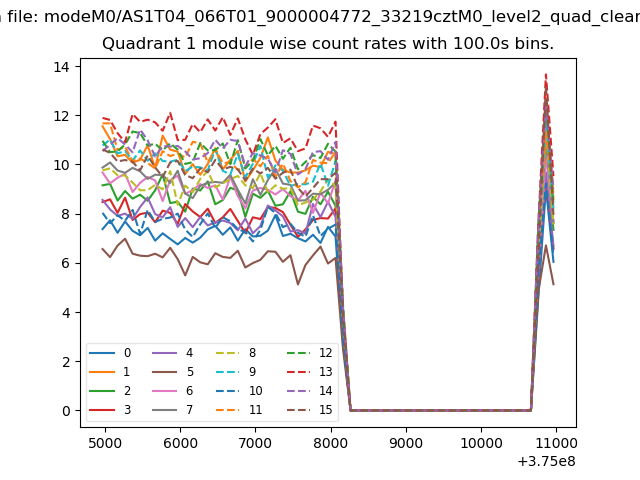
| Module-wise count rates for Quadrant A Data is divided into 100 sec bins |
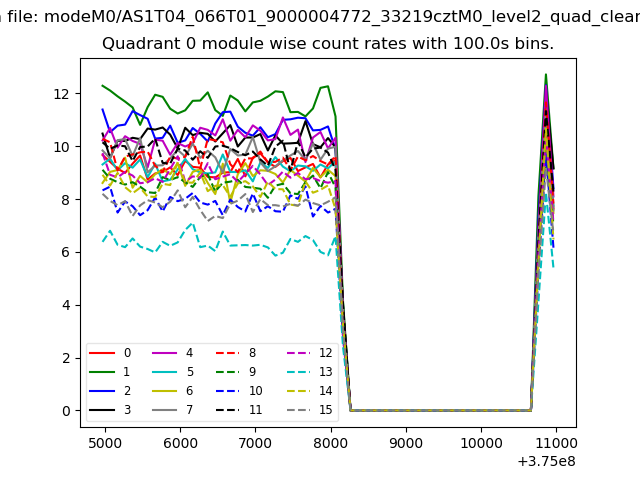 |
 |
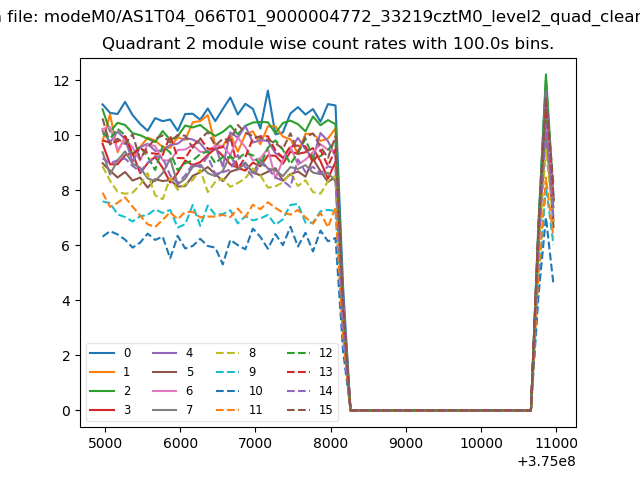
| Module-wise count rates for Quadrant B Data is divided into 100 sec bins |
 |
 |
| Module-wise count rates for Quadrant C Data is divided into 100 sec bins |
 |
 |
| Module-wise count rates for Quadrant D Data is divided into 100 sec bins |
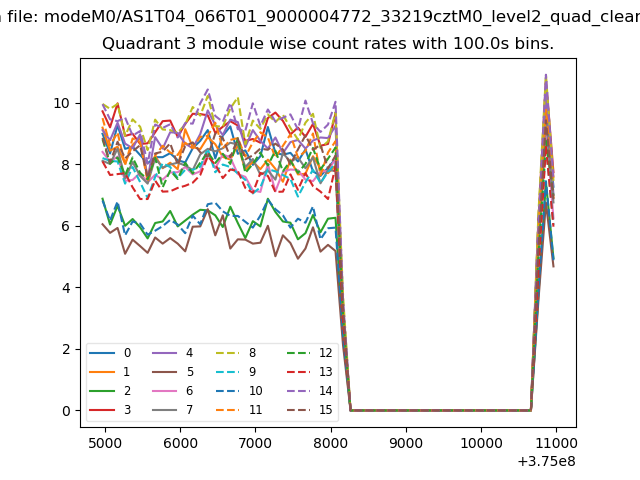 |
 |
| Parameter | Plot |
|---|---|
| CZT HV Monitor | 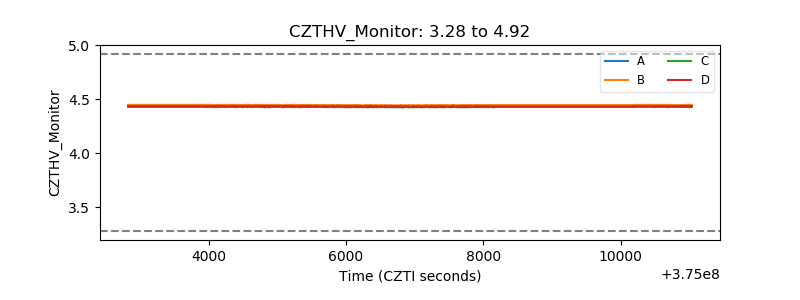 |
| D_VDD | 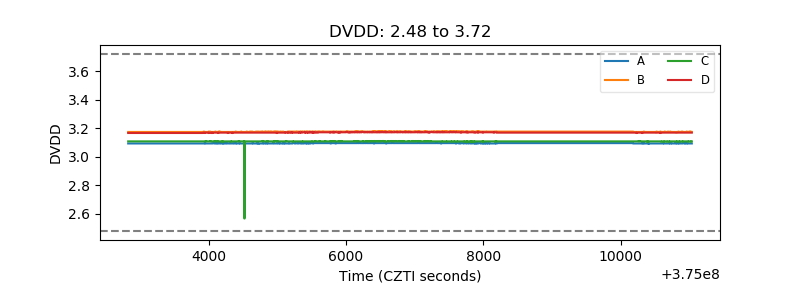 |
| Temperature 1 | 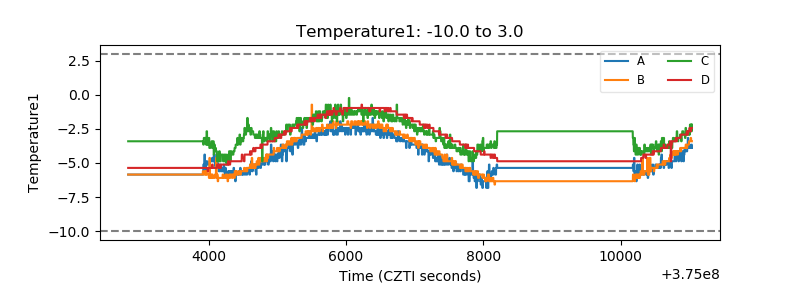 |
| Veto HV Monitor | 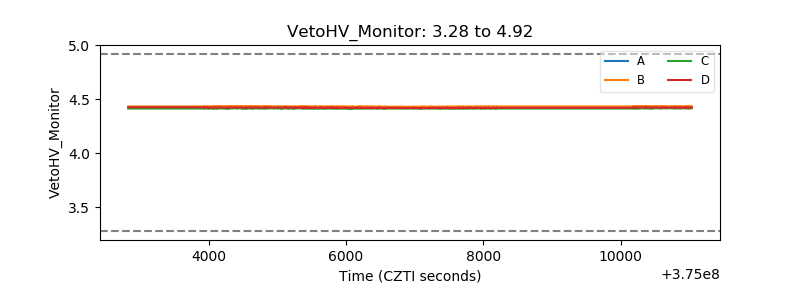 |
| Veto LLD | 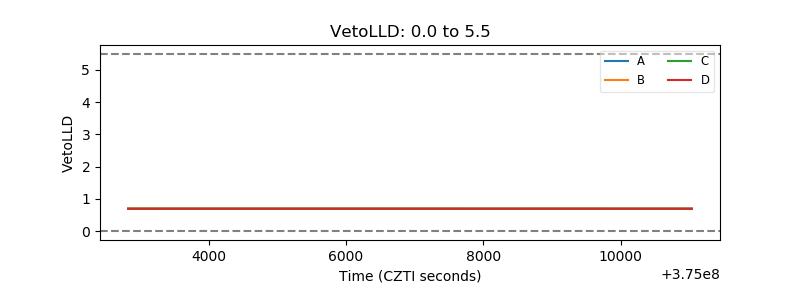 |
| Alpha Counter | 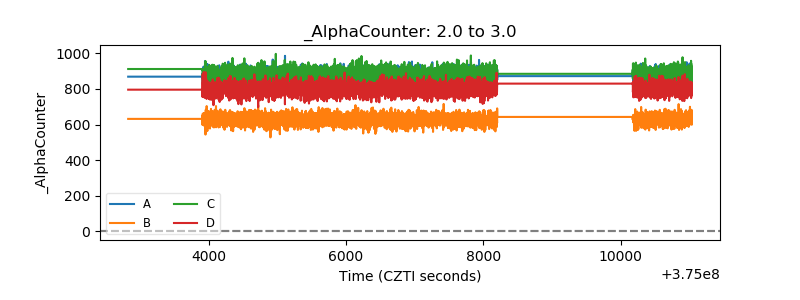 |
| _CPM_Rate | 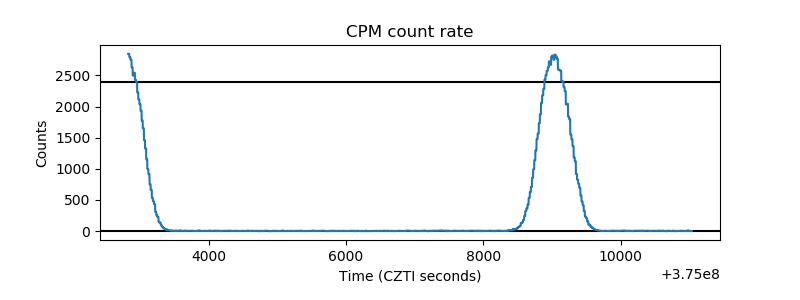 |
| CZT Counter | 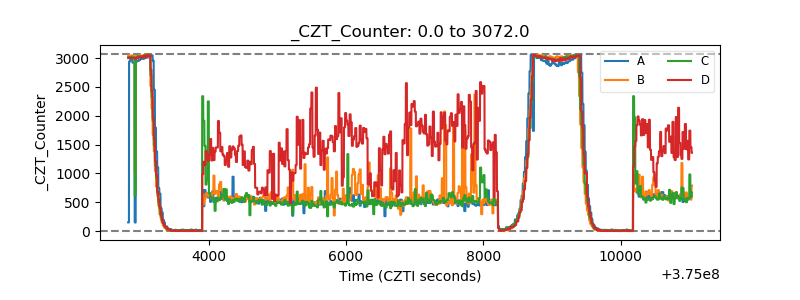 |
| +2.5 Volts monitor |  |
| +5 Volts monitor |  |
| _ROLL_ROT | 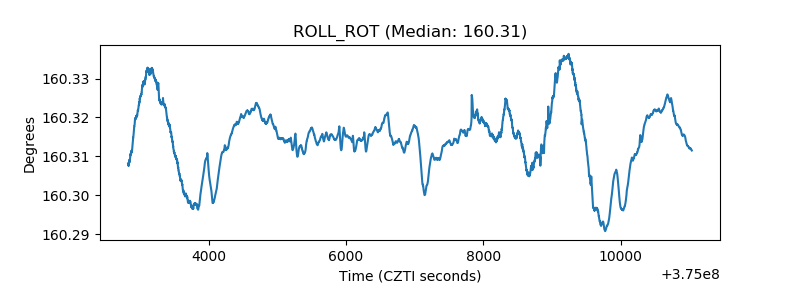 |
| _Roll_DEC | 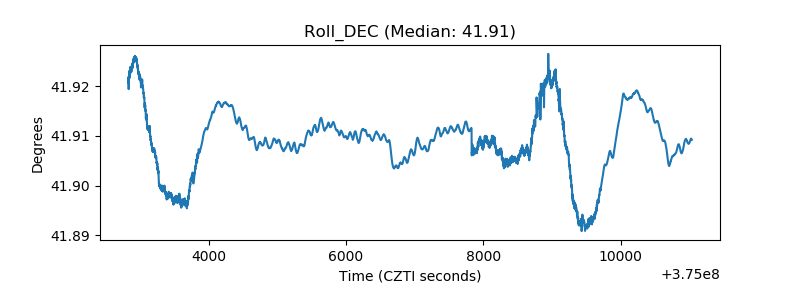 |
| _Roll_RA | 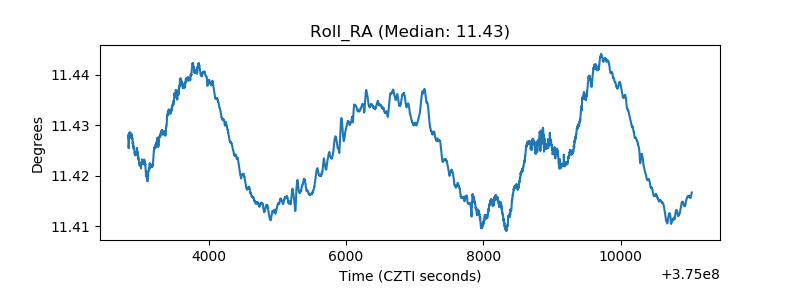 |
| Veto Counter | 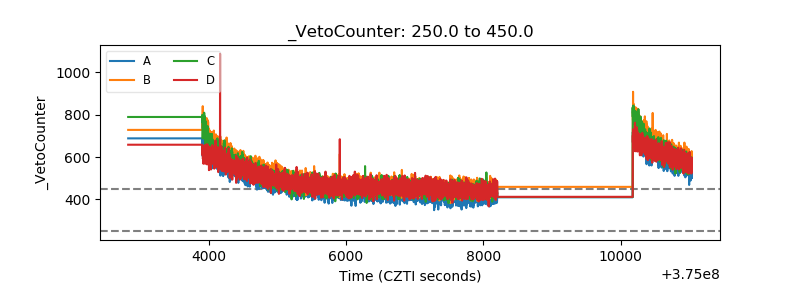 |