| Param | Original file | Final file |
|---|---|---|
| Filename | modeM0/AS1T04_066T01_9000004772_33220cztM0_level2.evt | modeM0/AS1T04_066T01_9000004772_33220cztM0_level2_quad_clean.evt |
| Size (bytes) | 545,947,200 | 96,324,480 |
| Size | 520.7 MB | 91.9 MB |
| Events in quadrant A | 2,775,683 | 671,217 |
| Events in quadrant B | 3,608,769 | 662,646 |
| Events in quadrant C | 2,875,756 | 641,368 |
| Events in quadrant D | 6,933,592 | 588,416 |
| Mode M0 | |||
|---|---|---|---|
| Quadrant | BADHDUFLAG | Total packets | Discarded packets |
| A | 0 | 11262 | 3 |
| B | 0 | 14354 | 2 |
| C | 0 | 11399 | 2 |
| D | 0 | 24143 | 2 |
| Mode SS | |||
|---|---|---|---|
| Quadrant | BADHDUFLAG | Total packets | Discarded packets |
| A | 0 | 102 | 0 |
| B | 0 | 102 | 0 |
| C | 0 | 102 | 0 |
| D | 0 | 102 | 0 |
| Mode M9 | |||
|---|---|---|---|
| Quadrant | BADHDUFLAG | Total packets | Discarded packets |
| A | 0 | 33 | 0 |
| B | 0 | 33 | 0 |
| C | 0 | 33 | 0 |
| D | 0 | 34 | 0 |
| Quadrant | Total seconds | Saturated seconds | Saturation percentage |
|---|---|---|---|
| A | 5044 | 10 | 0.198255% |
| B | 5044 | 95 | 1.883426% |
| C | 5044 | 66 | 1.308485% |
| D | 5044 | 446 | 8.842189% |
Noise dominated data is calculated using 1-second bins in cleaned event files. If a bin has >2000 counts, and if more than 50% of those come from <1% of pixels, then it is considered to be noise-dominated and hence unusable.
| Quadrant | # 1 sec bins | Bins with >0 counts | Bins with >2000 counts | High rate bins dominated by noise | Noise dominated (total time) | Noise dominated (detector-on time) | Marked lightcurve |
|---|---|---|---|---|---|---|---|
| A | 7107 | 5045 | 3 | 3 | 0.04% | 0.06% | 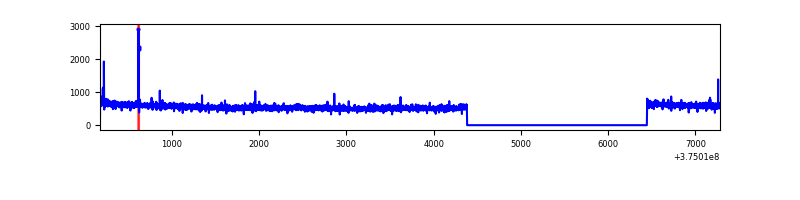 |
| B | 7107 | 5045 | 53 | 53 | 0.75% | 1.05% | 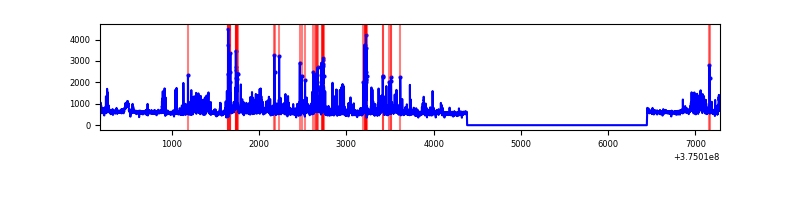 |
| C | 7107 | 5045 | 44 | 44 | 0.62% | 0.87% | 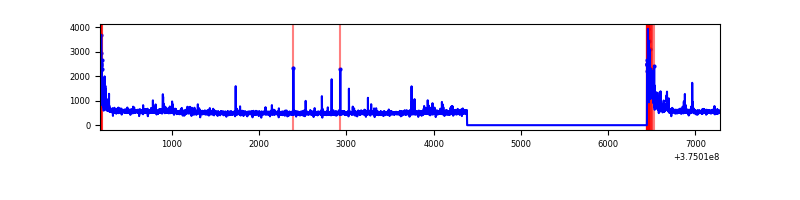 |
| D | 7107 | 5045 | 519 | 519 | 7.30% | 10.29% |  |
Top three noisy pixels from each quadrant. If the there are fewer than three noisy pixels in the level2.evt file, extra rows are filled as -1
| Pixel properties | Quadrant properties | ||||||
|---|---|---|---|---|---|---|---|
| Quadrant | DetID | PixID | Counts | Sigma | Mean | Median | Sigma |
| A | 15 | 47 | 29437 | 208.04 | 703 | 694 | 138.2 |
| A | 14 | 254 | 16282 | 112.82 | 703 | 694 | 138.2 |
| A | 13 | 254 | 8528 | 56.7 | 703 | 694 | 138.2 |
| B | 5 | 172 | 262443 | 2066.34 | 686 | 673 | 126.7 |
| B | 4 | 170 | 156947 | 1233.58 | 686 | 673 | 126.7 |
| B | 0 | 219 | 153044 | 1202.77 | 686 | 673 | 126.7 |
| C | 0 | 10 | 182472 | 1219.83 | 654 | 662 | 149.0 |
| C | 1 | 23 | 55607 | 368.65 | 654 | 662 | 149.0 |
| C | 15 | 208 | 40104 | 264.63 | 654 | 662 | 149.0 |
| D | 8 | 195 | 3289574 | 18800.1 | 653 | 640 | 174.9 |
| D | 10 | 203 | 324989 | 1854.03 | 653 | 640 | 174.9 |
| D | 2 | 250 | 306870 | 1750.46 | 653 | 640 | 174.9 |
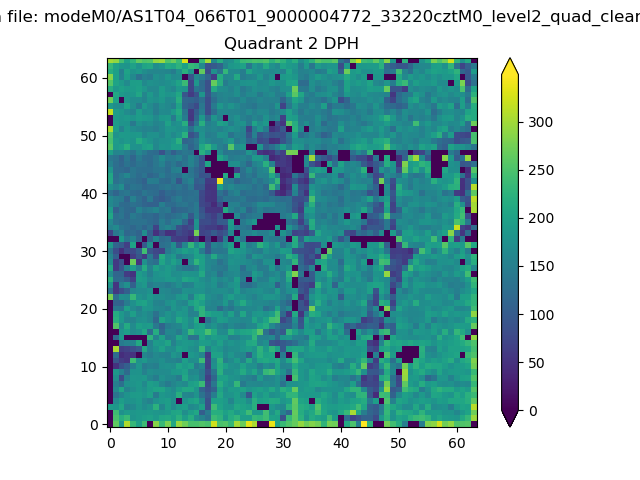
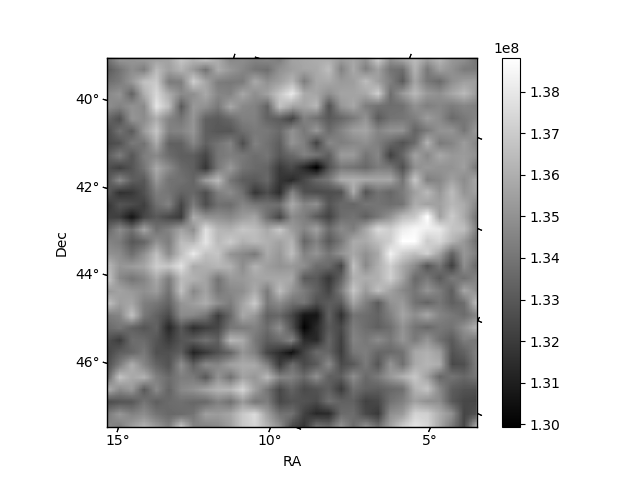
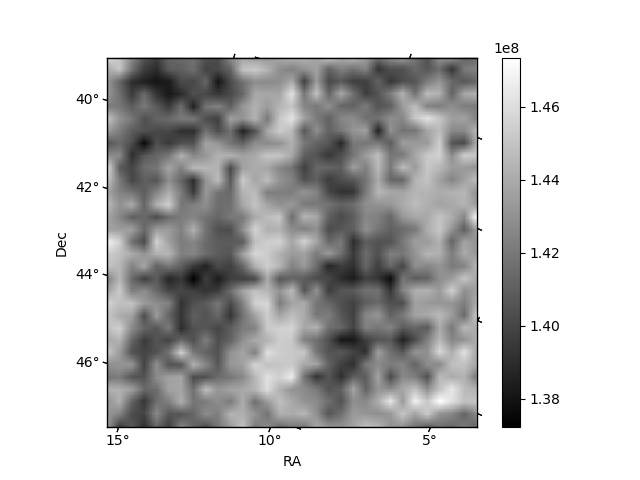
Histogram calculated using DETX and DETY for each event in the final _common_clean file
| Quadrant A |  |
 |
Quadrant B |
|---|---|---|---|
| Quadrant D |  |
 |
Quadrant C |
| Plot type | Count rate plots | Images |
|---|---|---|
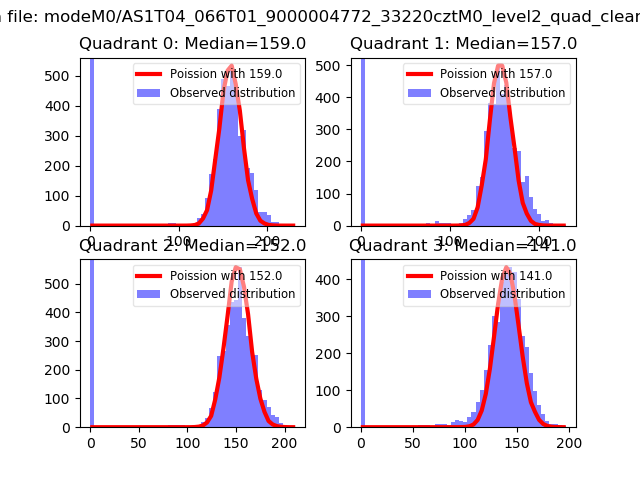
| Comparison with Poisson distribution Blue bars denote a histogram of data divided into 1 sec bins. Red curve is a Poisson curve with rate = median count rate of data. |
 |
 |
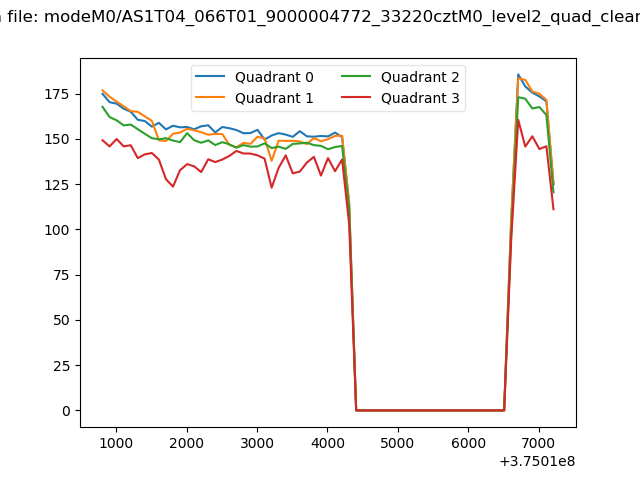
| Quadrant-wise count rates Data is divided into 100 sec bins |
 |
|
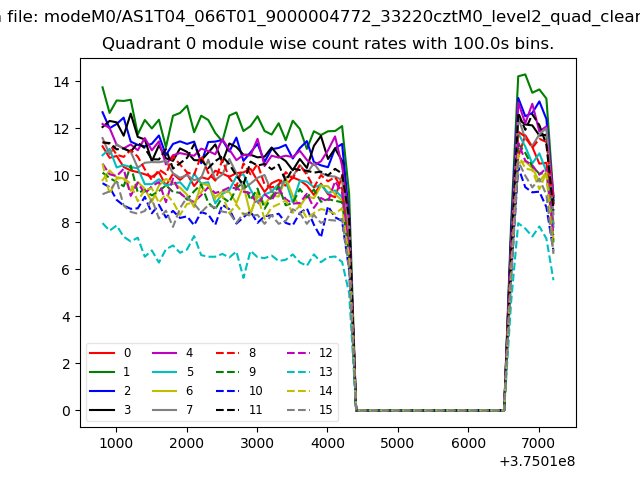
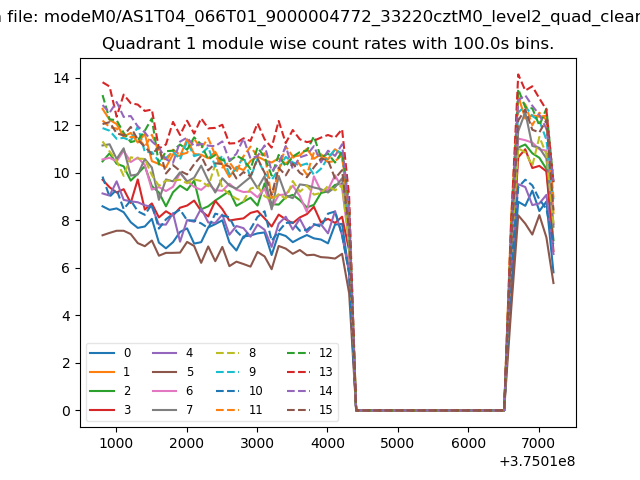
| Module-wise count rates for Quadrant A Data is divided into 100 sec bins |
 |
 |
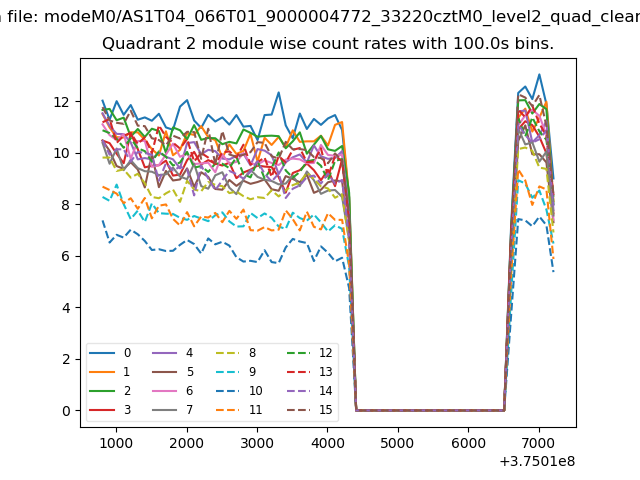
| Module-wise count rates for Quadrant B Data is divided into 100 sec bins |
 |
 |
| Module-wise count rates for Quadrant C Data is divided into 100 sec bins |
 |
 |
| Module-wise count rates for Quadrant D Data is divided into 100 sec bins |
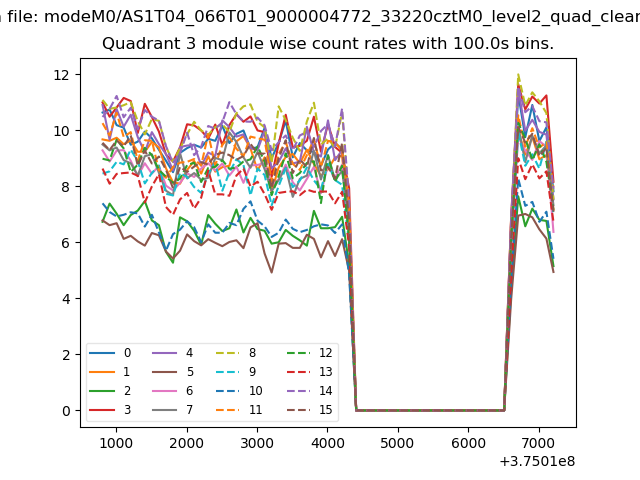 |
 |
| Parameter | Plot |
|---|---|
| CZT HV Monitor | 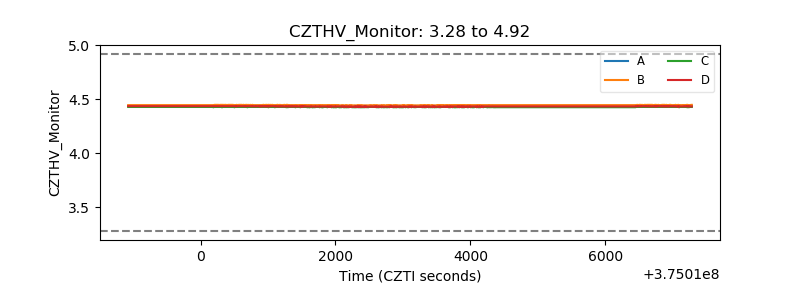 |
| D_VDD | 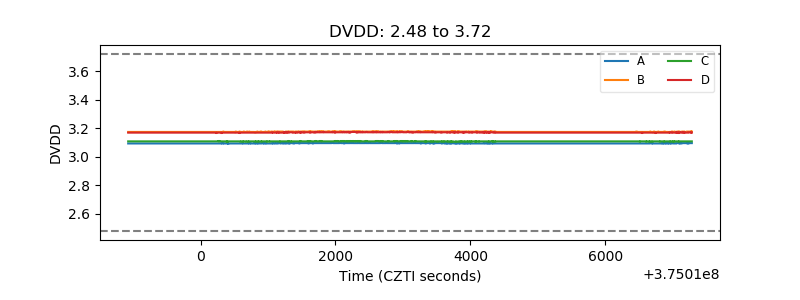 |
| Temperature 1 | 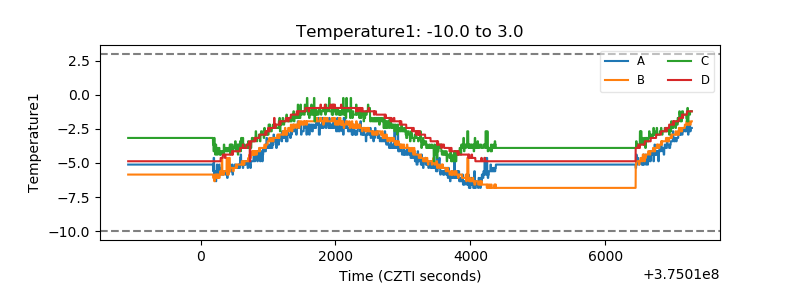 |
| Veto HV Monitor |  |
| Veto LLD | 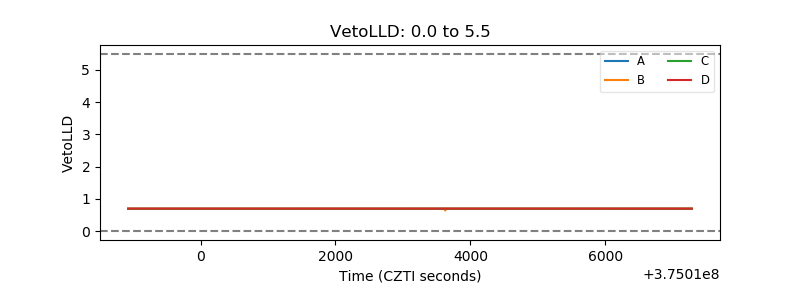 |
| Alpha Counter | 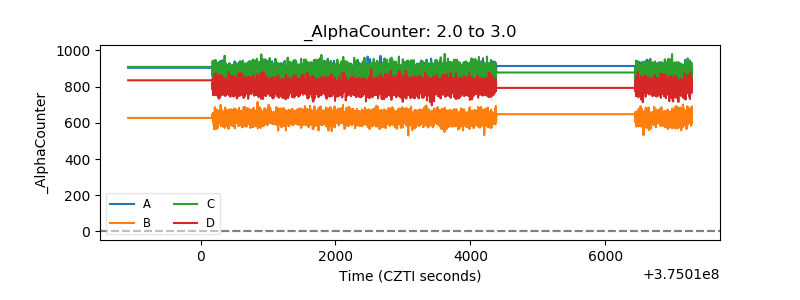 |
| _CPM_Rate | 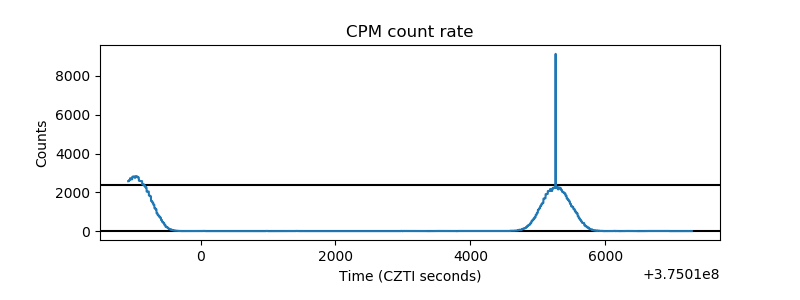 |
| CZT Counter | 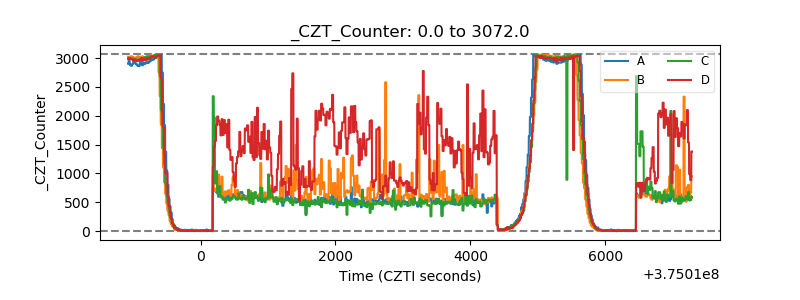 |
| +2.5 Volts monitor |  |
| +5 Volts monitor |  |
| _ROLL_ROT | 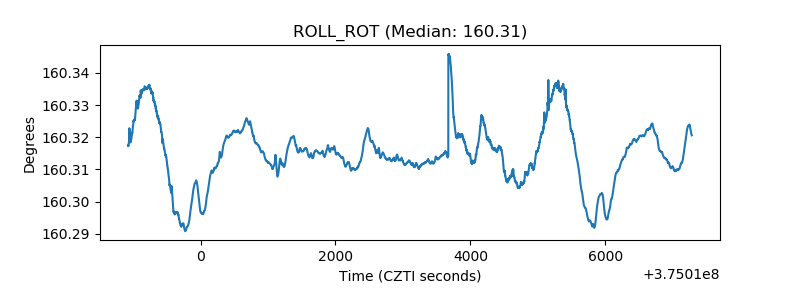 |
| _Roll_DEC | 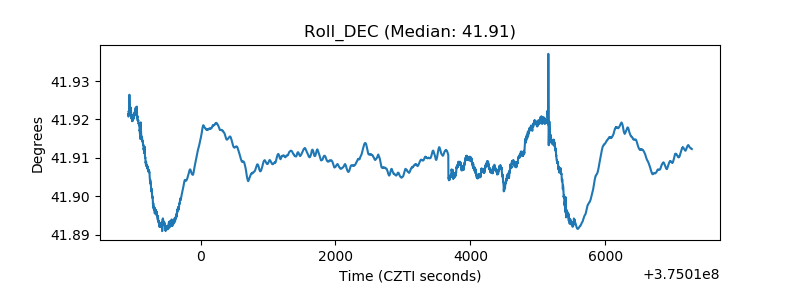 |
| _Roll_RA | 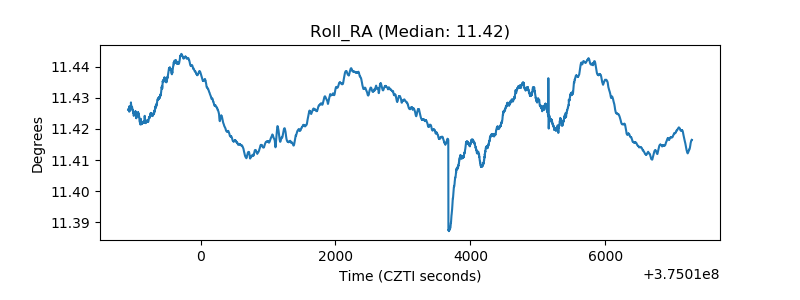 |
| Veto Counter | 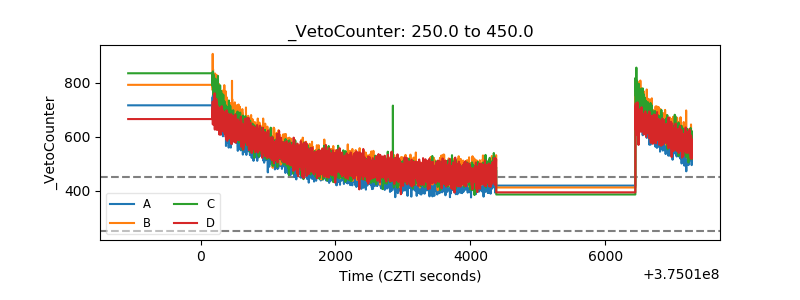 |