| Param | Original file | Final file |
|---|---|---|
| Filename | modeM0/AS1T04_066T01_9000004772_33221cztM0_level2.evt | modeM0/AS1T04_066T01_9000004772_33221cztM0_level2_quad_clean.evt |
| Size (bytes) | 589,003,200 | 102,363,840 |
| Size | 561.7 MB | 97.6 MB |
| Events in quadrant A | 2,654,443 | 731,690 |
| Events in quadrant B | 4,403,856 | 701,264 |
| Events in quadrant C | 2,867,231 | 694,391 |
| Events in quadrant D | 7,577,677 | 624,387 |
| Mode M0 | |||
|---|---|---|---|
| Quadrant | BADHDUFLAG | Total packets | Discarded packets |
| A | 0 | 10727 | 3 |
| B | 0 | 16783 | 2 |
| C | 0 | 11329 | 2 |
| D | 0 | 25966 | 2 |
| Mode SS | |||
|---|---|---|---|
| Quadrant | BADHDUFLAG | Total packets | Discarded packets |
| A | 0 | 102 | 0 |
| B | 0 | 102 | 0 |
| C | 0 | 102 | 0 |
| D | 0 | 102 | 0 |
| Mode M9 | |||
|---|---|---|---|
| Quadrant | BADHDUFLAG | Total packets | Discarded packets |
| A | 0 | 31 | 0 |
| B | 0 | 31 | 0 |
| C | 0 | 31 | 0 |
| D | 0 | 32 | 0 |
| Quadrant | Total seconds | Saturated seconds | Saturation percentage |
|---|---|---|---|
| A | 4961 | 9 | 0.181415% |
| B | 4961 | 302 | 6.087482% |
| C | 4961 | 61 | 1.229591% |
| D | 4961 | 920 | 18.544648% |
Noise dominated data is calculated using 1-second bins in cleaned event files. If a bin has >2000 counts, and if more than 50% of those come from <1% of pixels, then it is considered to be noise-dominated and hence unusable.
| Quadrant | # 1 sec bins | Bins with >0 counts | Bins with >2000 counts | High rate bins dominated by noise | Noise dominated (total time) | Noise dominated (detector-on time) | Marked lightcurve |
|---|---|---|---|---|---|---|---|
| A | 7083 | 4962 | 0 | 0 | 0.00% | 0.00% | 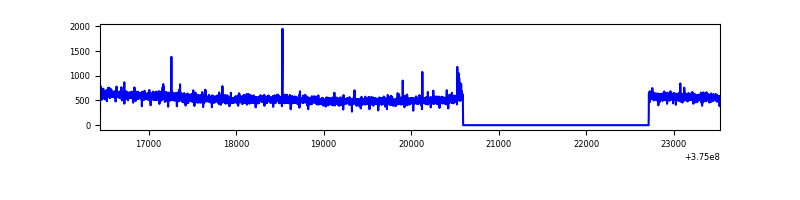 |
| B | 7083 | 4962 | 205 | 205 | 2.89% | 4.13% | 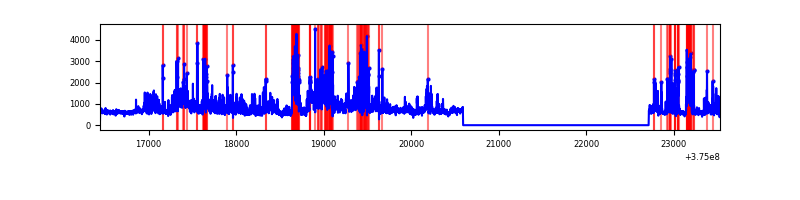 |
| C | 7083 | 4962 | 43 | 43 | 0.61% | 0.87% | 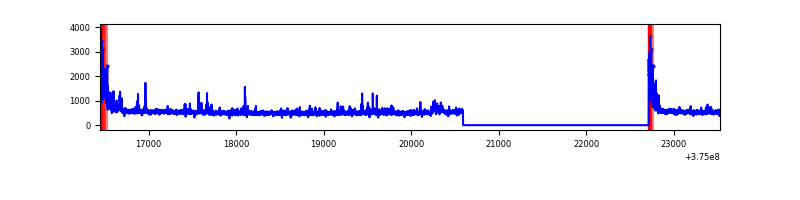 |
| D | 7083 | 4962 | 1116 | 1116 | 15.76% | 22.49% | 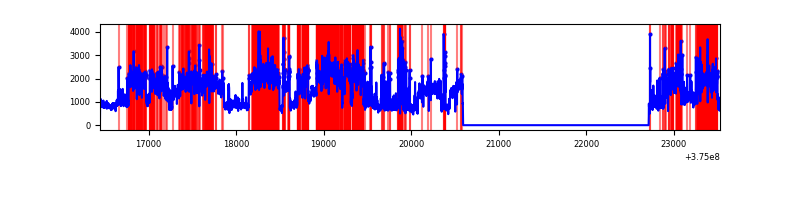 |
Top three noisy pixels from each quadrant. If the there are fewer than three noisy pixels in the level2.evt file, extra rows are filled as -1
| Pixel properties | Quadrant properties | ||||||
|---|---|---|---|---|---|---|---|
| Quadrant | DetID | PixID | Counts | Sigma | Mean | Median | Sigma |
| A | 15 | 47 | 23423 | 171.29 | 676 | 666 | 132.9 |
| A | 13 | 6 | 9872 | 69.29 | 676 | 666 | 132.9 |
| A | 14 | 254 | 9554 | 66.9 | 676 | 666 | 132.9 |
| B | 4 | 170 | 858011 | 7052.75 | 649 | 636 | 121.6 |
| B | 5 | 172 | 526903 | 4329.06 | 649 | 636 | 121.6 |
| B | 0 | 219 | 158915 | 1302.0 | 649 | 636 | 121.6 |
| C | 0 | 10 | 210535 | 1460.16 | 634 | 642 | 143.7 |
| C | 10 | 49 | 82609 | 570.22 | 634 | 642 | 143.7 |
| C | 1 | 23 | 61082 | 420.46 | 634 | 642 | 143.7 |
| D | 8 | 195 | 4096172 | 24617.91 | 625 | 612 | 166.4 |
| D | 2 | 250 | 331222 | 1987.26 | 625 | 612 | 166.4 |
| D | 10 | 203 | 298799 | 1792.37 | 625 | 612 | 166.4 |
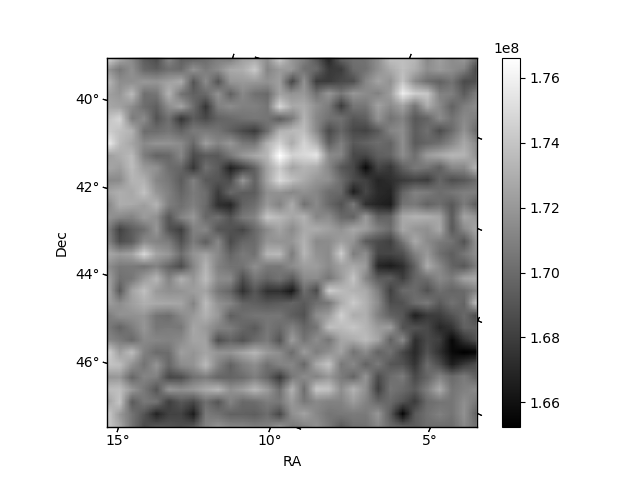
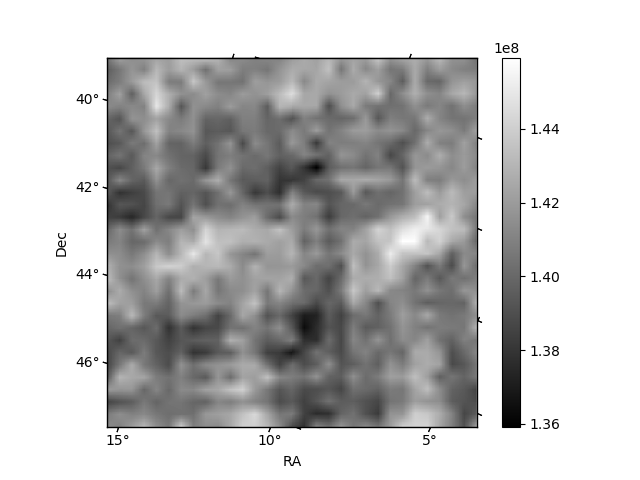
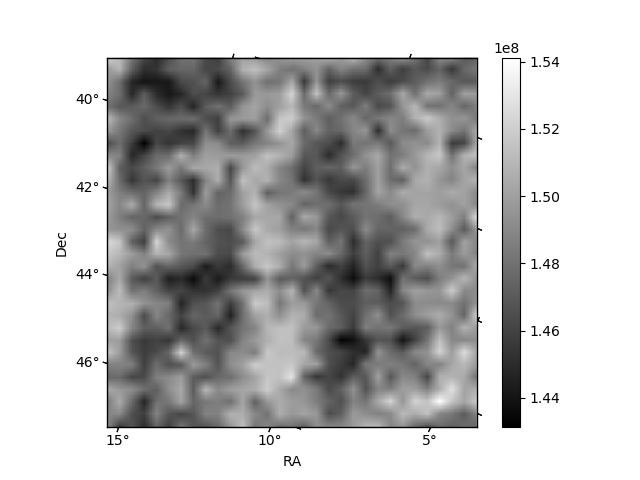
Histogram calculated using DETX and DETY for each event in the final _common_clean file
| Quadrant A | 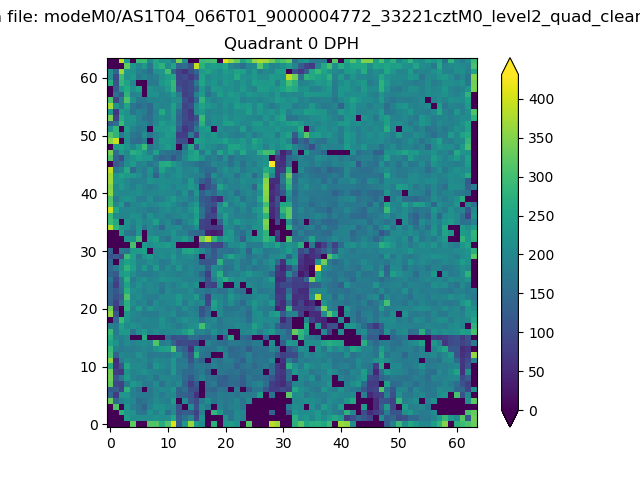 |
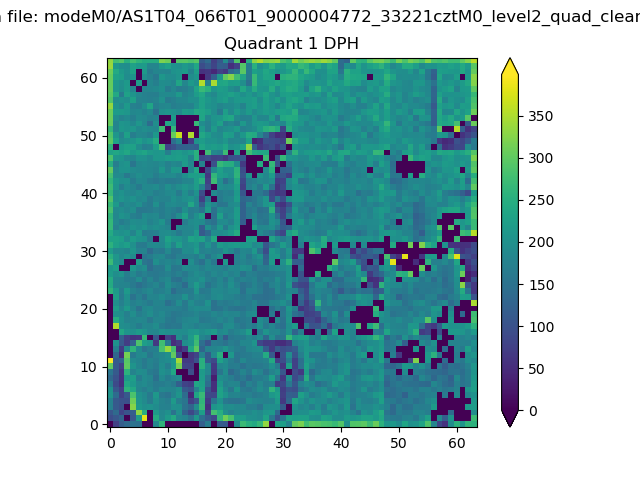 |
Quadrant B |
|---|---|---|---|
| Quadrant D | 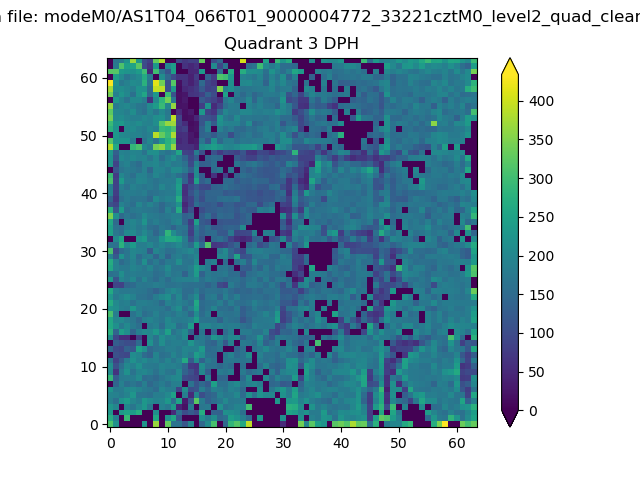 |
 |
Quadrant C |
| Plot type | Count rate plots | Images |
|---|---|---|
| Comparison with Poisson distribution Blue bars denote a histogram of data divided into 1 sec bins. Red curve is a Poisson curve with rate = median count rate of data. |
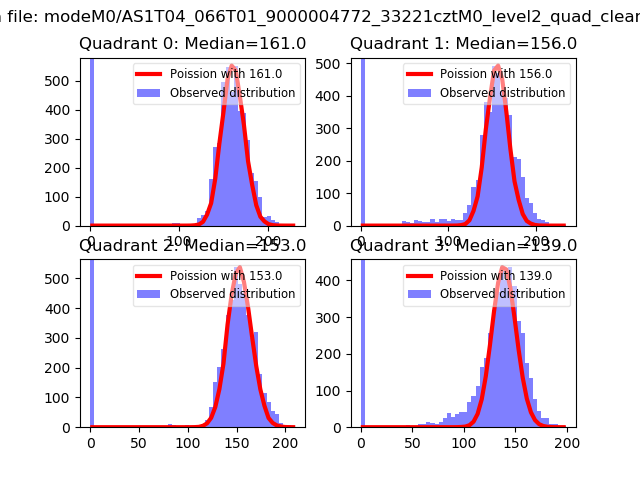 |
 |
| Quadrant-wise count rates Data is divided into 100 sec bins |
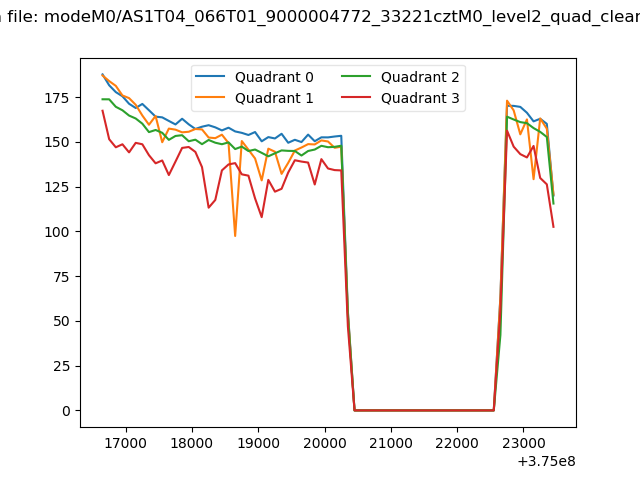 |
|
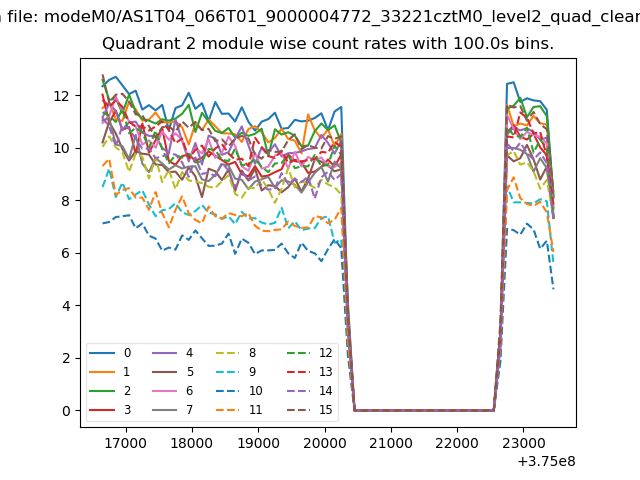
| Module-wise count rates for Quadrant A Data is divided into 100 sec bins |
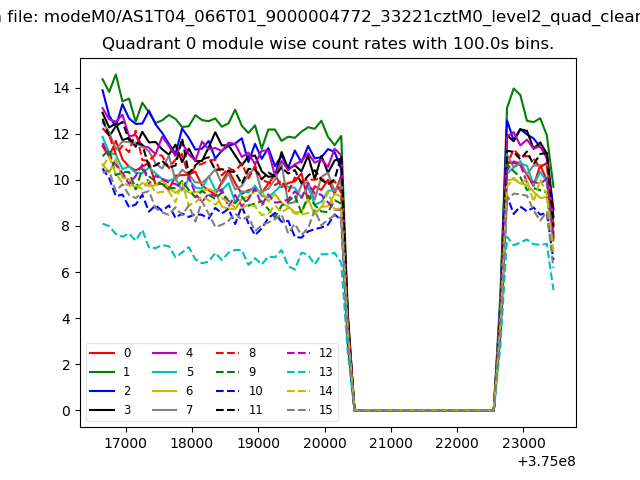 |
 |
| Module-wise count rates for Quadrant B Data is divided into 100 sec bins |
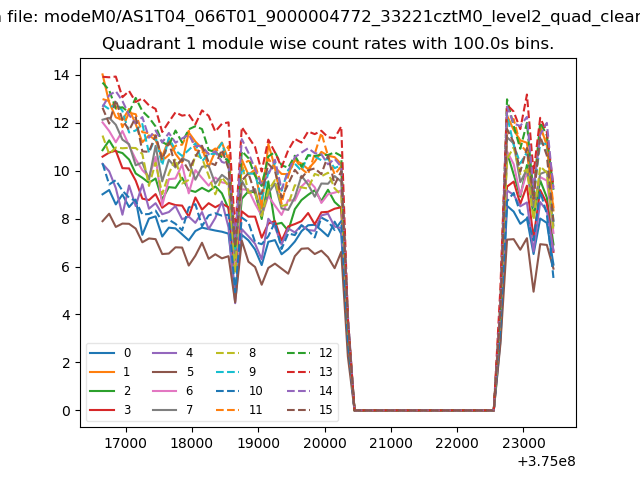 |
 |
| Module-wise count rates for Quadrant C Data is divided into 100 sec bins |
 |
 |
| Module-wise count rates for Quadrant D Data is divided into 100 sec bins |
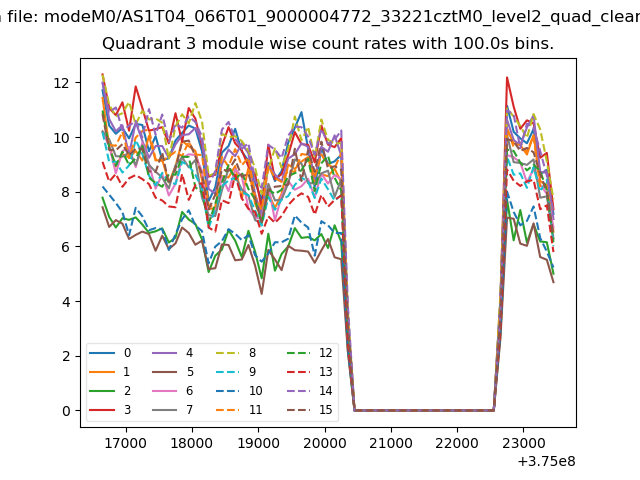 |
 |
| Parameter | Plot |
|---|---|
| CZT HV Monitor | 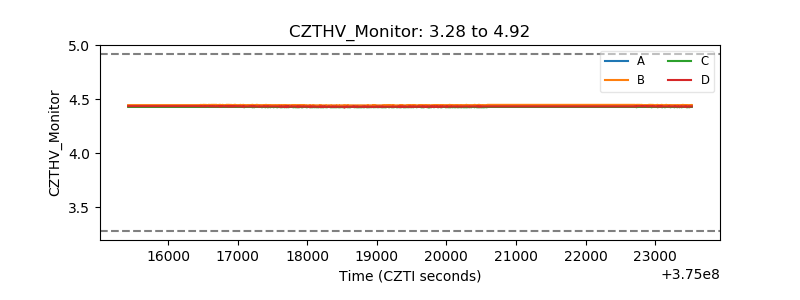 |
| D_VDD | 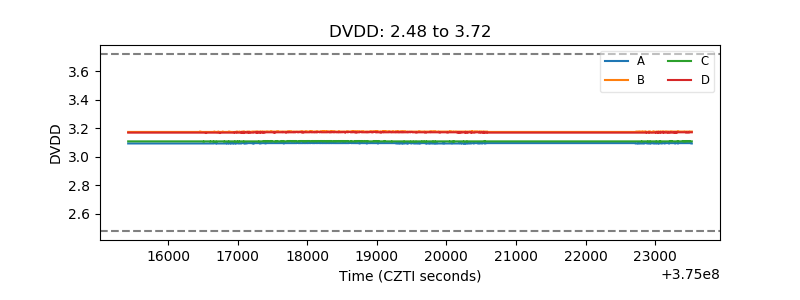 |
| Temperature 1 | 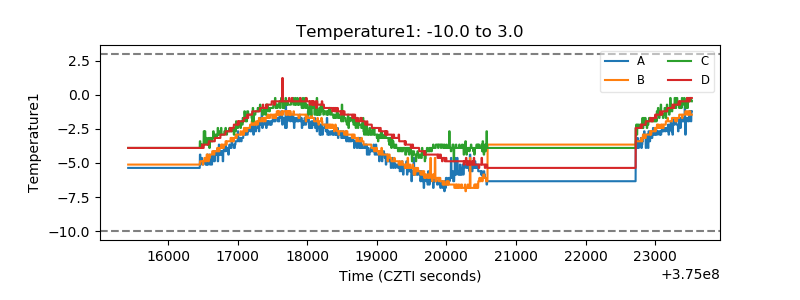 |
| Veto HV Monitor | 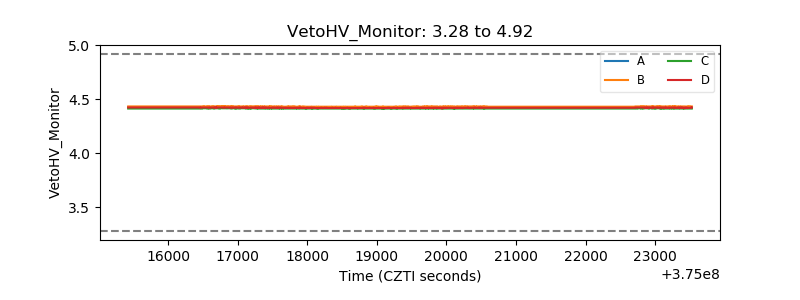 |
| Veto LLD | 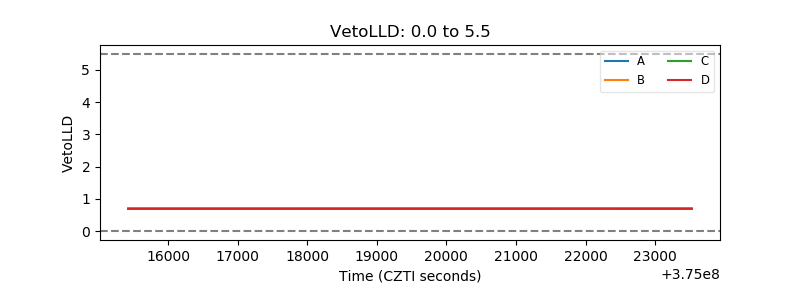 |
| Alpha Counter | 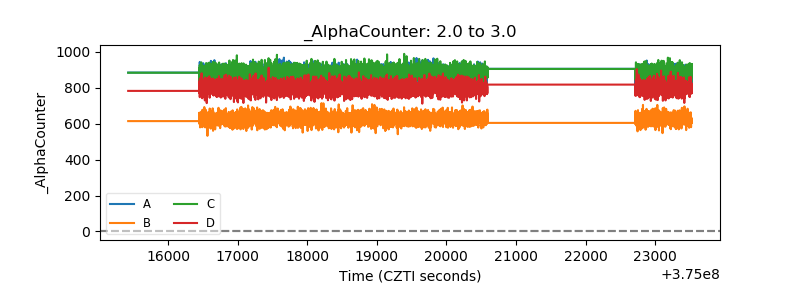 |
| _CPM_Rate | 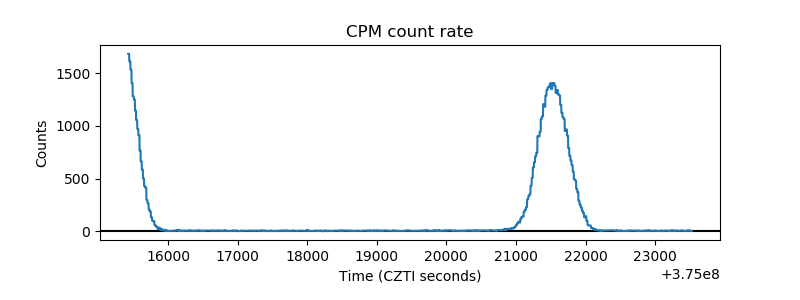 |
| CZT Counter | 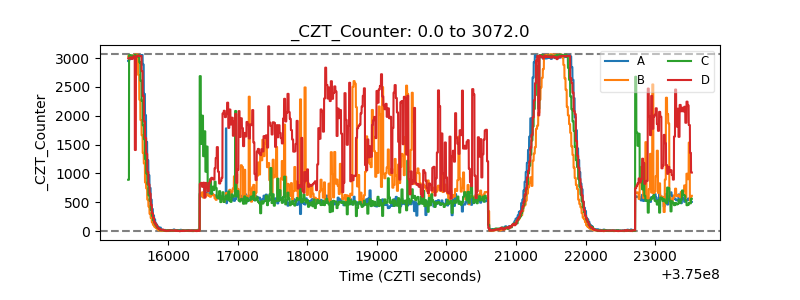 |
| +2.5 Volts monitor |  |
| +5 Volts monitor |  |
| _ROLL_ROT | 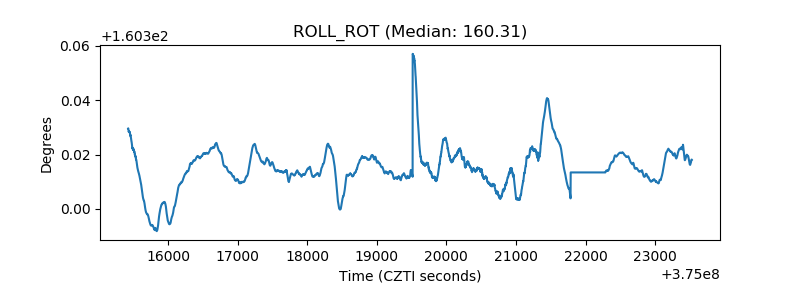 |
| _Roll_DEC | 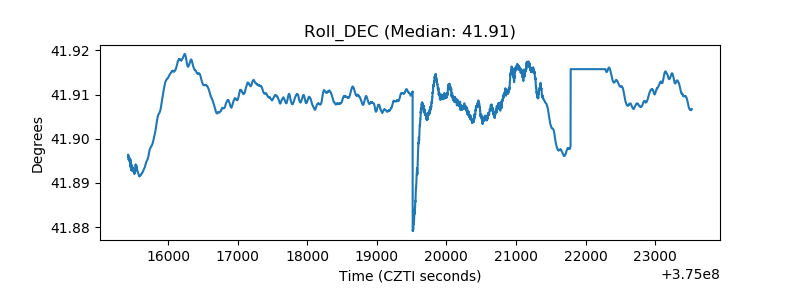 |
| _Roll_RA |  |
| Veto Counter | 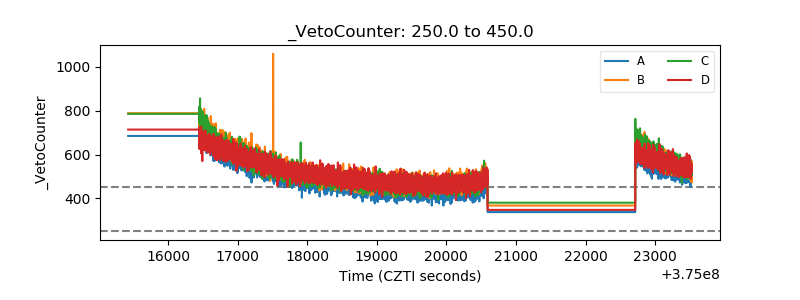 |