| Param | Original file | Final file |
|---|---|---|
| Filename | modeM0/AS1T04_066T01_9000004772_33222cztM0_level2.evt | modeM0/AS1T04_066T01_9000004772_33222cztM0_level2_quad_clean.evt |
| Size (bytes) | 267,289,920 | 45,368,640 |
| Size | 254.9 MB | 43.3 MB |
| Events in quadrant A | 1,127,120 | 329,162 |
| Events in quadrant B | 2,055,212 | 306,925 |
| Events in quadrant C | 1,187,870 | 312,620 |
| Events in quadrant D | 3,581,368 | 273,073 |
| Mode M0 | |||
|---|---|---|---|
| Quadrant | BADHDUFLAG | Total packets | Discarded packets |
| A | 0 | 4472 | 1 |
| B | 0 | 7537 | 1 |
| C | 0 | 4740 | 1 |
| D | 0 | 12082 | 1 |
| Mode SS | |||
|---|---|---|---|
| Quadrant | BADHDUFLAG | Total packets | Discarded packets |
| A | 0 | 42 | 0 |
| B | 0 | 42 | 0 |
| C | 0 | 42 | 0 |
| D | 0 | 42 | 0 |
| Mode M9 | |||
|---|---|---|---|
| Quadrant | BADHDUFLAG | Total packets | Discarded packets |
| A | 0 | 3 | 0 |
| B | 0 | 3 | 0 |
| C | 0 | 3 | 0 |
| D | 0 | 4 | 0 |
| Quadrant | Total seconds | Saturated seconds | Saturation percentage |
|---|---|---|---|
| A | 2090 | 5 | 0.239234% |
| B | 2090 | 271 | 12.966507% |
| C | 2090 | 32 | 1.531100% |
| D | 2090 | 702 | 33.588517% |
Noise dominated data is calculated using 1-second bins in cleaned event files. If a bin has >2000 counts, and if more than 50% of those come from <1% of pixels, then it is considered to be noise-dominated and hence unusable.
| Quadrant | # 1 sec bins | Bins with >0 counts | Bins with >2000 counts | High rate bins dominated by noise | Noise dominated (total time) | Noise dominated (detector-on time) | Marked lightcurve |
|---|---|---|---|---|---|---|---|
| A | 2090 | 2090 | 1 | 1 | 0.05% | 0.05% | 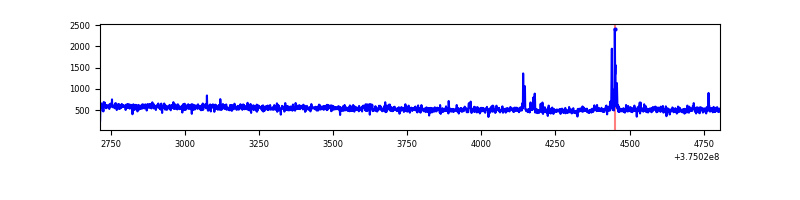 |
| B | 2090 | 2090 | 199 | 199 | 9.52% | 9.52% | 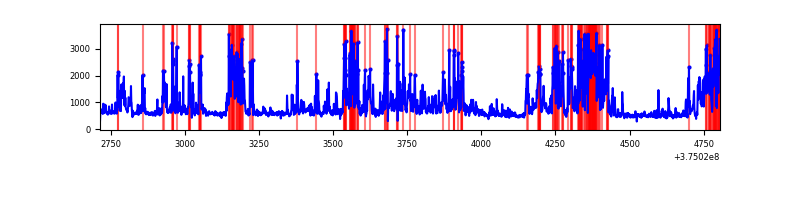 |
| C | 2090 | 2090 | 25 | 25 | 1.20% | 1.20% | 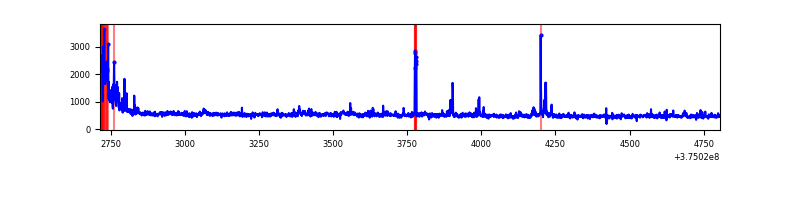 |
| D | 2090 | 2090 | 781 | 781 | 37.37% | 37.37% | 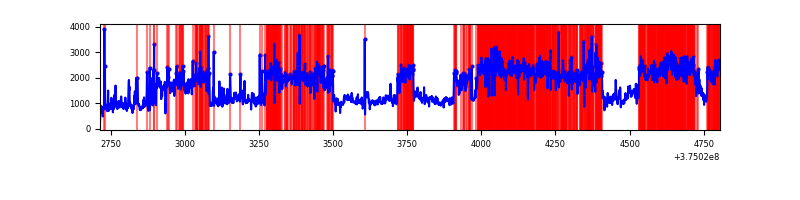 |
Top three noisy pixels from each quadrant. If the there are fewer than three noisy pixels in the level2.evt file, extra rows are filled as -1
| Pixel properties | Quadrant properties | ||||||
|---|---|---|---|---|---|---|---|
| Quadrant | DetID | PixID | Counts | Sigma | Mean | Median | Sigma |
| A | 14 | 254 | 21120 | 364.39 | 280 | 275 | 57.2 |
| A | 15 | 47 | 13147 | 225.01 | 280 | 275 | 57.2 |
| A | 13 | 6 | 6801 | 114.08 | 280 | 275 | 57.2 |
| B | 5 | 172 | 732691 | 14692.94 | 259 | 254 | 49.8 |
| B | 4 | 170 | 196665 | 3940.07 | 259 | 254 | 49.8 |
| B | 0 | 190 | 24433 | 485.04 | 259 | 254 | 49.8 |
| C | 0 | 10 | 94563 | 1563.52 | 261 | 264 | 60.3 |
| C | 14 | 254 | 23385 | 383.36 | 261 | 264 | 60.3 |
| C | 9 | 187 | 18141 | 296.41 | 261 | 264 | 60.3 |
| D | 8 | 195 | 2014815 | 29227.26 | 253 | 246 | 68.9 |
| D | 2 | 249 | 120898 | 1750.41 | 253 | 246 | 68.9 |
| D | 12 | 218 | 114869 | 1662.94 | 253 | 246 | 68.9 |
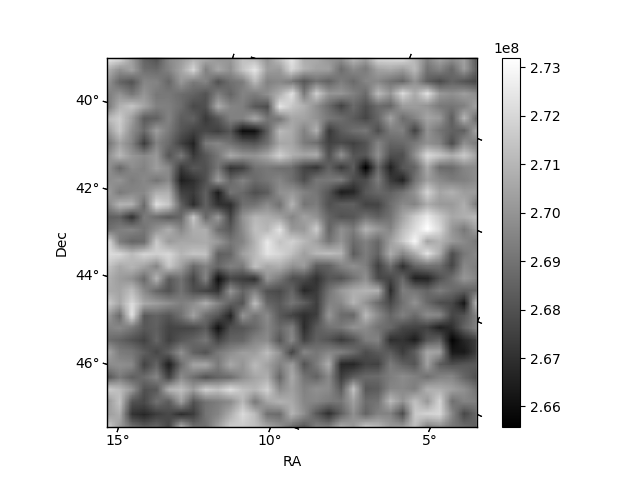
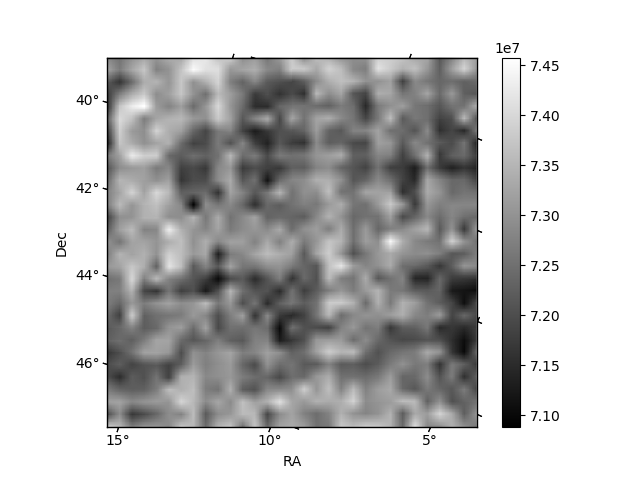
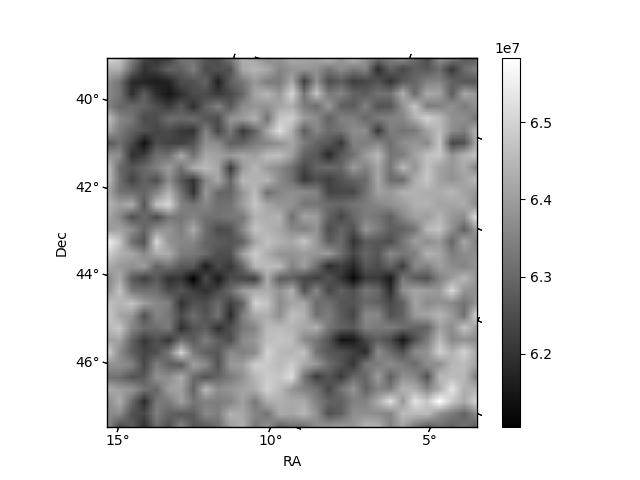
Histogram calculated using DETX and DETY for each event in the final _common_clean file
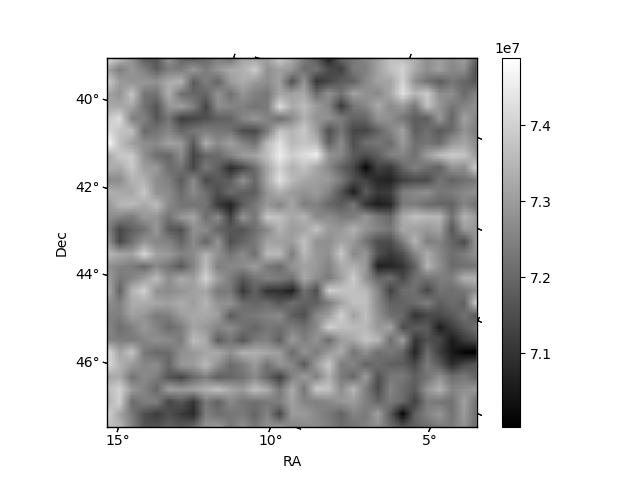
| Quadrant A | 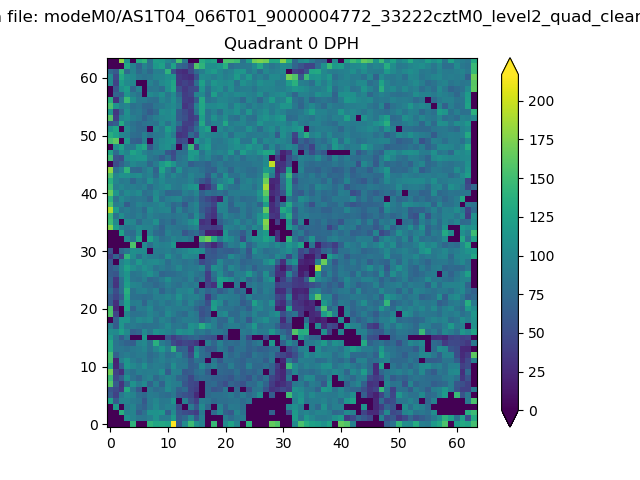 |
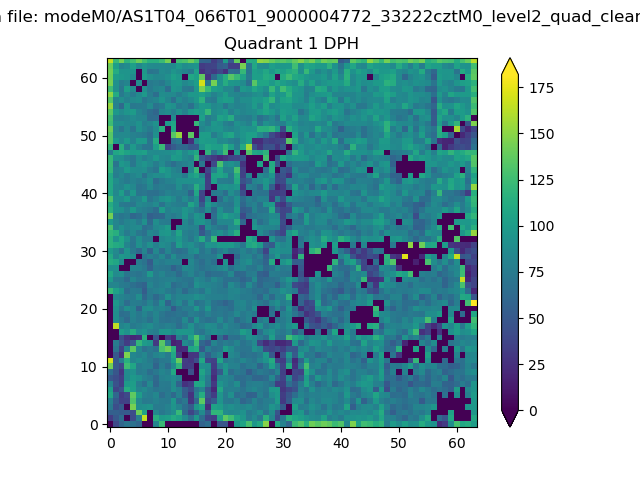 |
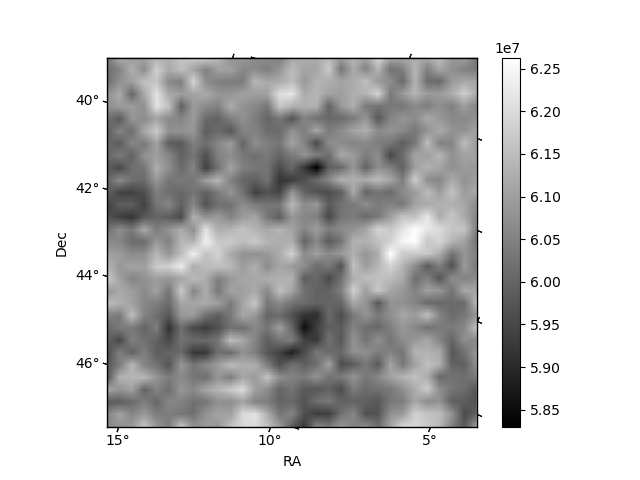
Quadrant B |
|---|---|---|---|
| Quadrant D | 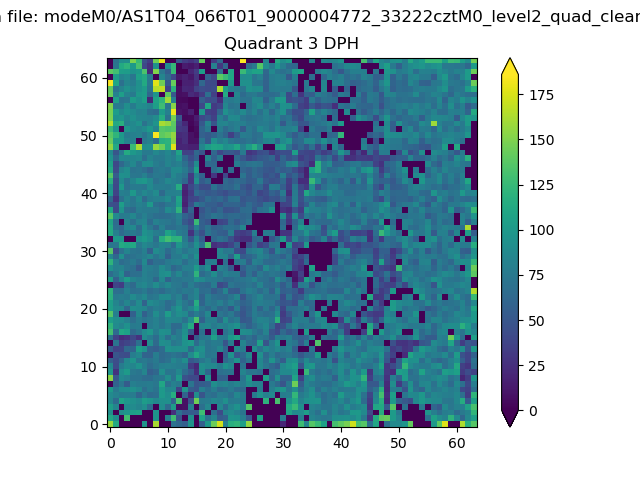 |
 |
Quadrant C |
| Plot type | Count rate plots | Images |
|---|---|---|
| Comparison with Poisson distribution Blue bars denote a histogram of data divided into 1 sec bins. Red curve is a Poisson curve with rate = median count rate of data. |
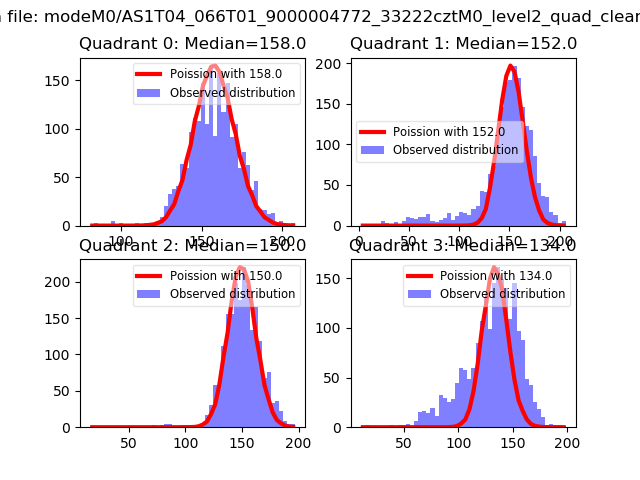 |
 |
| Quadrant-wise count rates Data is divided into 100 sec bins |
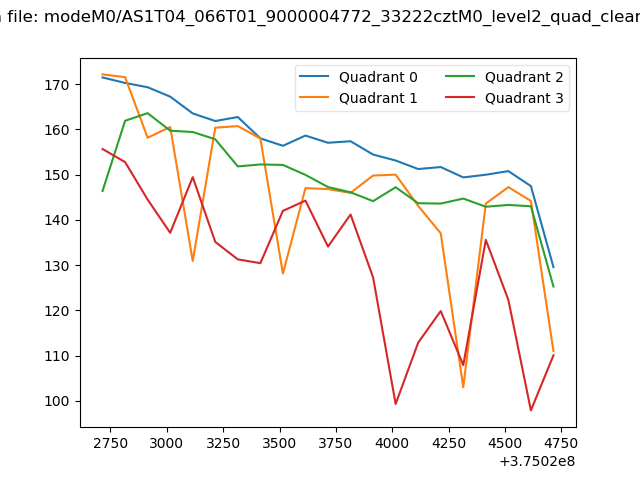 |
|
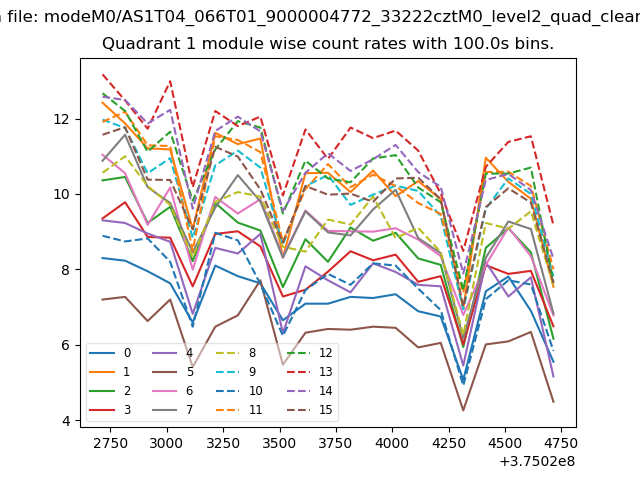
| Module-wise count rates for Quadrant A Data is divided into 100 sec bins |
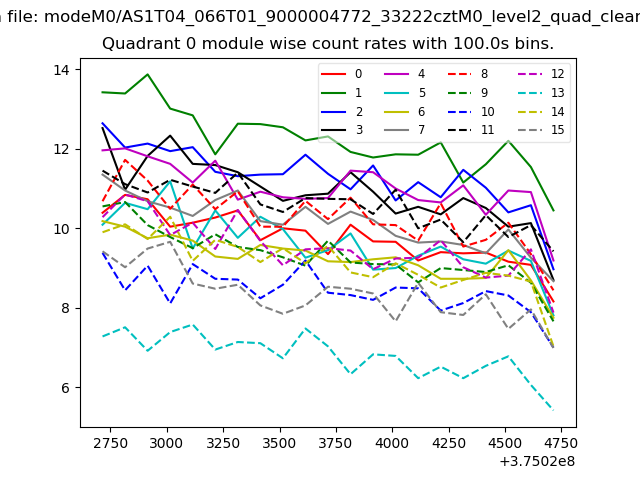 |
 |
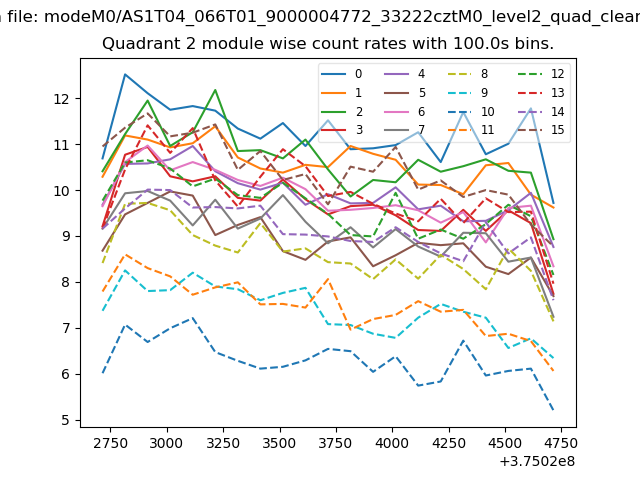
| Module-wise count rates for Quadrant B Data is divided into 100 sec bins |
 |
 |
| Module-wise count rates for Quadrant C Data is divided into 100 sec bins |
 |
 |
| Module-wise count rates for Quadrant D Data is divided into 100 sec bins |
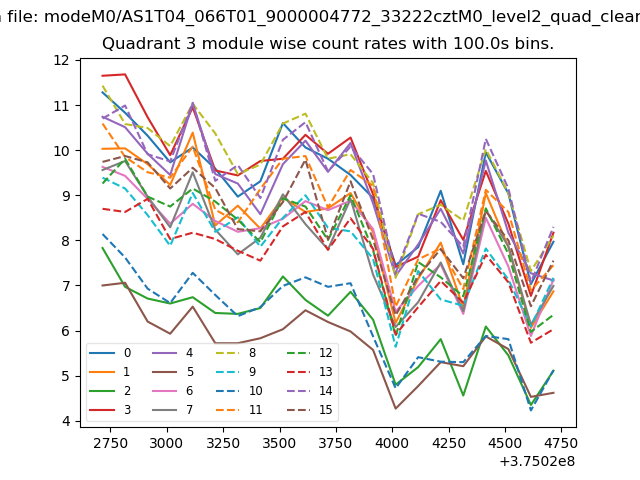 |
 |
| Parameter | Plot |
|---|---|
| CZT HV Monitor | 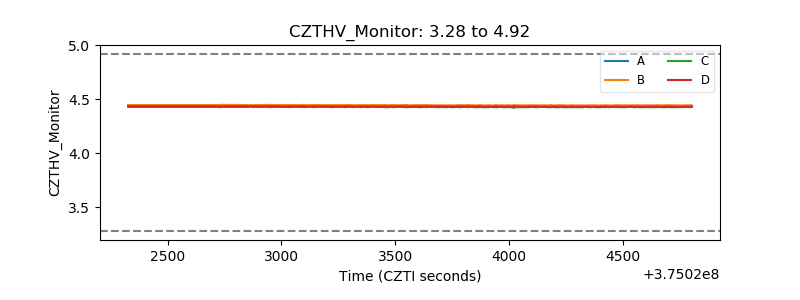 |
| D_VDD | 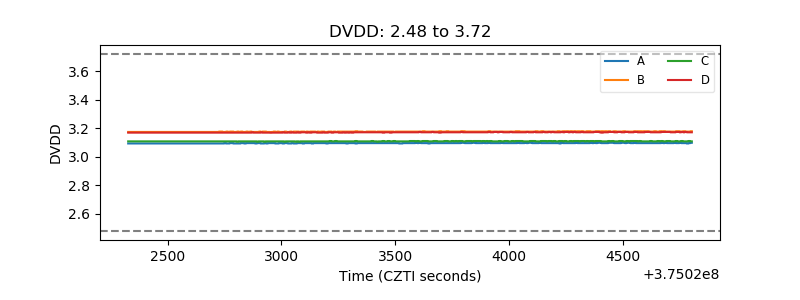 |
| Temperature 1 | 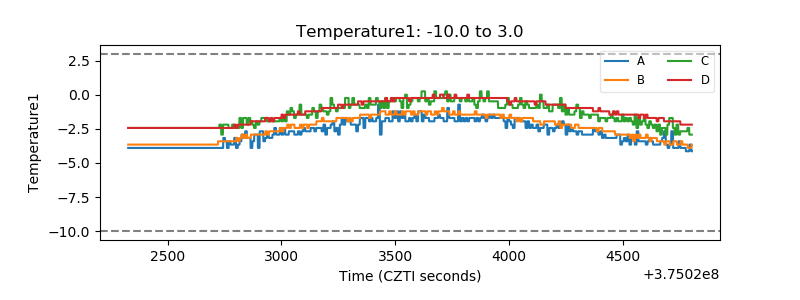 |
| Veto HV Monitor |  |
| Veto LLD | 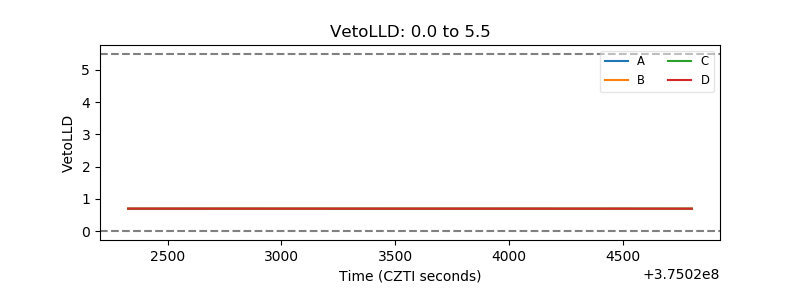 |
| Alpha Counter | 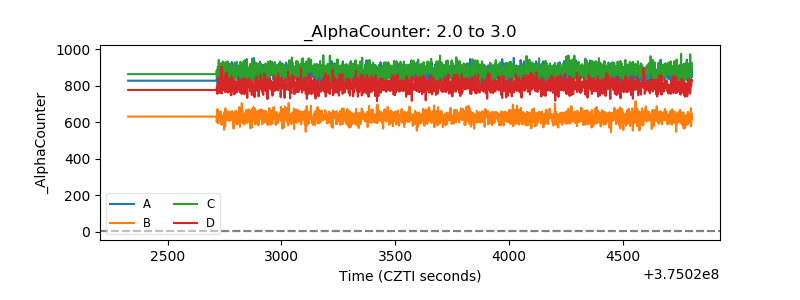 |
| _CPM_Rate |  |
| CZT Counter | 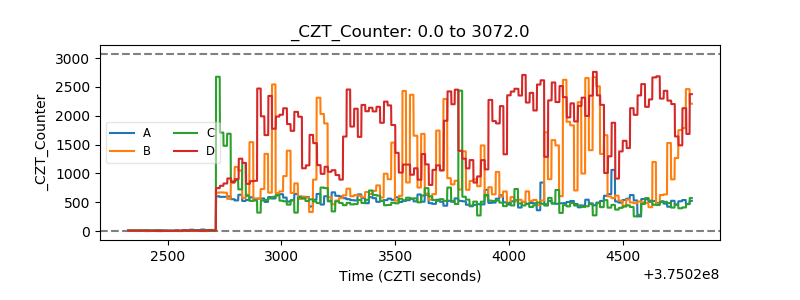 |
| +2.5 Volts monitor |  |
| +5 Volts monitor | 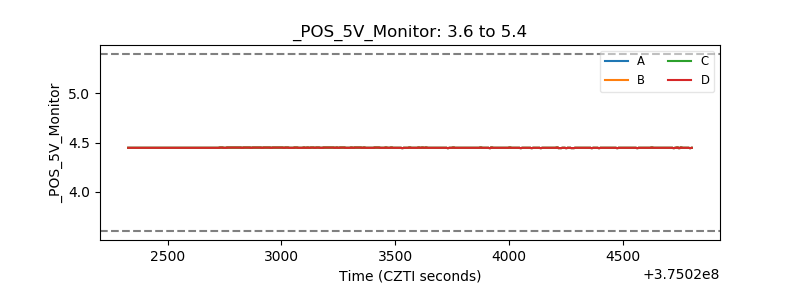 |
| _ROLL_ROT | 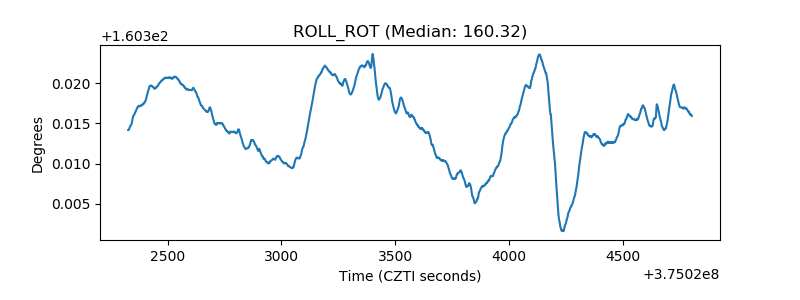 |
| _Roll_DEC | 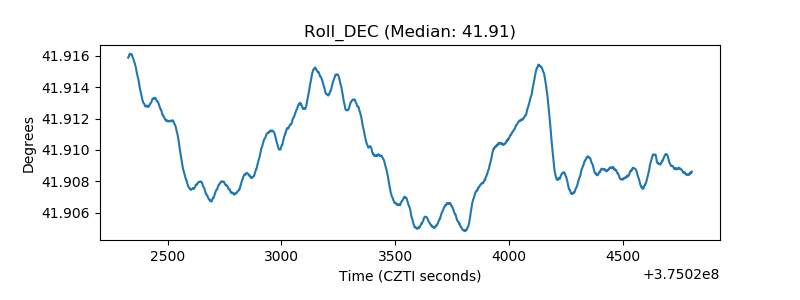 |
| _Roll_RA | 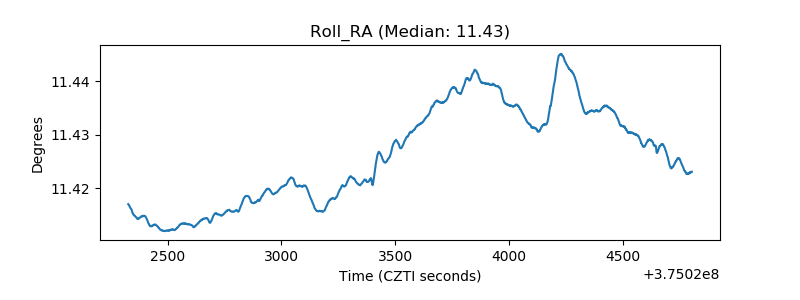 |
| Veto Counter | 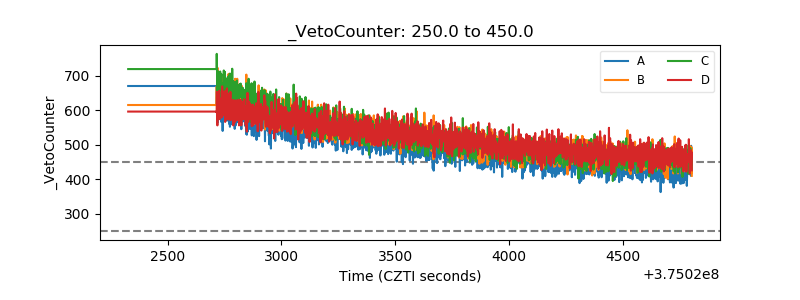 |