| Param | Original file | Final file |
|---|---|---|
| Filename | modeM0/AS1A10_067T01_9000004774cztM0_level2.fits | modeM0/AS1A10_067T01_9000004774cztM0_level2_quad_clean.evt |
| Size (bytes) | 870,229,440 | 841,844,160 |
| Size | 829.9 MB | 802.8 MB |
| Events in quadrant A | 5,311,960 | 4,929,053 |
| Events in quadrant B | 5,093,522 | 5,298,794 |
| Events in quadrant C | 5,405,666 | 5,148,503 |
| Events in quadrant D | 4,202,648 | 3,791,803 |
| Mode M9 | |||
|---|---|---|---|
| Quadrant | BADHDUFLAG | Total packets | Discarded packets |
| A | 0 | 338 | 0 |
| B | 0 | 338 | 0 |
| C | 0 | 338 | 0 |
| D | 0 | 338 | 0 |
| Mode SS | |||
|---|---|---|---|
| Quadrant | BADHDUFLAG | Total packets | Discarded packets |
| A | 0 | 1884 | 0 |
| B | 0 | 1884 | 0 |
| C | 0 | 1884 | 0 |
| D | 0 | 1884 | 0 |
| Mode M0 | |||
|---|---|---|---|
| Quadrant | BADHDUFLAG | Total packets | Discarded packets |
| A | 0 | 257038 | 0 |
| B | 0 | 276495 | 0 |
| C | 0 | 214674 | 0 |
| D | 0 | 425917 | 0 |
| Quadrant | Total seconds | Saturated seconds | Saturation percentage |
|---|---|---|---|
| A | 92284 | 10633 | 11.522041% |
| B | 92284 | 7034 | 7.622123% |
| C | 92284 | 1551 | 1.680681% |
| D | 92284 | 18272 | 19.799749% |
Noise dominated data is calculated using 1-second bins in cleaned event files. If a bin has >2000 counts, and if more than 50% of those come from <1% of pixels, then it is considered to be noise-dominated and hence unusable.
| Quadrant | # 1 sec bins | Bins with >0 counts | Bins with >2000 counts | High rate bins dominated by noise | Noise dominated (total time) | Noise dominated (detector-on time) | Marked lightcurve |
|---|---|---|---|---|---|---|---|
| A | 126071 | 92255 | 0 | 0 | 0.00% | 0.00% |  |
| B | 126071 | 92102 | 0 | 0 | 0.00% | 0.00% | 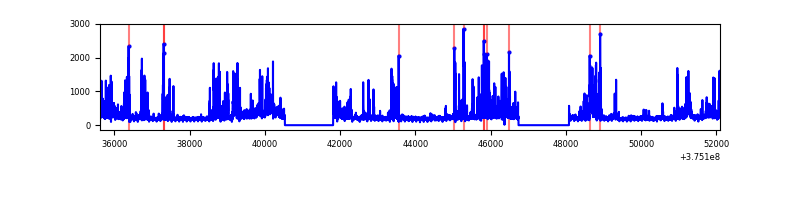 |
| C | 126071 | 92267 | 0 | 0 | 0.00% | 0.00% |  |
| D | 126068 | 91531 | 0 | 0 | 0.00% | 0.00% |  |
Top three noisy pixels from each quadrant. If the there are fewer than three noisy pixels in the level2.evt file, extra rows are filled as -1
| Pixel properties | Quadrant properties | ||||||
|---|---|---|---|---|---|---|---|
| Quadrant | DetID | PixID | Counts | Sigma | Mean | Median | Sigma |
| A | 9 | 19 | 4334 | 8.99 | 1387 | 1307 | 336.8 |
| A | 0 | 29 | 4298 | 8.88 | 1387 | 1307 | 336.8 |
| A | 7 | 110 | 4293 | 8.87 | 1387 | 1307 | 336.8 |
| B | 2 | 9 | 4391 | 11.62 | 1352 | 1292 | 266.6 |
| B | 3 | 80 | 4029 | 10.27 | 1352 | 1292 | 266.6 |
| B | 2 | 8 | 3593 | 8.63 | 1352 | 1292 | 266.6 |
| C | 1 | 81 | 4517 | 8.84 | 1432 | 1353 | 358.1 |
| C | 1 | 80 | 4369 | 8.42 | 1432 | 1353 | 358.1 |
| C | 1 | 65 | 3625 | 6.34 | 1432 | 1353 | 358.1 |
| D | 10 | 113 | 3152 | 6.39 | 1206 | 1107 | 319.9 |
| D | 7 | 3 | 3103 | 6.24 | 1206 | 1107 | 319.9 |
| D | 10 | 189 | 3089 | 6.2 | 1206 | 1107 | 319.9 |
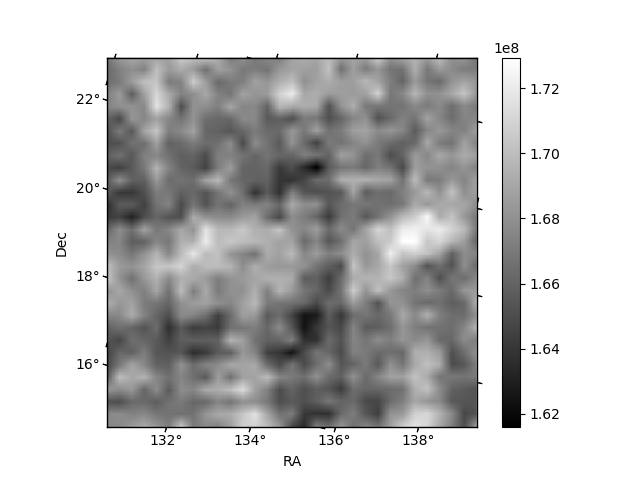
Histogram calculated using DETX and DETY for each event in the final _common_clean file
| Quadrant A | 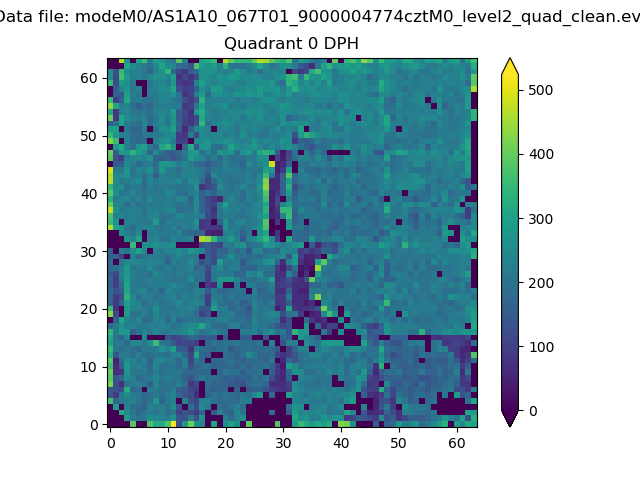 |
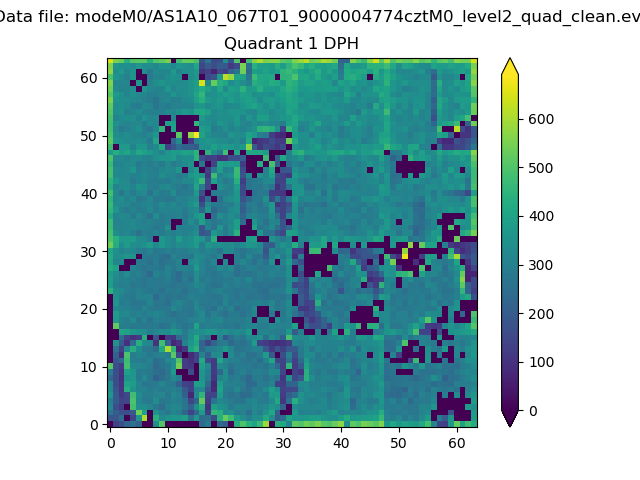 |
Quadrant B |
|---|---|---|---|
| Quadrant D |  |
 |
Quadrant C |
| Plot type | Count rate plots | Images |
|---|---|---|
| Comparison with Poisson distribution Blue bars denote a histogram of data divided into 1 sec bins. Red curve is a Poisson curve with rate = median count rate of data. |
 |
 |
| Quadrant-wise count rates Data is divided into 100 sec bins |
 |
|
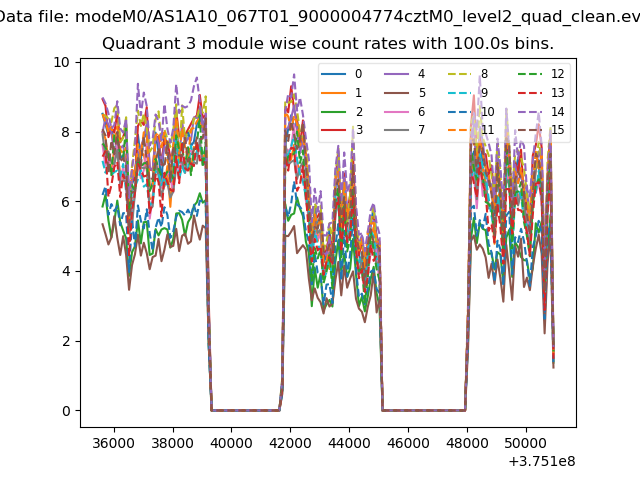
| Module-wise count rates for Quadrant A Data is divided into 100 sec bins |
 |
 |
| Module-wise count rates for Quadrant B Data is divided into 100 sec bins |
 |
 |
| Module-wise count rates for Quadrant C Data is divided into 100 sec bins |
 |
 |
| Module-wise count rates for Quadrant D Data is divided into 100 sec bins |
 |
 |
| Parameter | Plot |
|---|---|
| CZT HV Monitor |  |
| D_VDD | 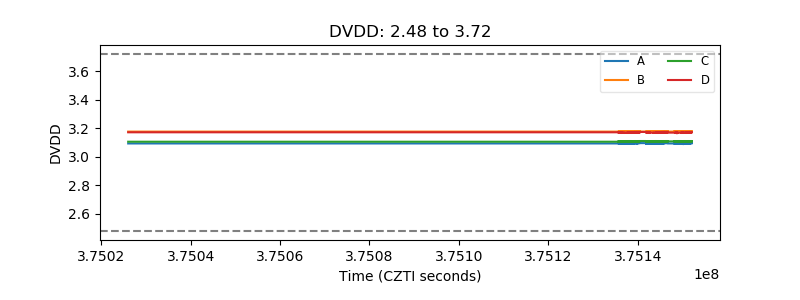 |
| Temperature 1 |  |
| Veto HV Monitor |  |
| Veto LLD | 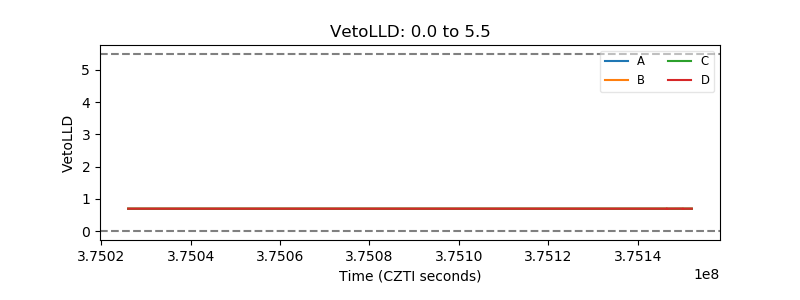 |
| Alpha Counter |  |
| _CPM_Rate |  |
| CZT Counter | 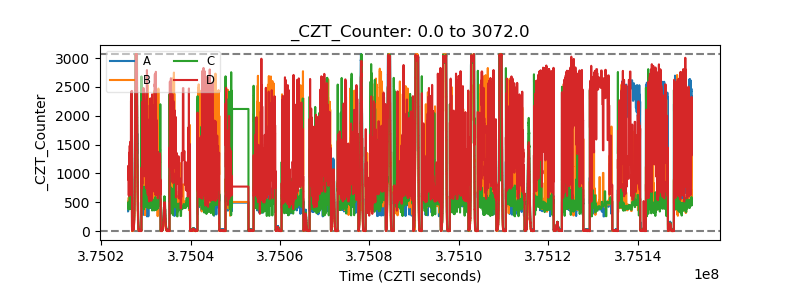 |
| +2.5 Volts monitor | 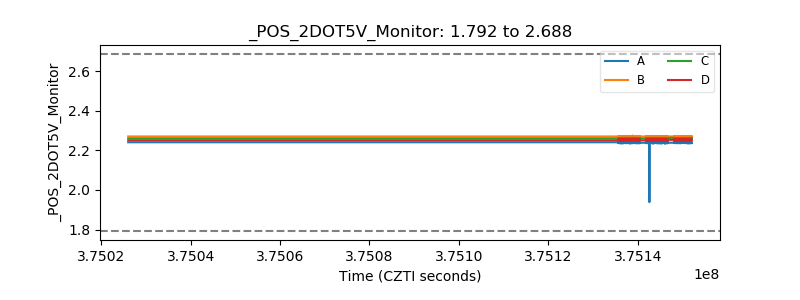 |
| +5 Volts monitor |  |
| _ROLL_ROT | 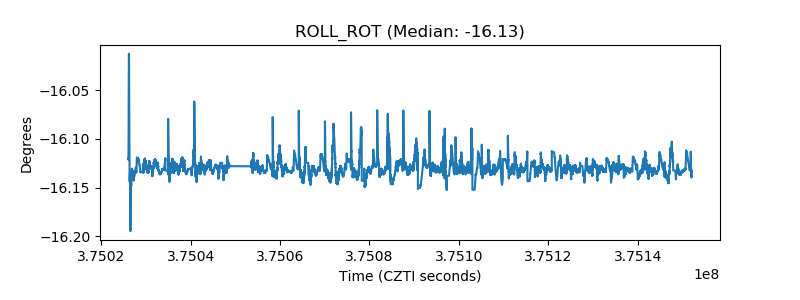 |
| _Roll_DEC |  |
| _Roll_RA | 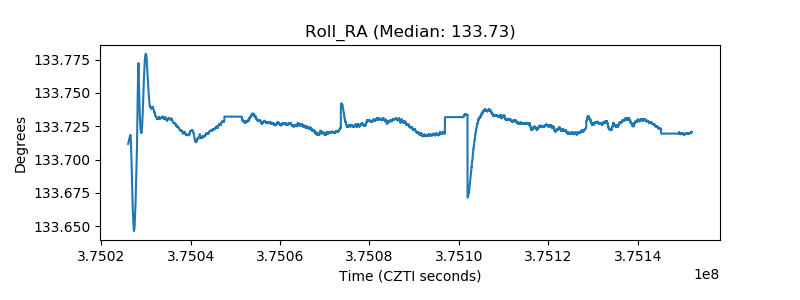 |
| Veto Counter |  |