| Param | Original file | Final file |
|---|---|---|
| Filename | modeM0/AS1A10_067T01_9000004774_33222cztM0_level2.evt | modeM0/AS1A10_067T01_9000004774_33222cztM0_level2_quad_clean.evt |
| Size (bytes) | 199,840,320 | 20,223,360 |
| Size | 190.6 MB | 19.3 MB |
| Events in quadrant A | 978,885 | 124,212 |
| Events in quadrant B | 1,361,313 | 120,956 |
| Events in quadrant C | 1,035,650 | 119,265 |
| Events in quadrant D | 2,546,792 | 110,225 |
| Mode M9 | |||
|---|---|---|---|
| Quadrant | BADHDUFLAG | Total packets | Discarded packets |
| A | 0 | 21 | 0 |
| B | 0 | 21 | 0 |
| C | 0 | 21 | 0 |
| D | 0 | 21 | 0 |
| Mode SS | |||
|---|---|---|---|
| Quadrant | BADHDUFLAG | Total packets | Discarded packets |
| A | 0 | 40 | 0 |
| B | 0 | 40 | 0 |
| C | 0 | 40 | 0 |
| D | 0 | 40 | 0 |
| Mode M0 | |||
|---|---|---|---|
| Quadrant | BADHDUFLAG | Total packets | Discarded packets |
| A | 0 | 3888 | 2 |
| B | 0 | 5232 | 1 |
| C | 0 | 4170 | 1 |
| D | 0 | 8907 | 1 |
| Quadrant | Total seconds | Saturated seconds | Saturation percentage |
|---|---|---|---|
| A | 1878 | 3 | 0.159744% |
| B | 1878 | 47 | 2.502662% |
| C | 1878 | 23 | 1.224707% |
| D | 1878 | 392 | 20.873269% |
Noise dominated data is calculated using 1-second bins in cleaned event files. If a bin has >2000 counts, and if more than 50% of those come from <1% of pixels, then it is considered to be noise-dominated and hence unusable.
| Quadrant | # 1 sec bins | Bins with >0 counts | Bins with >2000 counts | High rate bins dominated by noise | Noise dominated (total time) | Noise dominated (detector-on time) | Marked lightcurve |
|---|---|---|---|---|---|---|---|
| A | 4000 | 1879 | 0 | 0 | 0.00% | 0.00% | 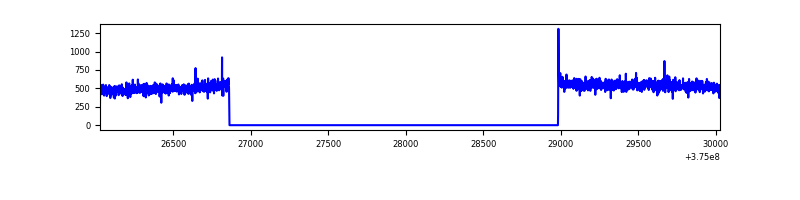 |
| B | 4000 | 1879 | 26 | 26 | 0.65% | 1.38% | 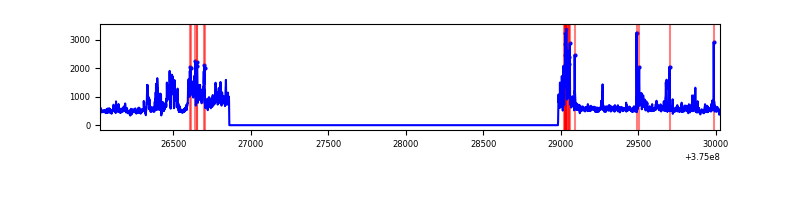 |
| C | 4000 | 1879 | 16 | 16 | 0.40% | 0.85% | 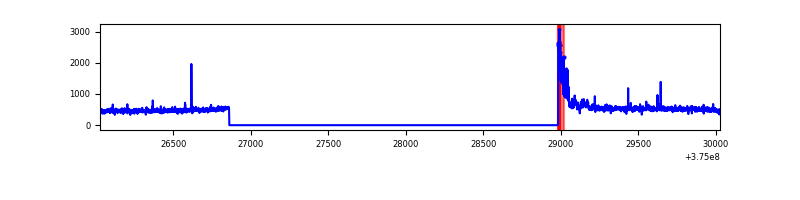 |
| D | 4000 | 1879 | 341 | 341 | 8.53% | 18.15% | 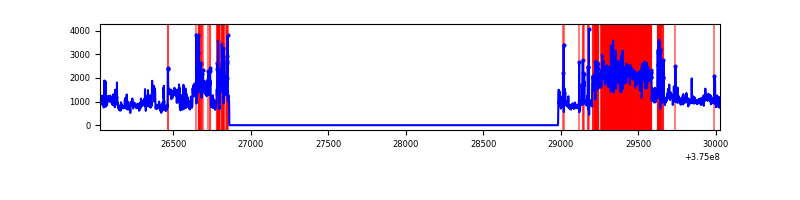 |
Top three noisy pixels from each quadrant. If the there are fewer than three noisy pixels in the level2.evt file, extra rows are filled as -1
| Pixel properties | Quadrant properties | ||||||
|---|---|---|---|---|---|---|---|
| Quadrant | DetID | PixID | Counts | Sigma | Mean | Median | Sigma |
| A | 15 | 47 | 16881 | 326.45 | 247 | 242 | 51.0 |
| A | 13 | 254 | 3605 | 65.98 | 247 | 242 | 51.0 |
| A | 13 | 6 | 3006 | 54.23 | 247 | 242 | 51.0 |
| B | 4 | 170 | 250739 | 5249.82 | 243 | 236 | 47.7 |
| B | 5 | 172 | 116122 | 2428.63 | 243 | 236 | 47.7 |
| B | 0 | 219 | 17559 | 363.03 | 243 | 236 | 47.7 |
| C | 0 | 10 | 83715 | 1516.45 | 234 | 236 | 55.0 |
| C | 1 | 23 | 17985 | 322.42 | 234 | 236 | 55.0 |
| C | 14 | 254 | 9495 | 168.2 | 234 | 236 | 55.0 |
| D | 8 | 195 | 1240757 | 20412.27 | 226 | 220 | 60.8 |
| D | 2 | 250 | 139230 | 2287.32 | 226 | 220 | 60.8 |
| D | 10 | 203 | 99281 | 1629.99 | 226 | 220 | 60.8 |
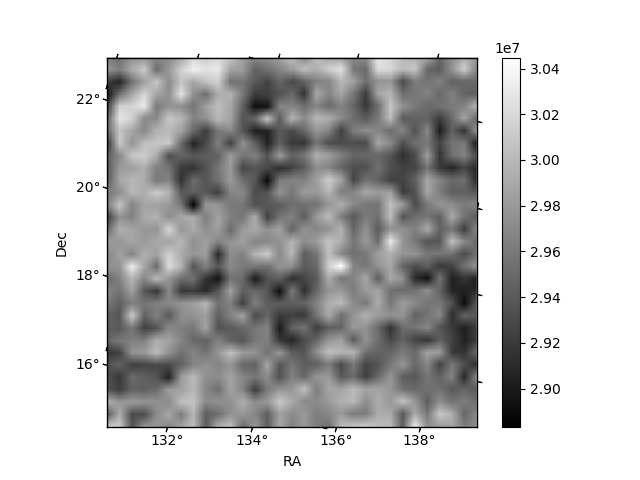
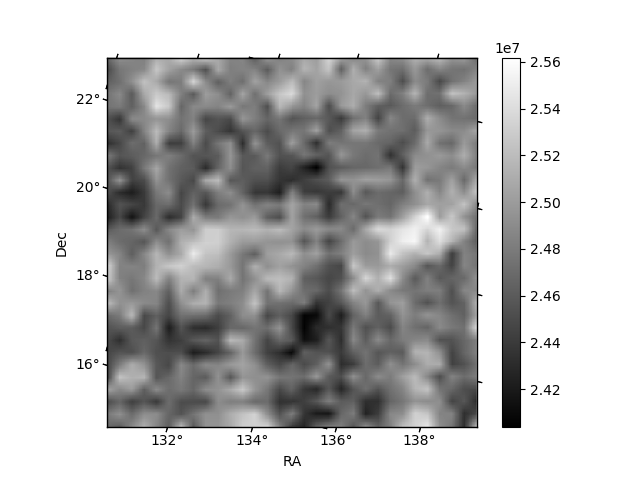
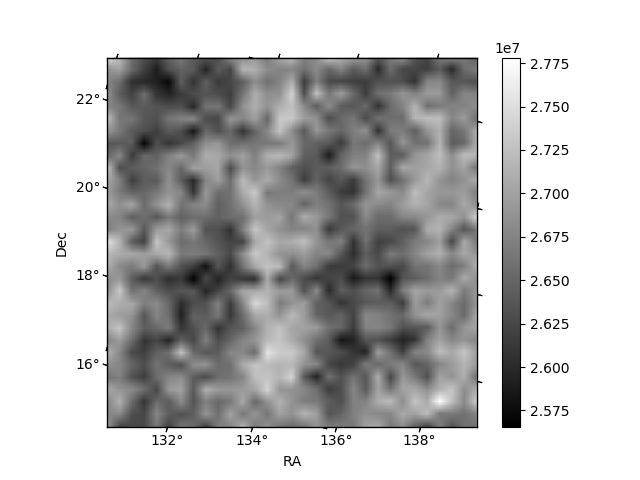
Histogram calculated using DETX and DETY for each event in the final _common_clean file
| Quadrant A |  |
 |
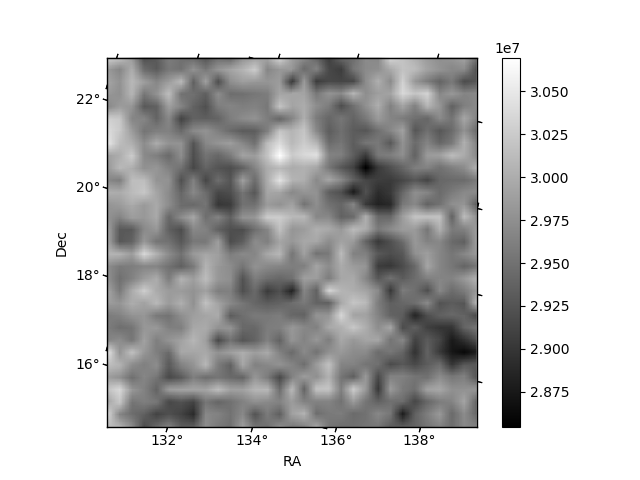
Quadrant B |
|---|---|---|---|
| Quadrant D |  |
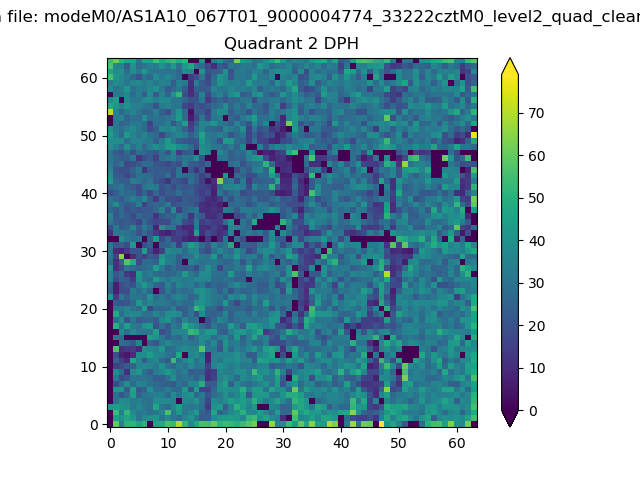 |
Quadrant C |
| Plot type | Count rate plots | Images |
|---|---|---|
| Comparison with Poisson distribution Blue bars denote a histogram of data divided into 1 sec bins. Red curve is a Poisson curve with rate = median count rate of data. |
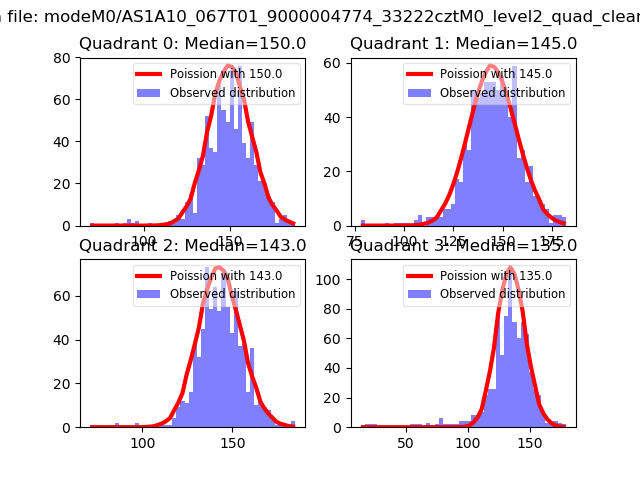 |
 |
| Quadrant-wise count rates Data is divided into 100 sec bins |
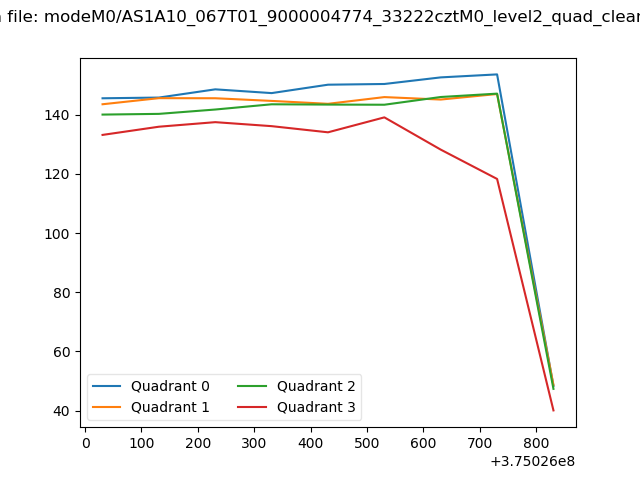 |
|
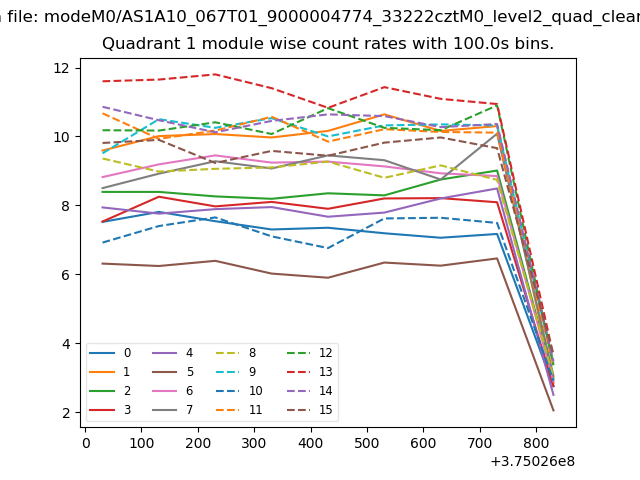
| Module-wise count rates for Quadrant A Data is divided into 100 sec bins |
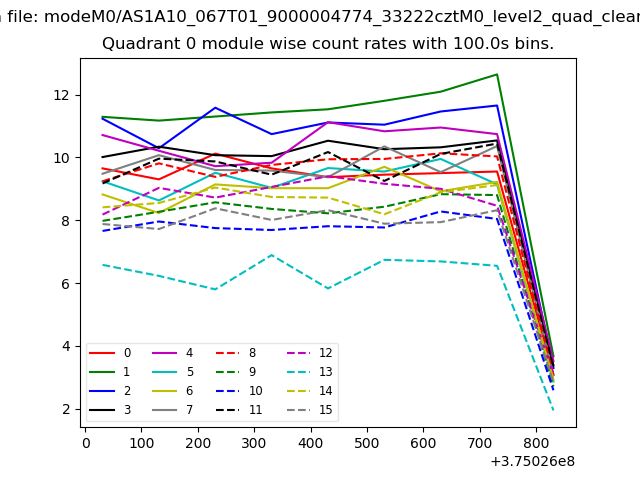 |
 |
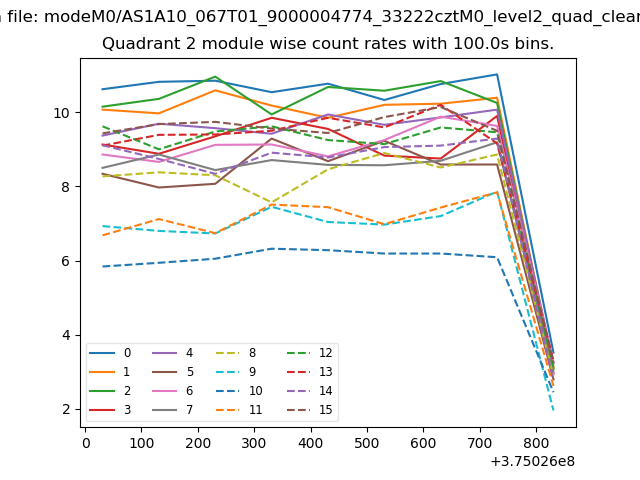
| Module-wise count rates for Quadrant B Data is divided into 100 sec bins |
 |
 |
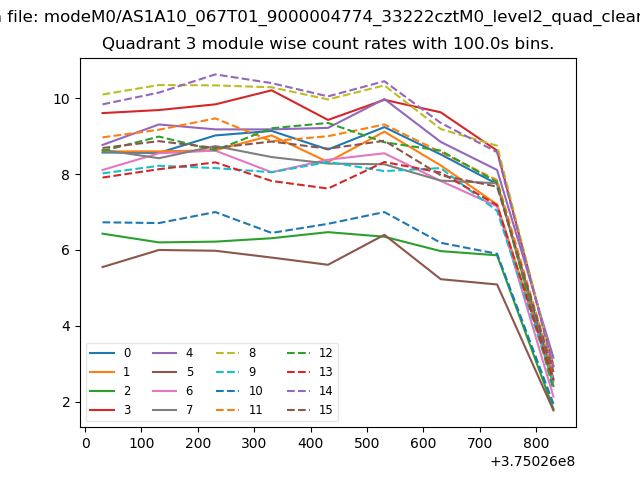
| Module-wise count rates for Quadrant C Data is divided into 100 sec bins |
 |
 |
| Module-wise count rates for Quadrant D Data is divided into 100 sec bins |
 |
 |
| Parameter | Plot |
|---|---|
| CZT HV Monitor | 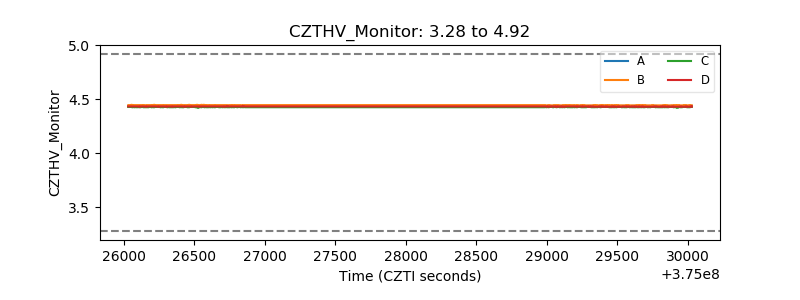 |
| D_VDD | 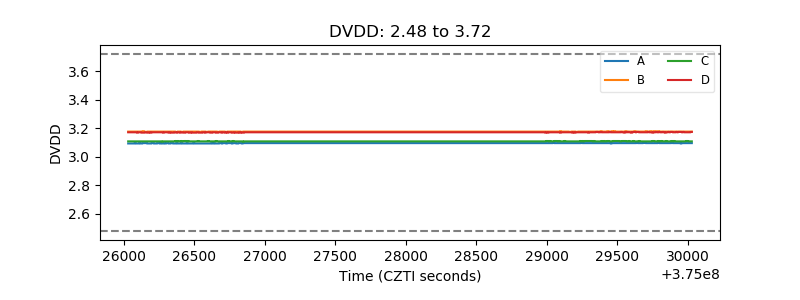 |
| Temperature 1 | 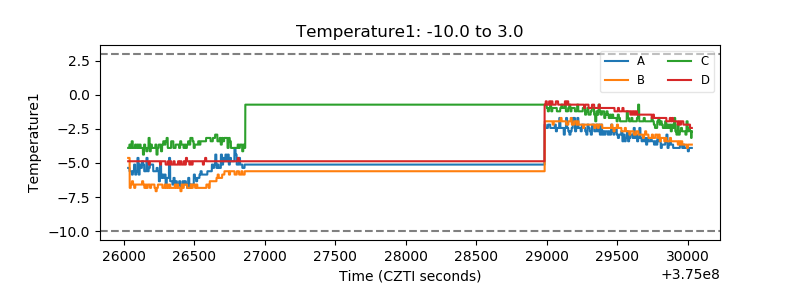 |
| Veto HV Monitor | 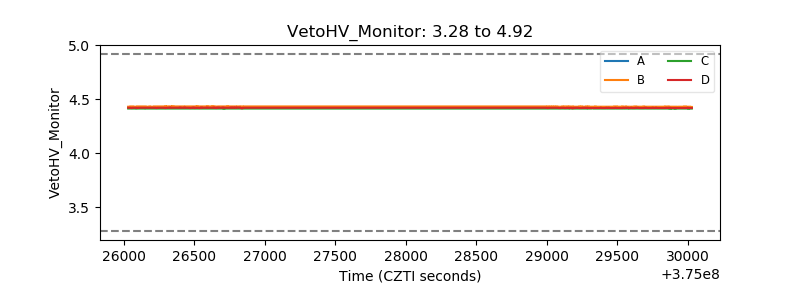 |
| Veto LLD |  |
| Alpha Counter | 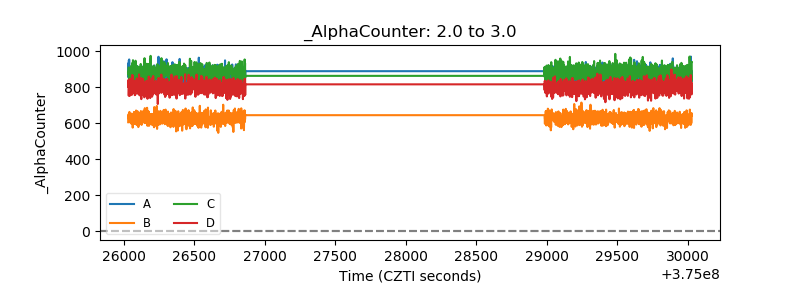 |
| _CPM_Rate | 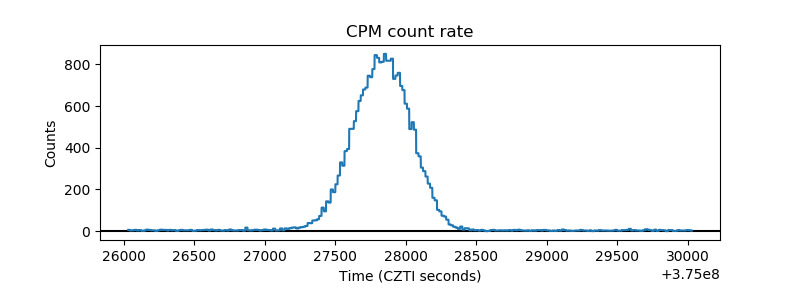 |
| CZT Counter | 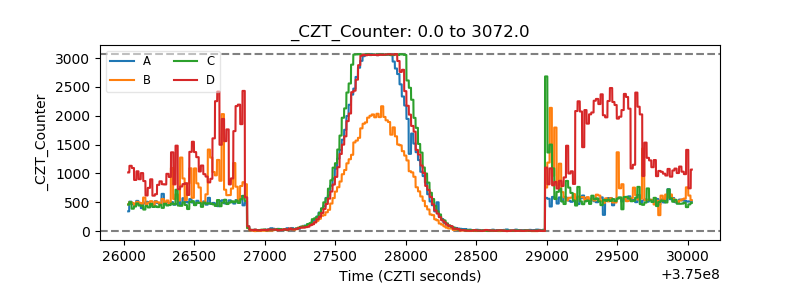 |
| +2.5 Volts monitor |  |
| +5 Volts monitor | 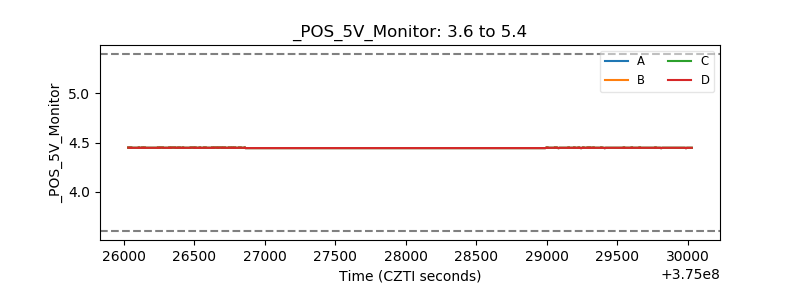 |
| _ROLL_ROT | 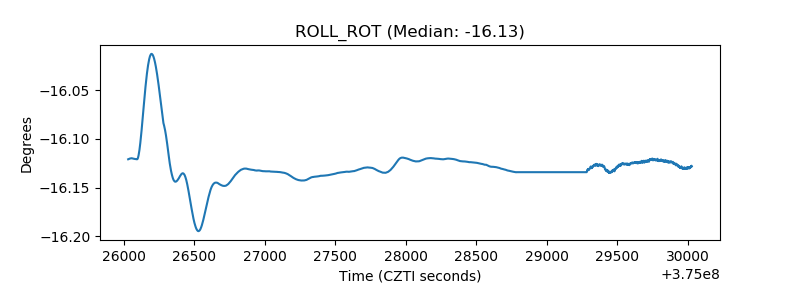 |
| _Roll_DEC | 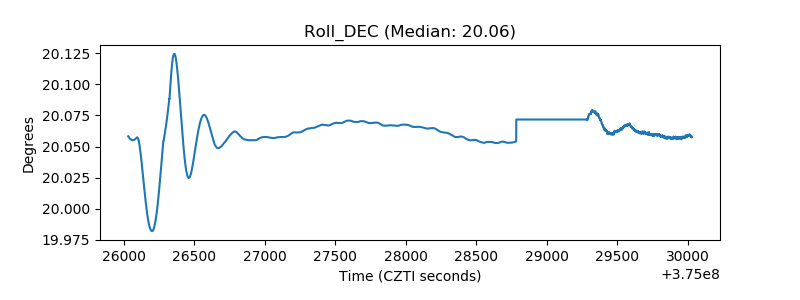 |
| _Roll_RA |  |
| Veto Counter | 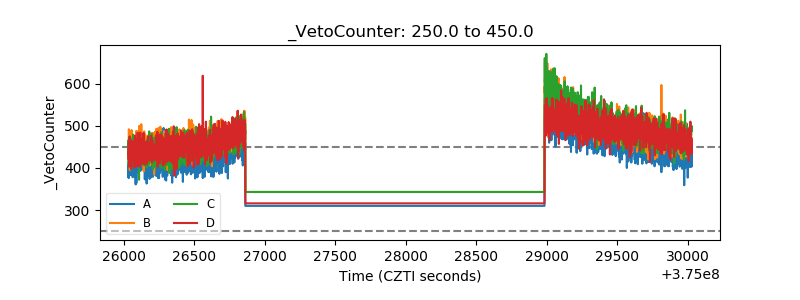 |