| Param | Original file | Final file |
|---|---|---|
| Filename | modeM0/AS1A10_067T01_9000004774_33224cztM0_level2.evt | modeM0/AS1A10_067T01_9000004774_33224cztM0_level2_quad_clean.evt |
| Size (bytes) | 543,839,040 | 78,128,640 |
| Size | 518.6 MB | 74.5 MB |
| Events in quadrant A | 2,572,019 | 513,196 |
| Events in quadrant B | 4,315,936 | 498,907 |
| Events in quadrant C | 2,930,556 | 499,467 |
| Events in quadrant D | 6,283,542 | 473,310 |
| Mode M9 | |||
|---|---|---|---|
| Quadrant | BADHDUFLAG | Total packets | Discarded packets |
| A | 0 | 19 | 0 |
| B | 0 | 19 | 0 |
| C | 0 | 19 | 0 |
| D | 0 | 20 | 0 |
| Mode SS | |||
|---|---|---|---|
| Quadrant | BADHDUFLAG | Total packets | Discarded packets |
| A | 0 | 112 | 0 |
| B | 0 | 112 | 0 |
| C | 0 | 112 | 0 |
| D | 0 | 112 | 0 |
| Mode M0 | |||
|---|---|---|---|
| Quadrant | BADHDUFLAG | Total packets | Discarded packets |
| A | 0 | 10981 | 3 |
| B | 0 | 16368 | 2 |
| C | 0 | 12248 | 2 |
| D | 0 | 22630 | 2 |
| Quadrant | Total seconds | Saturated seconds | Saturation percentage |
|---|---|---|---|
| A | 5437 | 2 | 0.036785% |
| B | 5437 | 453 | 8.331801% |
| C | 5437 | 88 | 1.618540% |
| D | 5437 | 462 | 8.497333% |
Noise dominated data is calculated using 1-second bins in cleaned event files. If a bin has >2000 counts, and if more than 50% of those come from <1% of pixels, then it is considered to be noise-dominated and hence unusable.
| Quadrant | # 1 sec bins | Bins with >0 counts | Bins with >2000 counts | High rate bins dominated by noise | Noise dominated (total time) | Noise dominated (detector-on time) | Marked lightcurve |
|---|---|---|---|---|---|---|---|
| A | 7109 | 5438 | 0 | 0 | 0.00% | 0.00% | 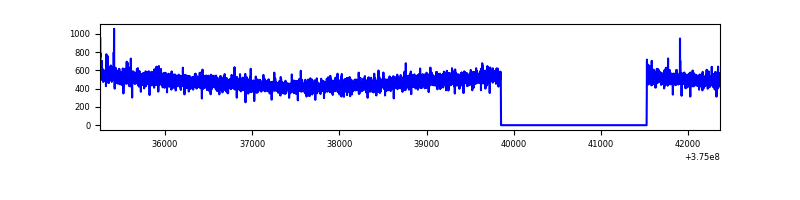 |
| B | 7109 | 5438 | 255 | 255 | 3.59% | 4.69% | 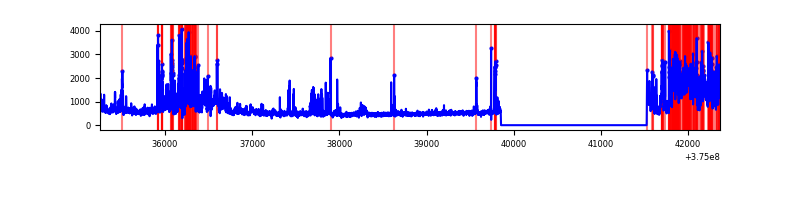 |
| C | 7109 | 5438 | 65 | 65 | 0.91% | 1.20% | 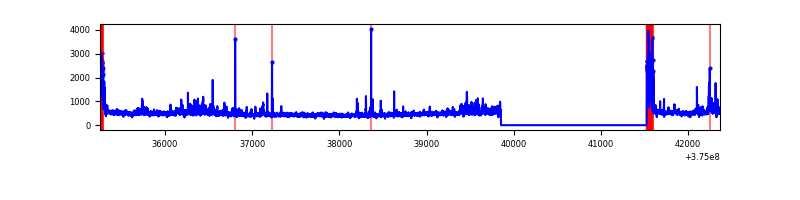 |
| D | 7109 | 5438 | 373 | 373 | 5.25% | 6.86% | 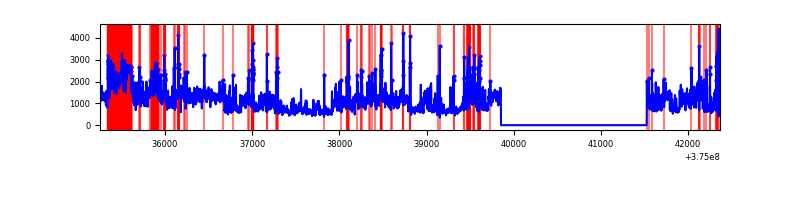 |
Top three noisy pixels from each quadrant. If the there are fewer than three noisy pixels in the level2.evt file, extra rows are filled as -1
| Pixel properties | Quadrant properties | ||||||
|---|---|---|---|---|---|---|---|
| Quadrant | DetID | PixID | Counts | Sigma | Mean | Median | Sigma |
| A | 13 | 6 | 16818 | 122.97 | 656 | 645 | 131.5 |
| A | 15 | 47 | 14238 | 103.36 | 656 | 645 | 131.5 |
| A | 13 | 254 | 9549 | 67.7 | 656 | 645 | 131.5 |
| B | 4 | 170 | 1198558 | 9904.29 | 635 | 620 | 121.0 |
| B | 5 | 172 | 356083 | 2938.89 | 635 | 620 | 121.0 |
| B | 0 | 219 | 91271 | 749.48 | 635 | 620 | 121.0 |
| C | 0 | 10 | 230936 | 1575.29 | 627 | 633 | 146.2 |
| C | 10 | 49 | 131337 | 894.03 | 627 | 633 | 146.2 |
| C | 9 | 187 | 32347 | 216.93 | 627 | 633 | 146.2 |
| D | 8 | 195 | 2144331 | 13530.36 | 615 | 602 | 158.4 |
| D | 12 | 3 | 588955 | 3713.45 | 615 | 602 | 158.4 |
| D | 10 | 203 | 361384 | 2277.11 | 615 | 602 | 158.4 |
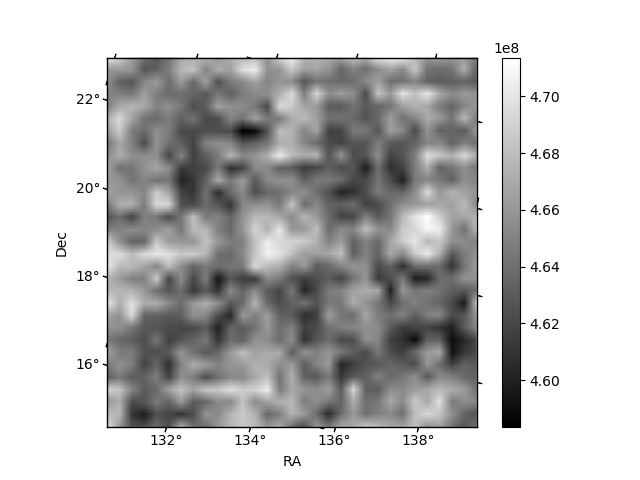
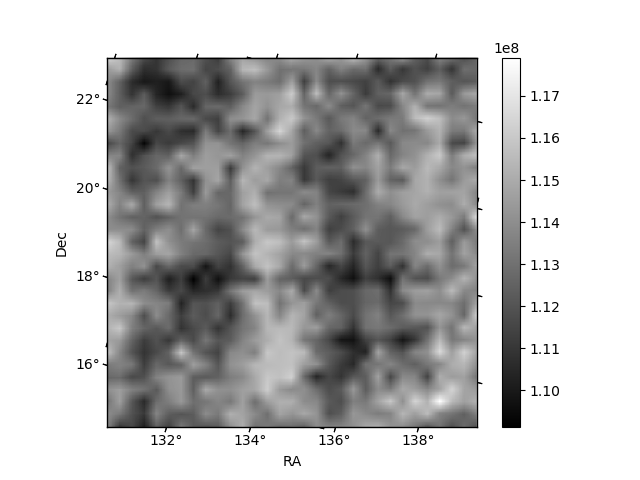
Histogram calculated using DETX and DETY for each event in the final _common_clean file
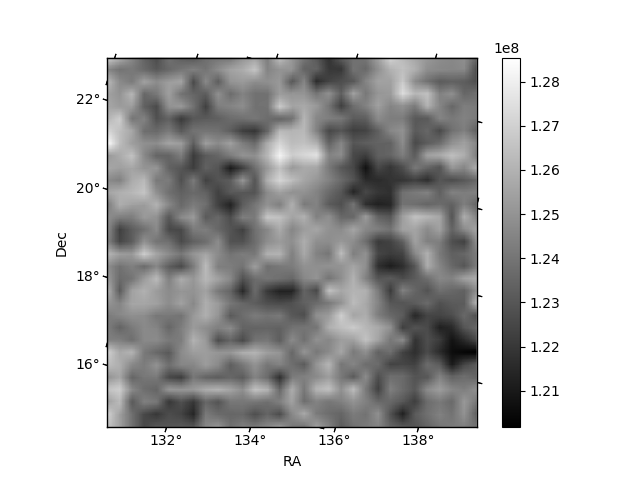
| Quadrant A | 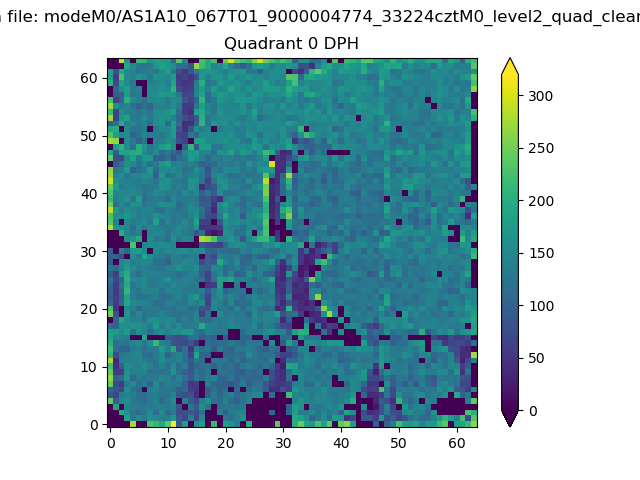 |
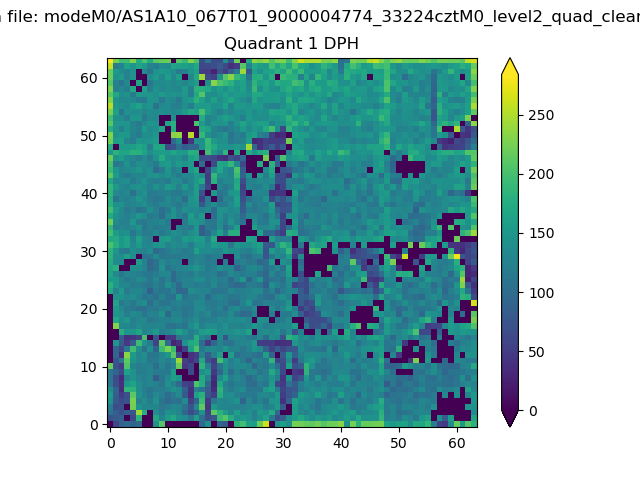 |
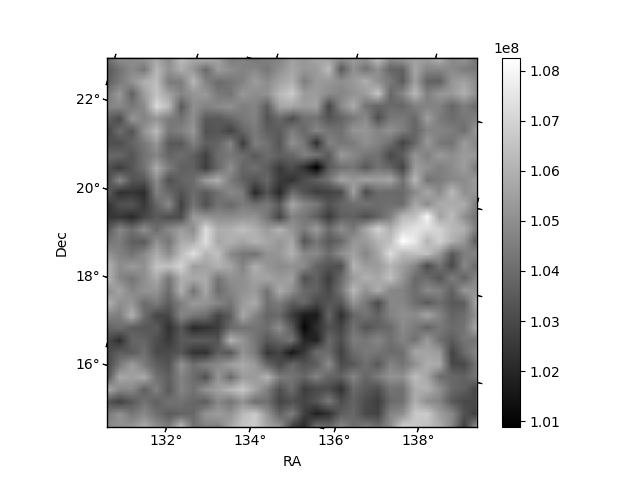
Quadrant B |
|---|---|---|---|
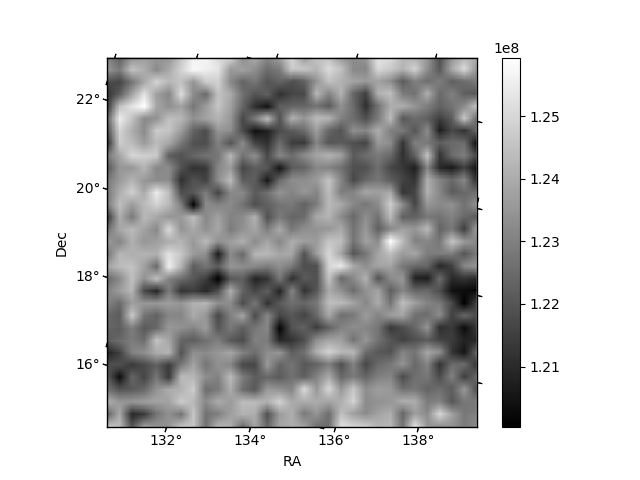
| Quadrant D | 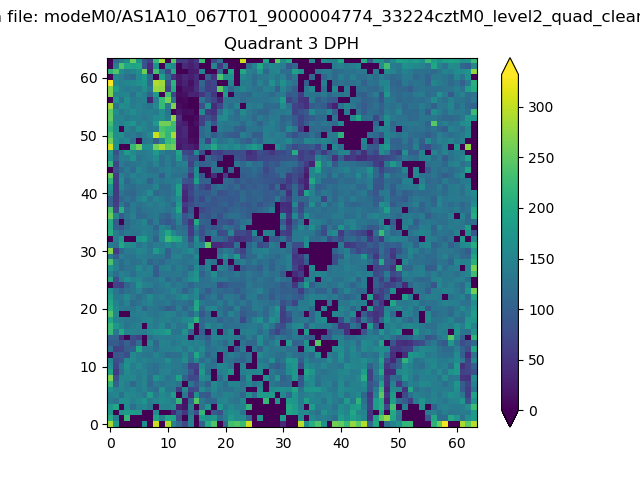 |
 |
Quadrant C |
| Plot type | Count rate plots | Images |
|---|---|---|
| Comparison with Poisson distribution Blue bars denote a histogram of data divided into 1 sec bins. Red curve is a Poisson curve with rate = median count rate of data. |
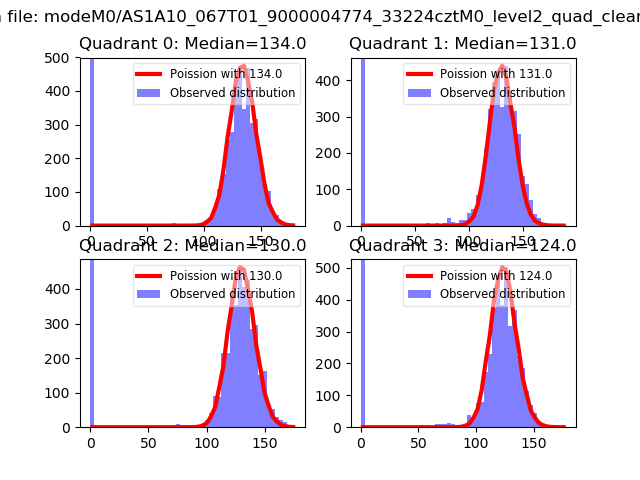 |
 |
| Quadrant-wise count rates Data is divided into 100 sec bins |
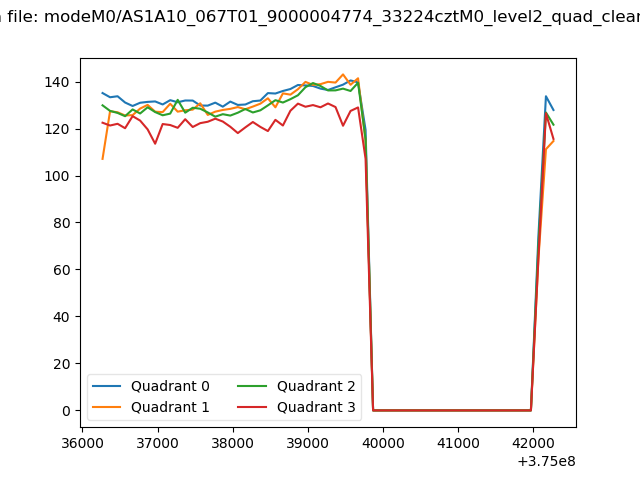 |
|
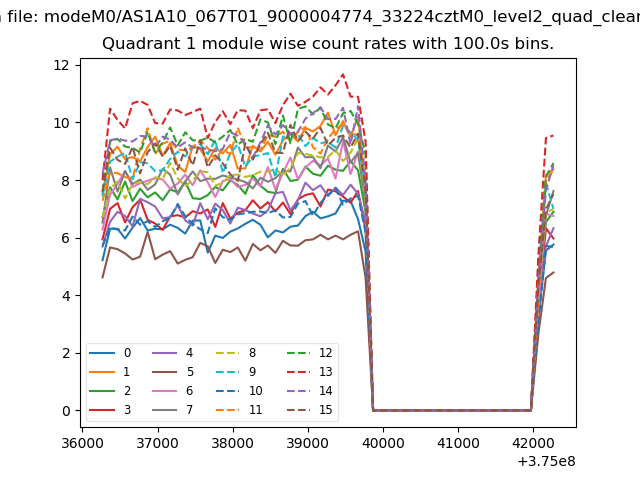
| Module-wise count rates for Quadrant A Data is divided into 100 sec bins |
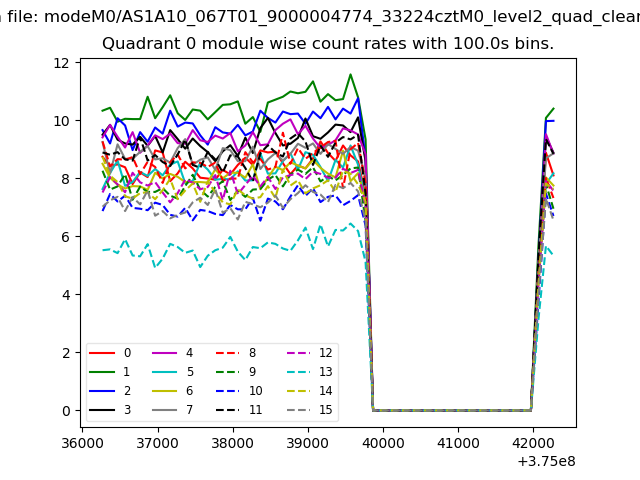 |
 |
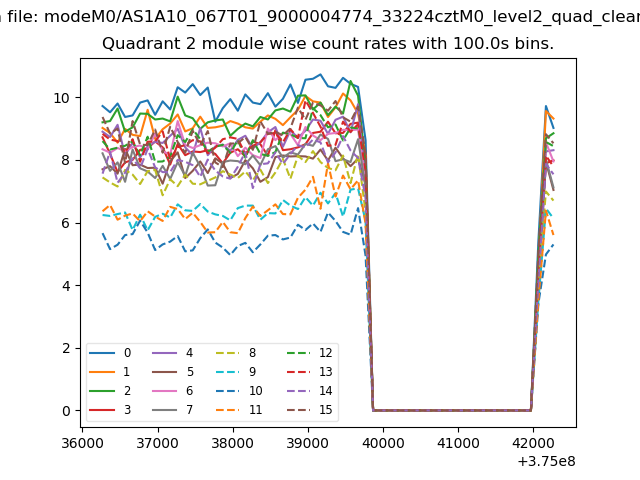
| Module-wise count rates for Quadrant B Data is divided into 100 sec bins |
 |
 |
| Module-wise count rates for Quadrant C Data is divided into 100 sec bins |
 |
 |
| Module-wise count rates for Quadrant D Data is divided into 100 sec bins |
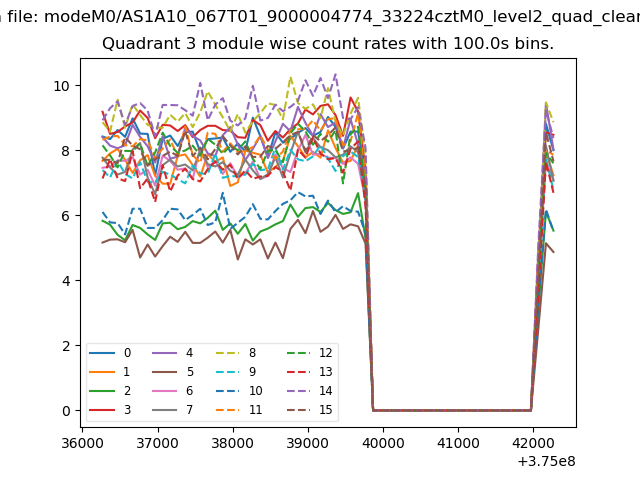 |
 |
| Parameter | Plot |
|---|---|
| CZT HV Monitor | 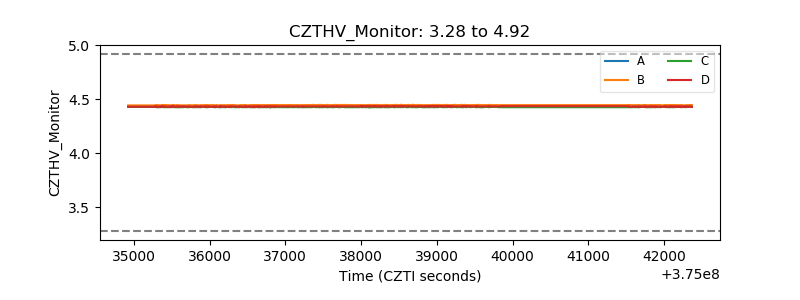 |
| D_VDD | 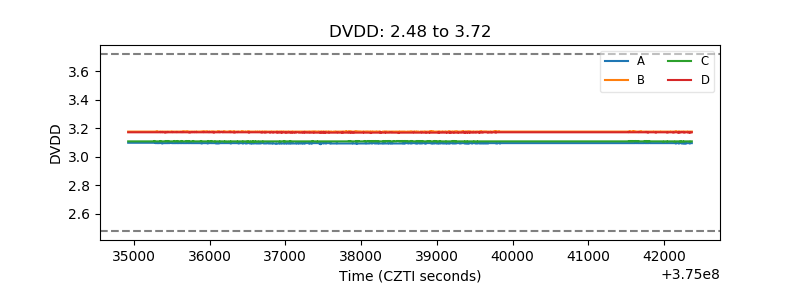 |
| Temperature 1 |  |
| Veto HV Monitor |  |
| Veto LLD |  |
| Alpha Counter | 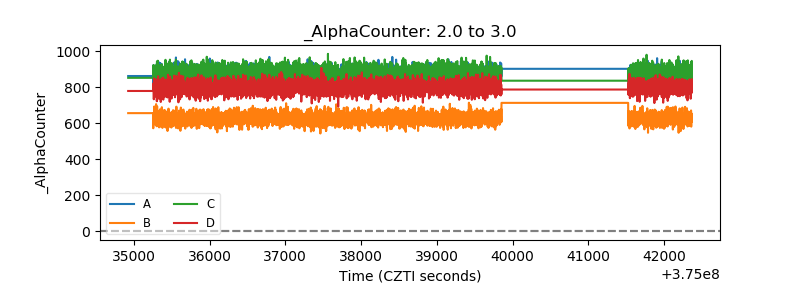 |
| _CPM_Rate | 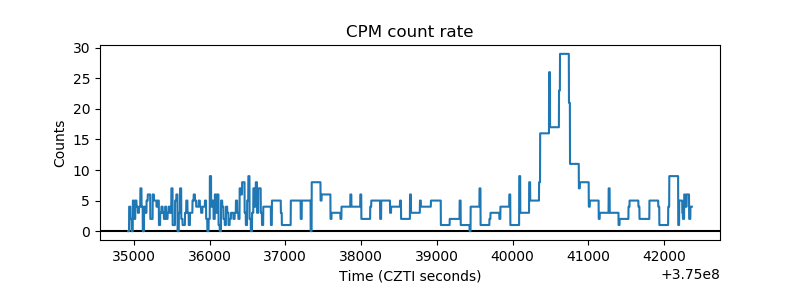 |
| CZT Counter | 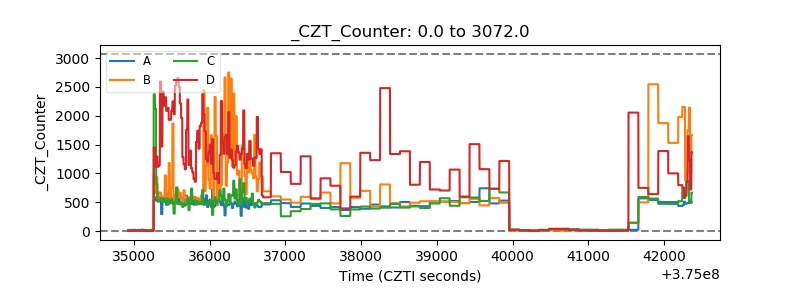 |
| +2.5 Volts monitor |  |
| +5 Volts monitor | 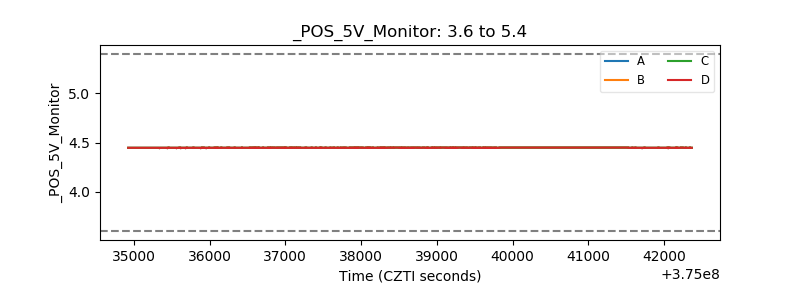 |
| _ROLL_ROT | 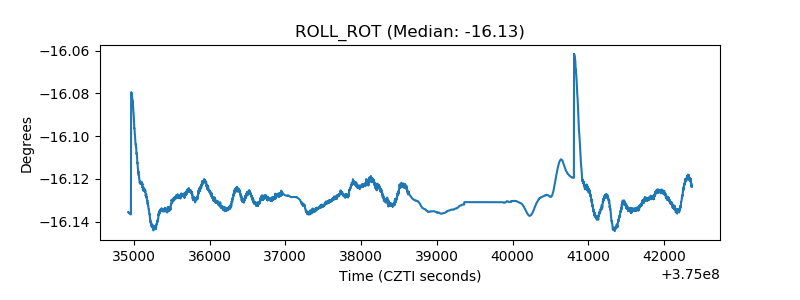 |
| _Roll_DEC | 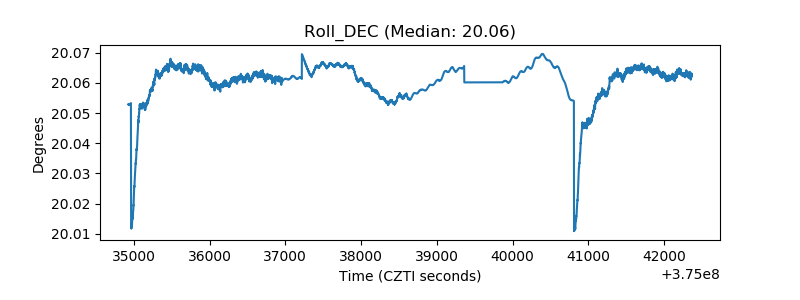 |
| _Roll_RA | 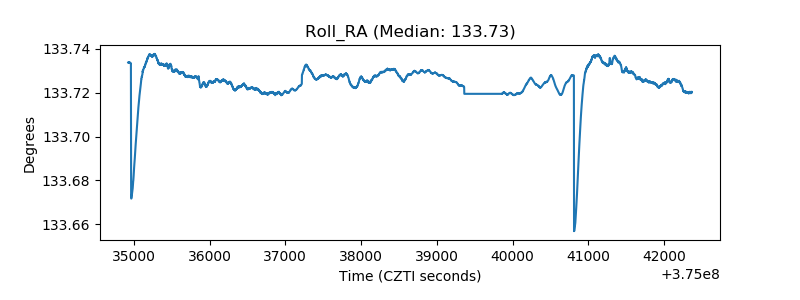 |
| Veto Counter | 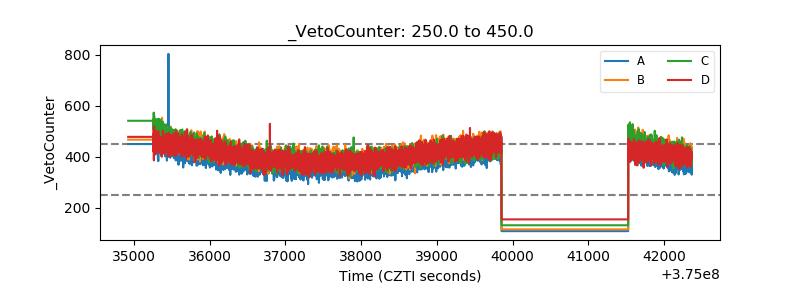 |