| Param | Original file | Final file |
|---|---|---|
| Filename | modeM0/AS1A10_067T01_9000004774_33225cztM0_level2.evt | modeM0/AS1A10_067T01_9000004774_33225cztM0_level2_quad_clean.evt |
| Size (bytes) | 597,988,800 | 84,049,920 |
| Size | 570.3 MB | 80.2 MB |
| Events in quadrant A | 2,677,267 | 561,781 |
| Events in quadrant B | 5,167,547 | 542,430 |
| Events in quadrant C | 3,554,563 | 542,725 |
| Events in quadrant D | 6,323,811 | 497,889 |
| Mode M9 | |||
|---|---|---|---|
| Quadrant | BADHDUFLAG | Total packets | Discarded packets |
| A | 0 | 29 | 0 |
| B | 0 | 29 | 0 |
| C | 0 | 29 | 0 |
| D | 0 | 29 | 0 |
| Mode SS | |||
|---|---|---|---|
| Quadrant | BADHDUFLAG | Total packets | Discarded packets |
| A | 0 | 118 | 0 |
| B | 0 | 118 | 0 |
| C | 0 | 118 | 0 |
| D | 0 | 118 | 0 |
| Mode M0 | |||
|---|---|---|---|
| Quadrant | BADHDUFLAG | Total packets | Discarded packets |
| A | 0 | 11602 | 3 |
| B | 0 | 19298 | 2 |
| C | 0 | 14514 | 2 |
| D | 0 | 22994 | 2 |
| Quadrant | Total seconds | Saturated seconds | Saturation percentage |
|---|---|---|---|
| A | 5718 | 5 | 0.087443% |
| B | 5718 | 525 | 9.181532% |
| C | 5718 | 175 | 3.060511% |
| D | 5718 | 541 | 9.461350% |
Noise dominated data is calculated using 1-second bins in cleaned event files. If a bin has >2000 counts, and if more than 50% of those come from <1% of pixels, then it is considered to be noise-dominated and hence unusable.
| Quadrant | # 1 sec bins | Bins with >0 counts | Bins with >2000 counts | High rate bins dominated by noise | Noise dominated (total time) | Noise dominated (detector-on time) | Marked lightcurve |
|---|---|---|---|---|---|---|---|
| A | 7121 | 5719 | 0 | 0 | 0.00% | 0.00% | 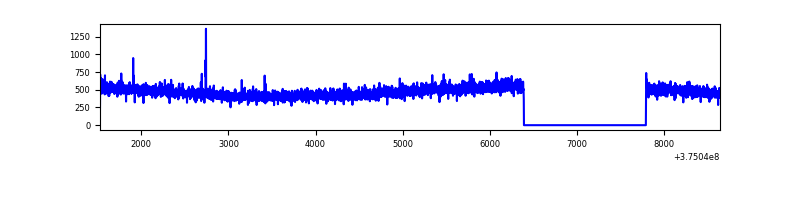 |
| B | 7121 | 5719 | 274 | 274 | 3.85% | 4.79% | 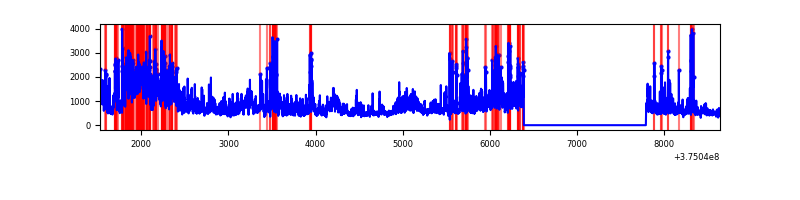 |
| C | 7121 | 5719 | 123 | 123 | 1.73% | 2.15% | 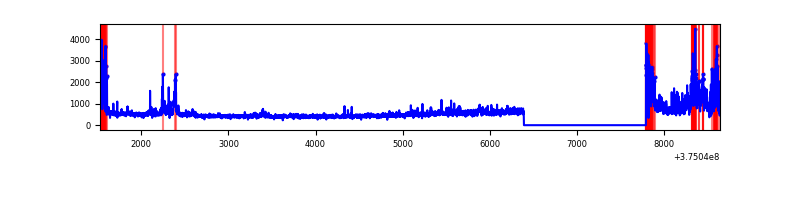 |
| D | 7121 | 5719 | 475 | 475 | 6.67% | 8.31% | 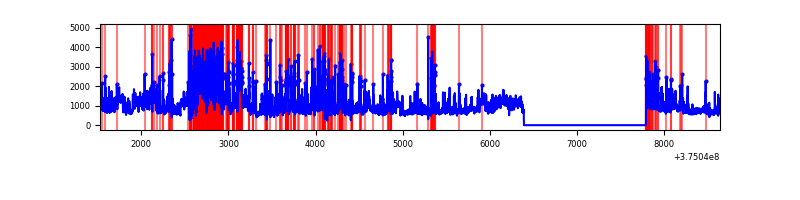 |
Top three noisy pixels from each quadrant. If the there are fewer than three noisy pixels in the level2.evt file, extra rows are filled as -1
| Pixel properties | Quadrant properties | ||||||
|---|---|---|---|---|---|---|---|
| Quadrant | DetID | PixID | Counts | Sigma | Mean | Median | Sigma |
| A | 15 | 47 | 20630 | 145.64 | 681 | 668 | 137.1 |
| A | 13 | 6 | 17747 | 124.6 | 681 | 668 | 137.1 |
| A | 13 | 254 | 11183 | 76.71 | 681 | 668 | 137.1 |
| B | 4 | 170 | 1638224 | 12979.31 | 657 | 639 | 126.2 |
| B | 5 | 172 | 486249 | 3848.89 | 657 | 639 | 126.2 |
| B | 0 | 219 | 250822 | 1982.92 | 657 | 639 | 126.2 |
| C | 10 | 49 | 423106 | 2801.81 | 650 | 655 | 150.8 |
| C | 0 | 10 | 407537 | 2698.55 | 650 | 655 | 150.8 |
| C | 1 | 23 | 138453 | 913.91 | 650 | 655 | 150.8 |
| D | 8 | 195 | 1483942 | 8867.48 | 634 | 619 | 167.3 |
| D | 12 | 3 | 582347 | 3477.64 | 634 | 619 | 167.3 |
| D | 2 | 250 | 538376 | 3214.78 | 634 | 619 | 167.3 |
Histogram calculated using DETX and DETY for each event in the final _common_clean file
| Quadrant A | 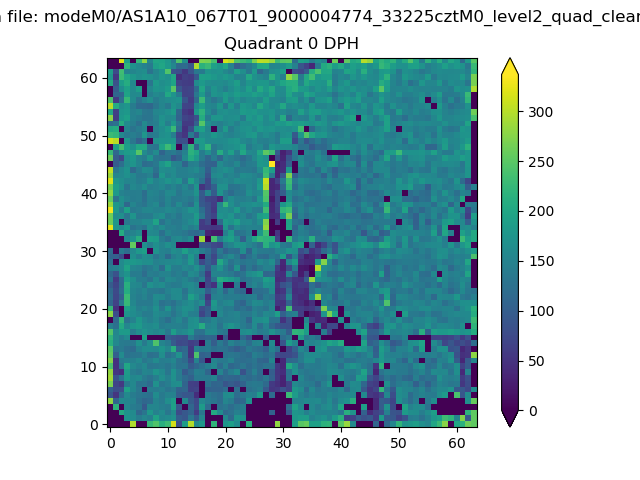 |
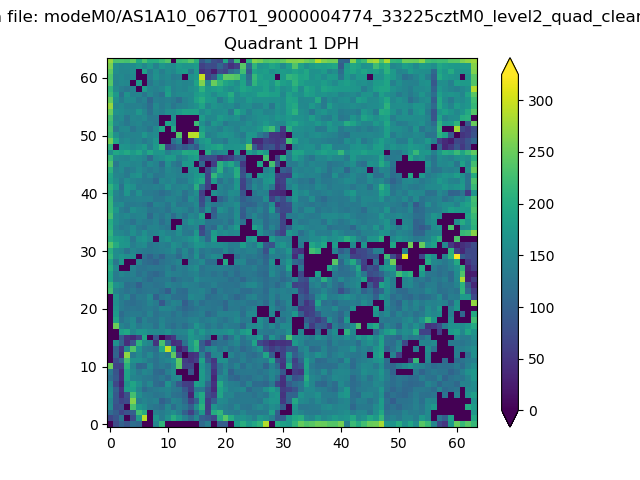 |
Quadrant B |
|---|---|---|---|
| Quadrant D | 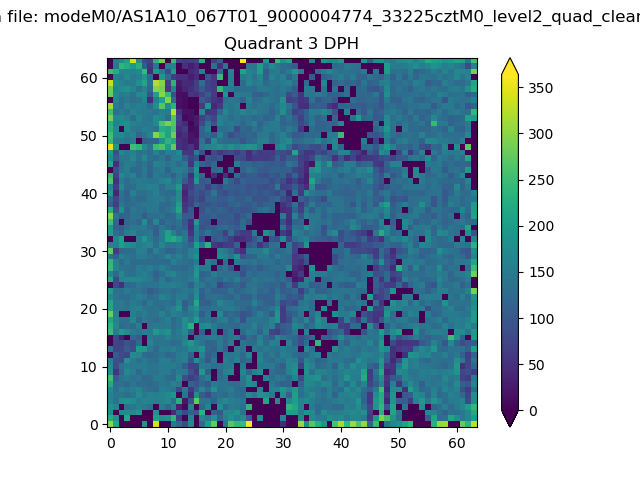 |
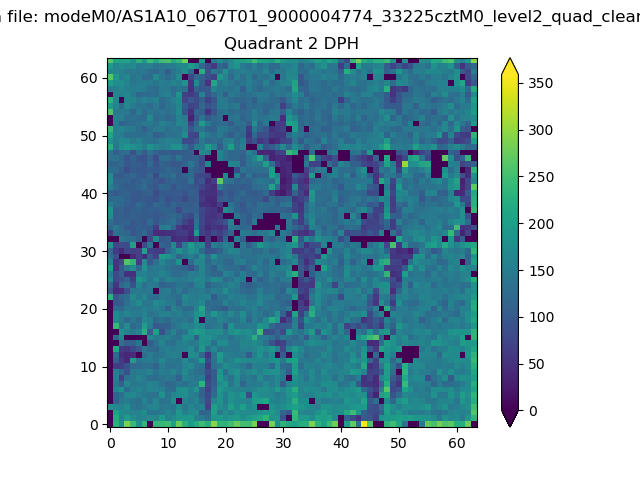 |
Quadrant C |
| Plot type | Count rate plots | Images |
|---|---|---|
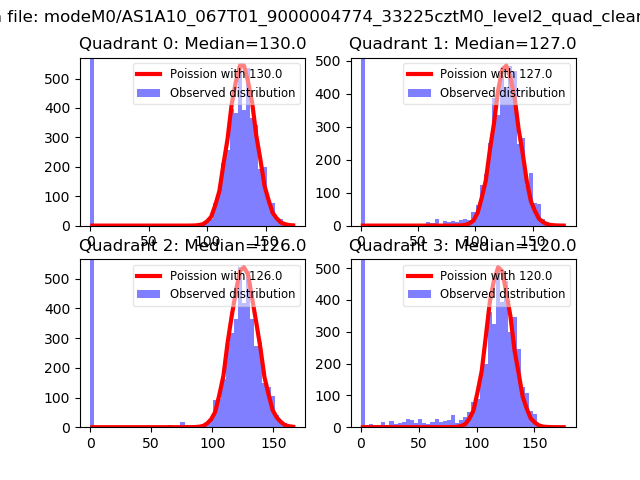
| Comparison with Poisson distribution Blue bars denote a histogram of data divided into 1 sec bins. Red curve is a Poisson curve with rate = median count rate of data. |
 |
 |
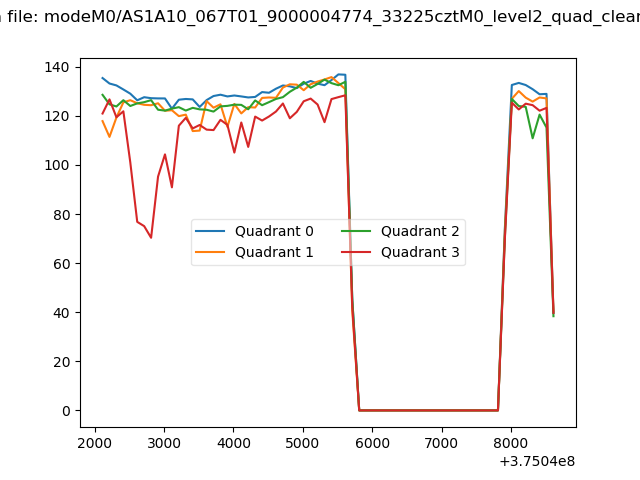
| Quadrant-wise count rates Data is divided into 100 sec bins |
 |
|
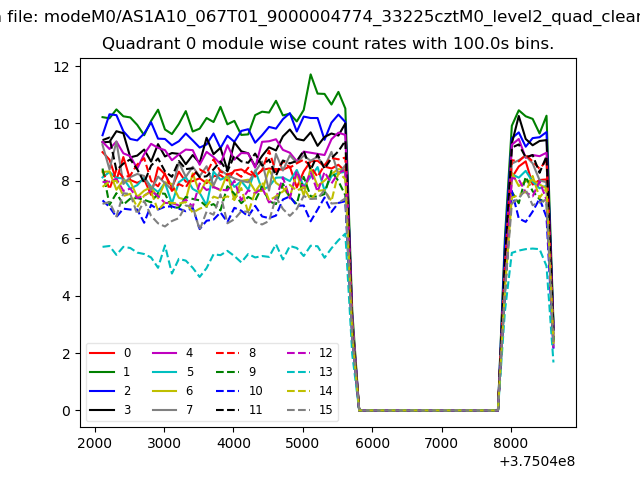
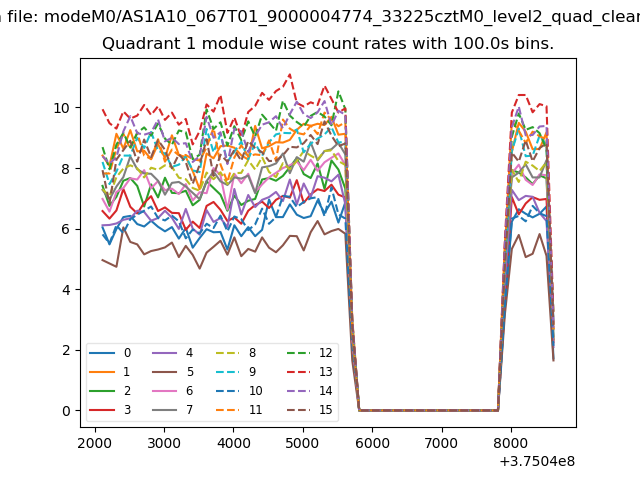
| Module-wise count rates for Quadrant A Data is divided into 100 sec bins |
 |
 |
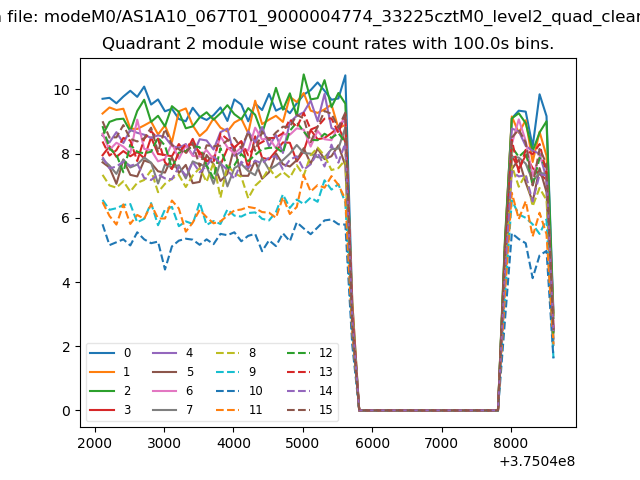
| Module-wise count rates for Quadrant B Data is divided into 100 sec bins |
 |
 |
| Module-wise count rates for Quadrant C Data is divided into 100 sec bins |
 |
 |
| Module-wise count rates for Quadrant D Data is divided into 100 sec bins |
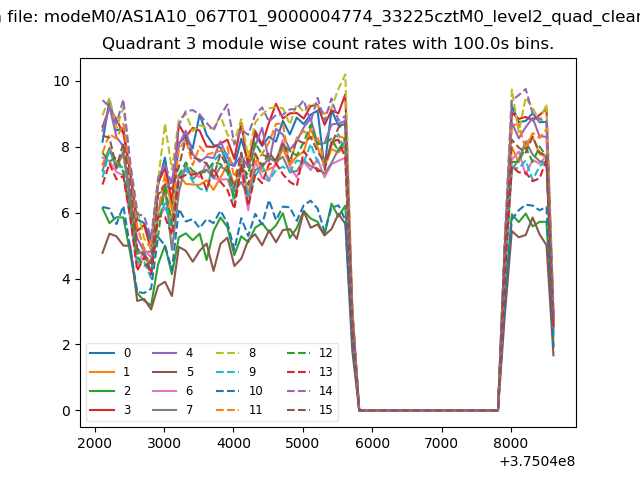 |
 |
| Parameter | Plot |
|---|---|
| CZT HV Monitor | 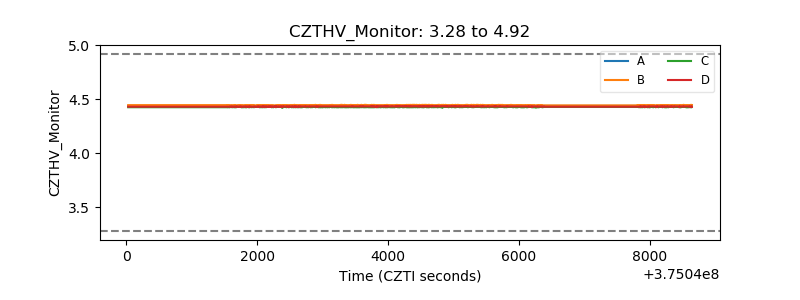 |
| D_VDD | 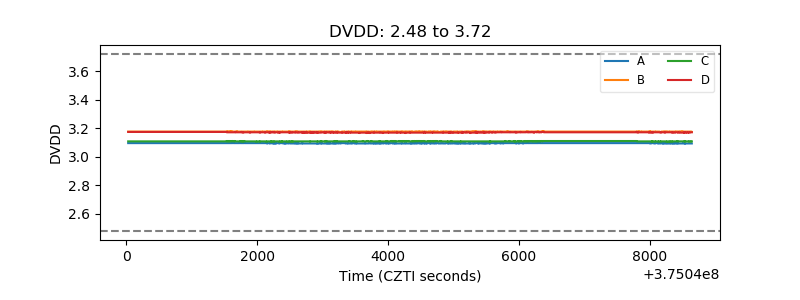 |
| Temperature 1 | 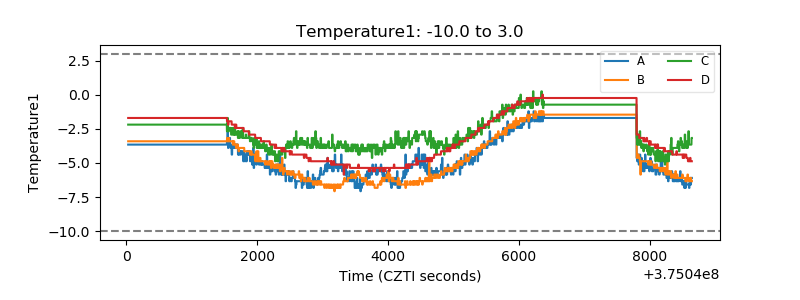 |
| Veto HV Monitor | 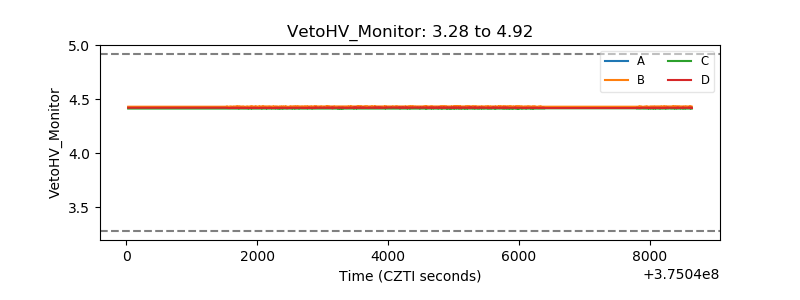 |
| Veto LLD | 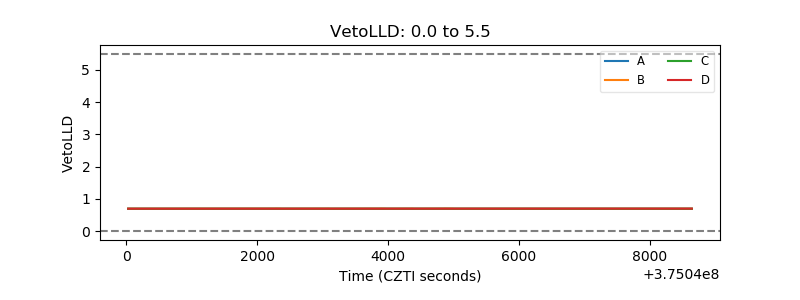 |
| Alpha Counter | 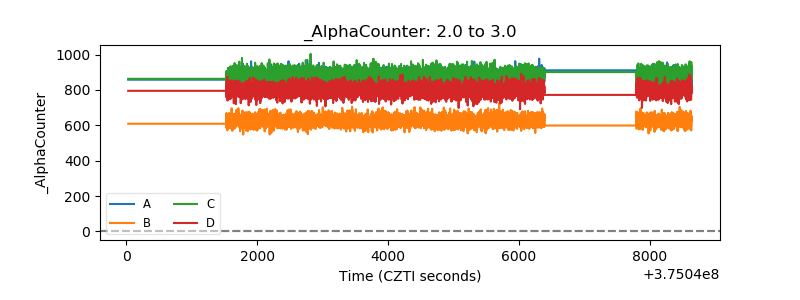 |
| _CPM_Rate | 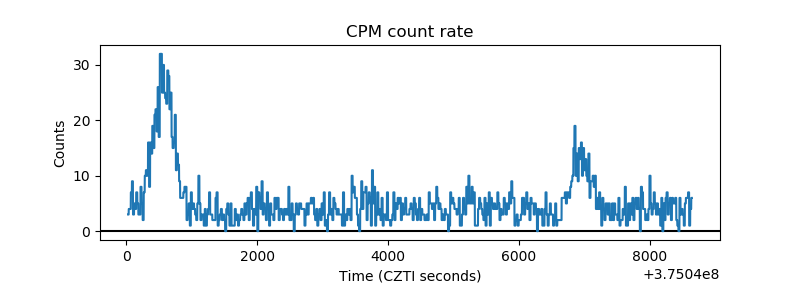 |
| CZT Counter | 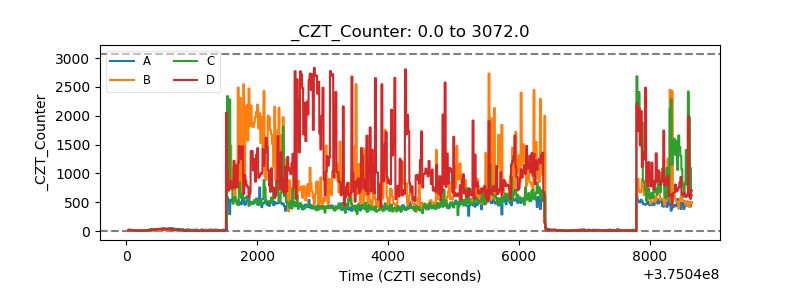 |
| +2.5 Volts monitor |  |
| +5 Volts monitor |  |
| _ROLL_ROT | 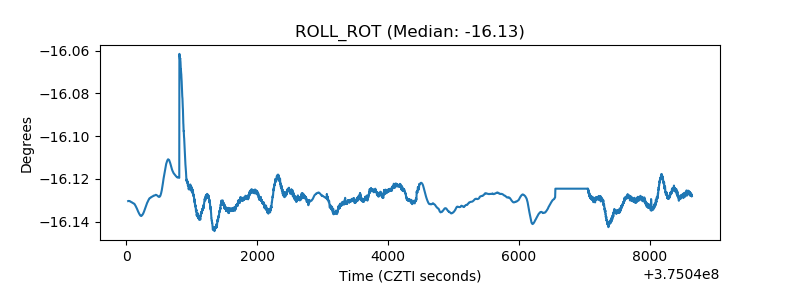 |
| _Roll_DEC | 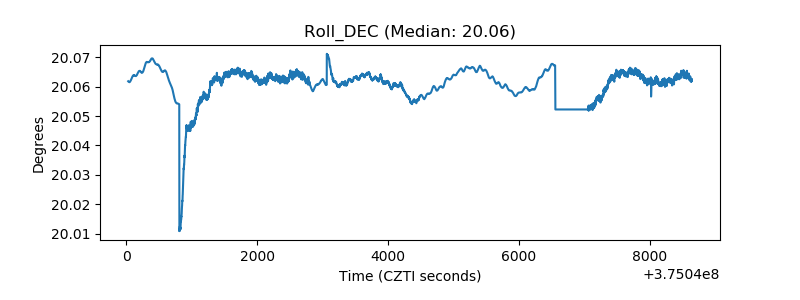 |
| _Roll_RA | 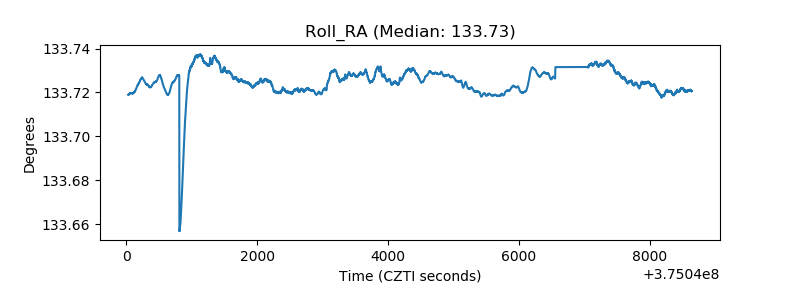 |
| Veto Counter | 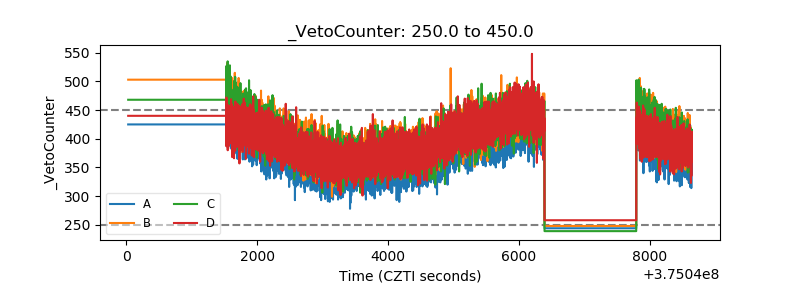 |