| Param | Original file | Final file |
|---|---|---|
| Filename | modeM0/AS1A10_067T01_9000004774_33226cztM0_level2.evt | modeM0/AS1A10_067T01_9000004774_33226cztM0_level2_quad_clean.evt |
| Size (bytes) | 624,709,440 | 88,047,360 |
| Size | 595.8 MB | 84.0 MB |
| Events in quadrant A | 4,592,049 | 565,583 |
| Events in quadrant B | 4,440,734 | 568,459 |
| Events in quadrant C | 3,930,666 | 563,356 |
| Events in quadrant D | 5,554,291 | 553,540 |
| Mode M9 | |||
|---|---|---|---|
| Quadrant | BADHDUFLAG | Total packets | Discarded packets |
| A | 0 | 19 | 0 |
| B | 0 | 19 | 0 |
| C | 0 | 19 | 0 |
| D | 0 | 20 | 0 |
| Mode SS | |||
|---|---|---|---|
| Quadrant | BADHDUFLAG | Total packets | Discarded packets |
| A | 0 | 122 | 0 |
| B | 0 | 122 | 0 |
| C | 0 | 122 | 0 |
| D | 0 | 122 | 0 |
| Mode M0 | |||
|---|---|---|---|
| Quadrant | BADHDUFLAG | Total packets | Discarded packets |
| A | 0 | 17841 | 3 |
| B | 0 | 17225 | 2 |
| C | 0 | 15600 | 2 |
| D | 0 | 20728 | 2 |
| Quadrant | Total seconds | Saturated seconds | Saturation percentage |
|---|---|---|---|
| A | 5937 | 758 | 12.767391% |
| B | 5937 | 319 | 5.373084% |
| C | 5937 | 238 | 4.008759% |
| D | 5937 | 327 | 5.507832% |
Noise dominated data is calculated using 1-second bins in cleaned event files. If a bin has >2000 counts, and if more than 50% of those come from <1% of pixels, then it is considered to be noise-dominated and hence unusable.
| Quadrant | # 1 sec bins | Bins with >0 counts | Bins with >2000 counts | High rate bins dominated by noise | Noise dominated (total time) | Noise dominated (detector-on time) | Marked lightcurve |
|---|---|---|---|---|---|---|---|
| A | 7250 | 5938 | 499 | 499 | 6.88% | 8.40% | 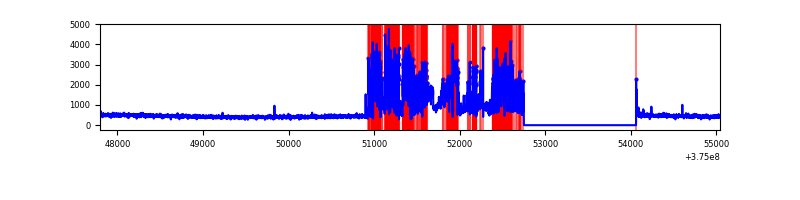 |
| B | 7250 | 5938 | 187 | 187 | 2.58% | 3.15% | 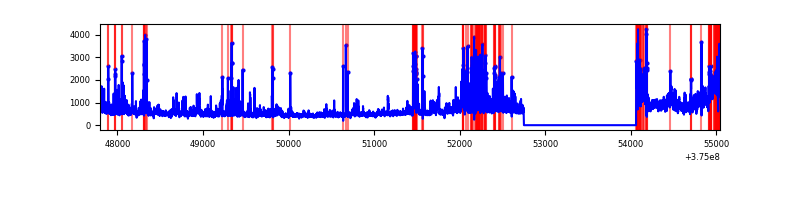 |
| C | 7250 | 5938 | 177 | 177 | 2.44% | 2.98% | 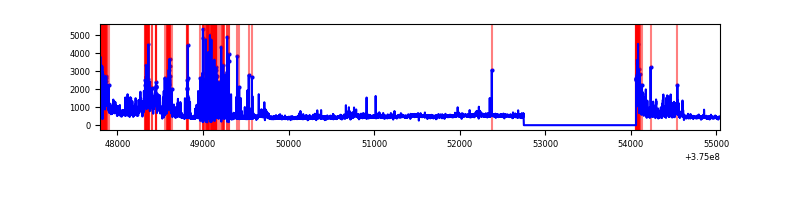 |
| D | 7250 | 5938 | 211 | 211 | 2.91% | 3.55% | 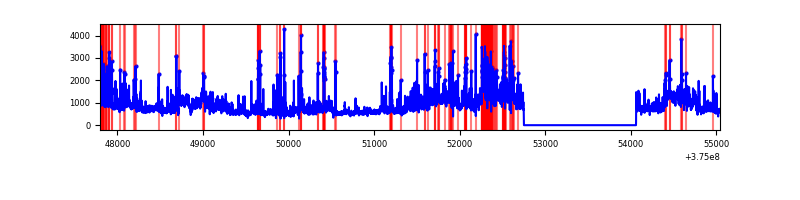 |
Top three noisy pixels from each quadrant. If the there are fewer than three noisy pixels in the level2.evt file, extra rows are filled as -1
| Pixel properties | Quadrant properties | ||||||
|---|---|---|---|---|---|---|---|
| Quadrant | DetID | PixID | Counts | Sigma | Mean | Median | Sigma |
| A | 15 | 169 | 2018376 | 15107.8 | 661 | 648 | 133.6 |
| A | 13 | 6 | 13071 | 93.02 | 661 | 648 | 133.6 |
| A | 13 | 254 | 10339 | 72.56 | 661 | 648 | 133.6 |
| B | 4 | 170 | 847577 | 6405.79 | 682 | 664 | 132.2 |
| B | 5 | 172 | 570455 | 4309.73 | 682 | 664 | 132.2 |
| B | 5 | 31 | 113852 | 856.12 | 682 | 664 | 132.2 |
| C | 10 | 49 | 527580 | 3382.2 | 667 | 673 | 155.8 |
| C | 1 | 23 | 445298 | 2854.03 | 667 | 673 | 155.8 |
| C | 0 | 10 | 287559 | 1841.51 | 667 | 673 | 155.8 |
| D | 8 | 195 | 1517300 | 8626.33 | 656 | 641 | 175.8 |
| D | 12 | 3 | 368744 | 2093.67 | 656 | 641 | 175.8 |
| D | 10 | 203 | 353461 | 2006.74 | 656 | 641 | 175.8 |
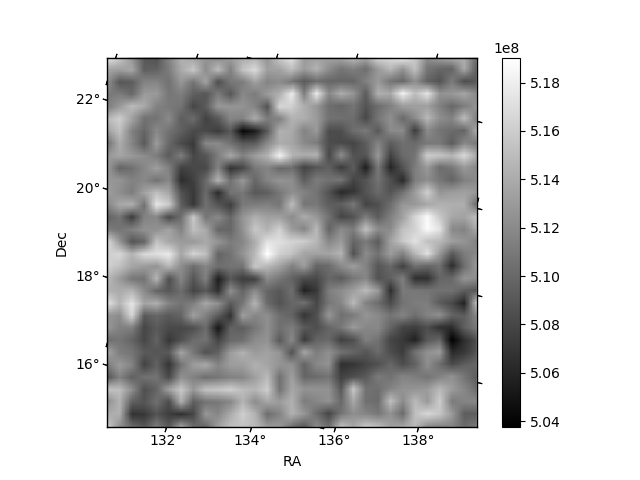
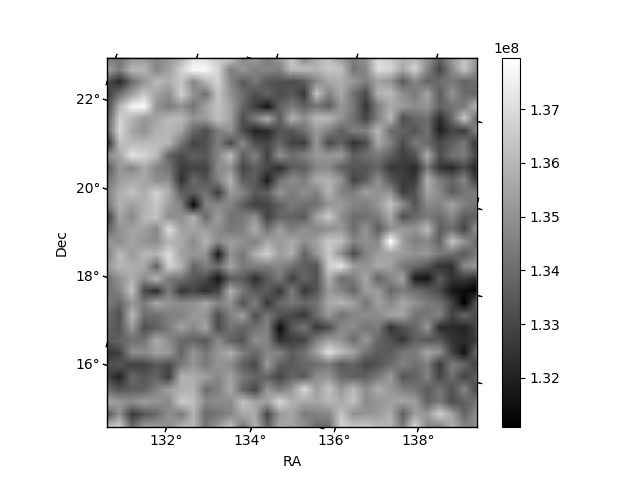
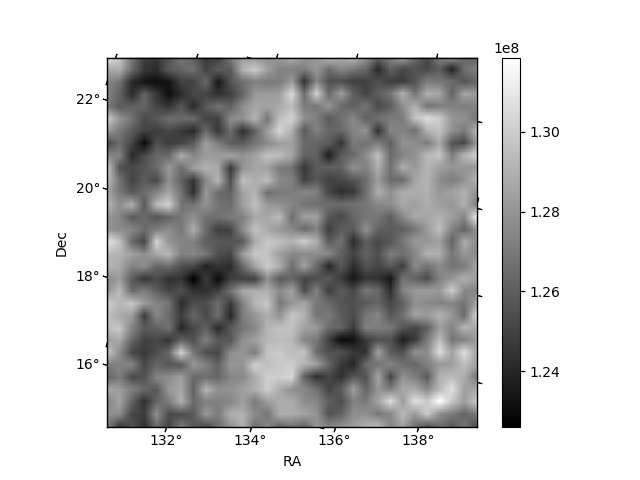
Histogram calculated using DETX and DETY for each event in the final _common_clean file
| Quadrant A | 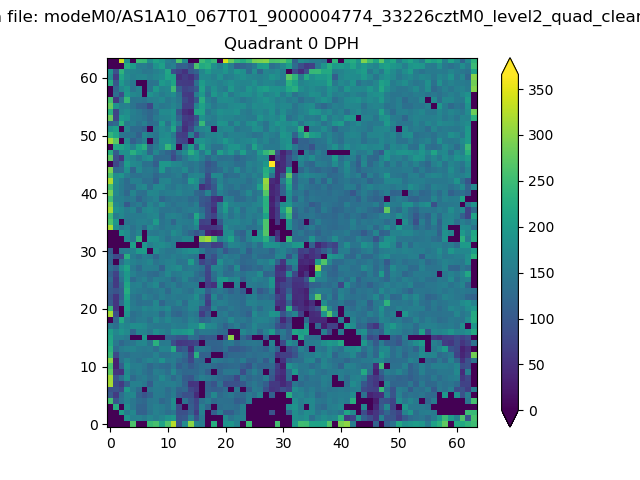 |
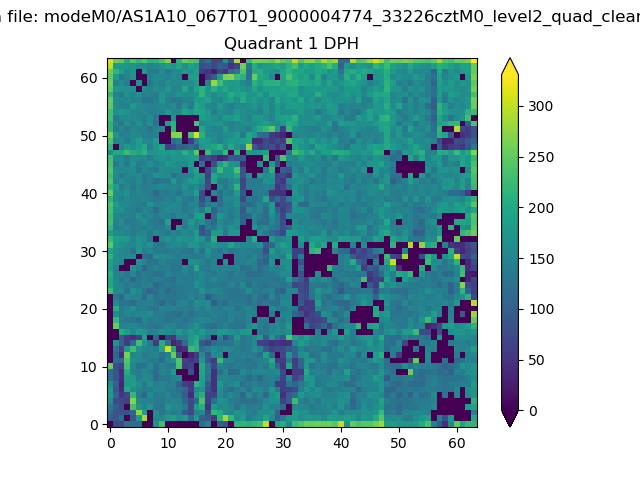 |
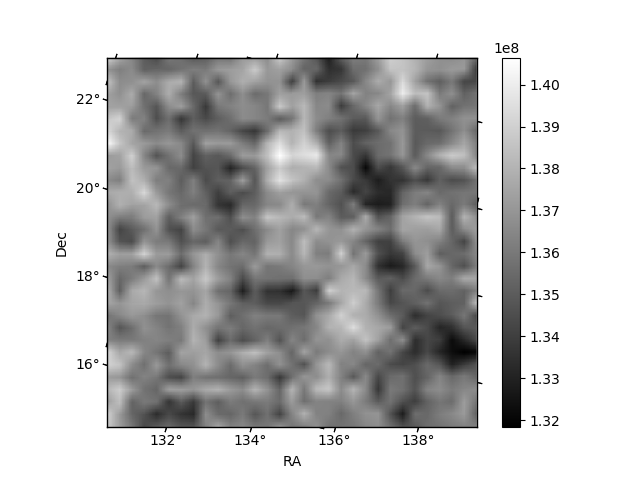
Quadrant B |
|---|---|---|---|
| Quadrant D | 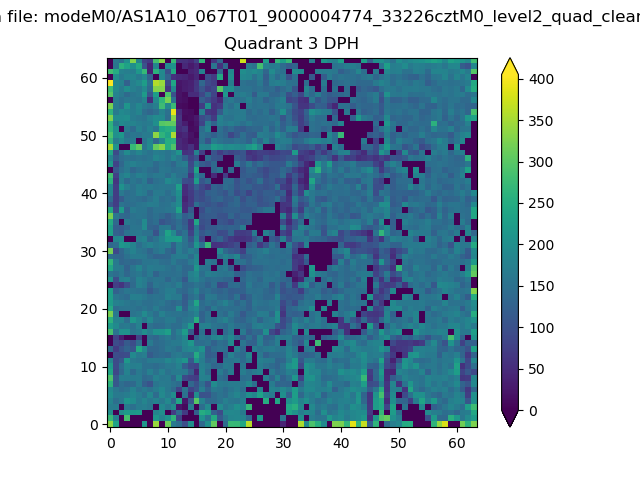 |
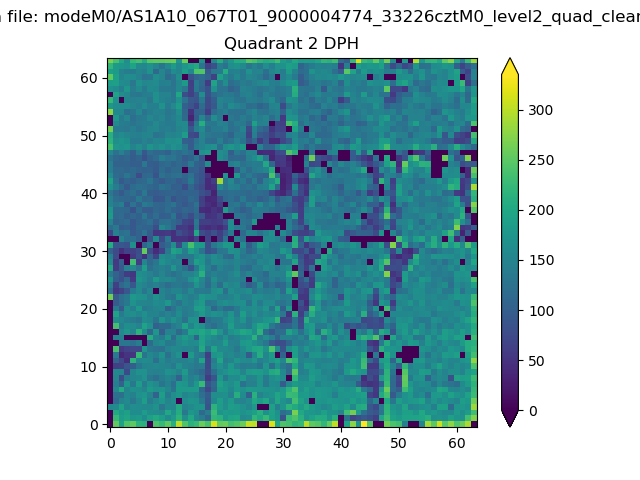 |
Quadrant C |
| Plot type | Count rate plots | Images |
|---|---|---|
| Comparison with Poisson distribution Blue bars denote a histogram of data divided into 1 sec bins. Red curve is a Poisson curve with rate = median count rate of data. |
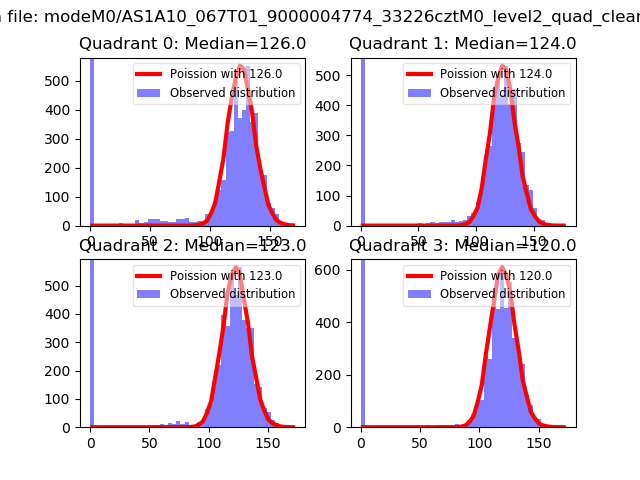 |
 |
| Quadrant-wise count rates Data is divided into 100 sec bins |
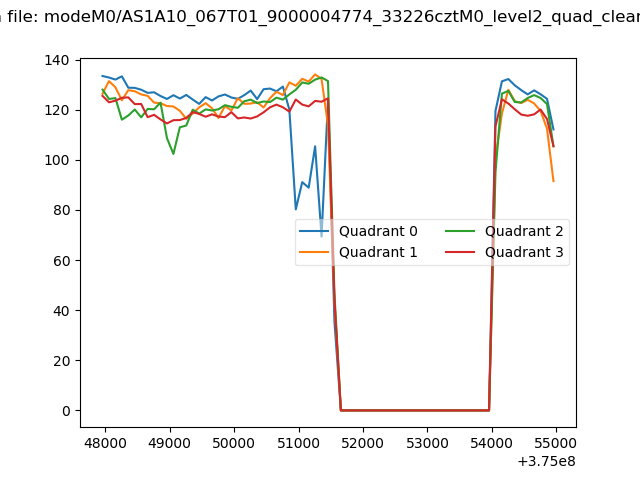 |
|
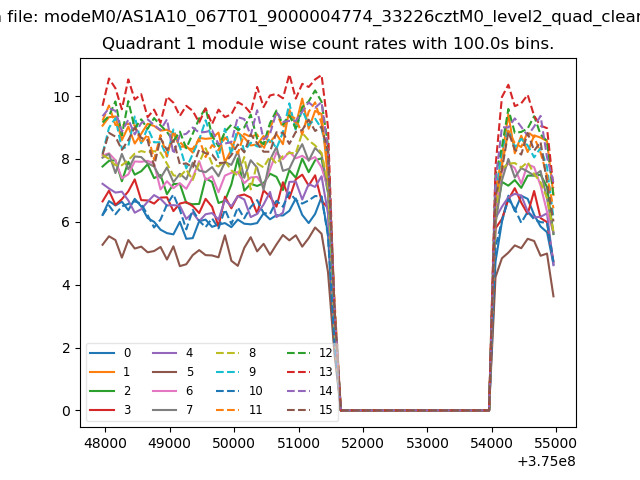
| Module-wise count rates for Quadrant A Data is divided into 100 sec bins |
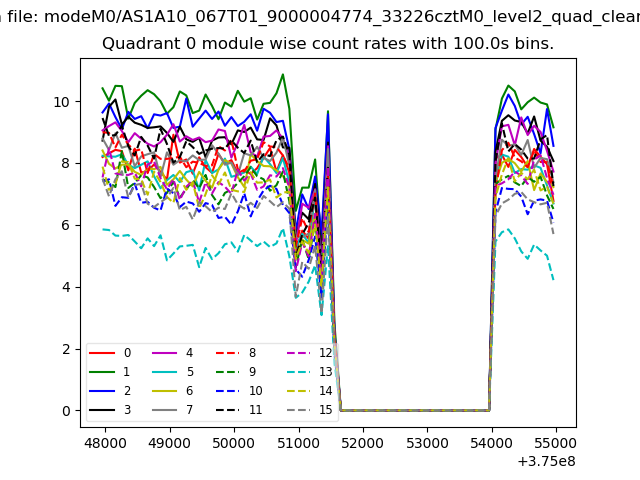 |
 |
| Module-wise count rates for Quadrant B Data is divided into 100 sec bins |
 |
 |
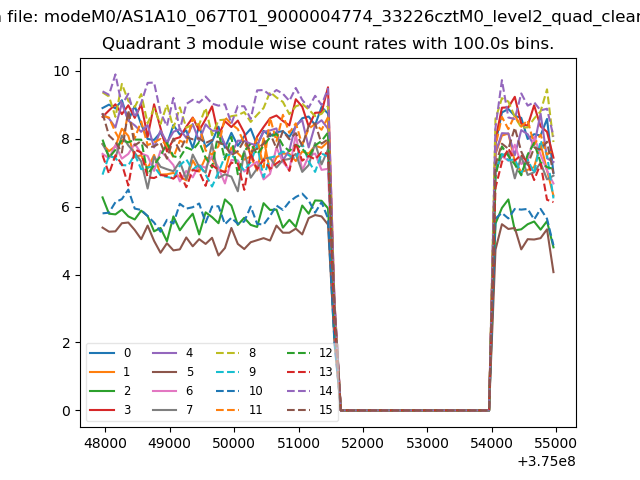
| Module-wise count rates for Quadrant C Data is divided into 100 sec bins |
 |
 |
| Module-wise count rates for Quadrant D Data is divided into 100 sec bins |
 |
 |
| Parameter | Plot |
|---|---|
| CZT HV Monitor | 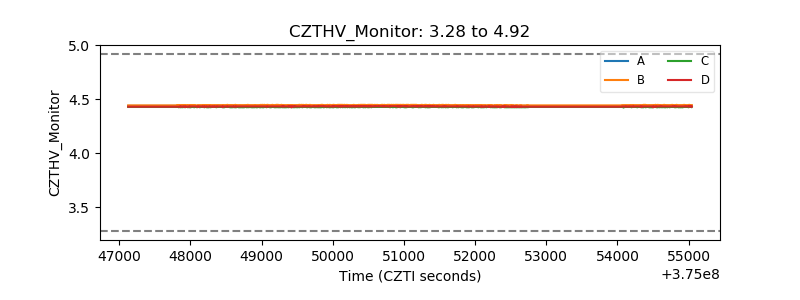 |
| D_VDD | 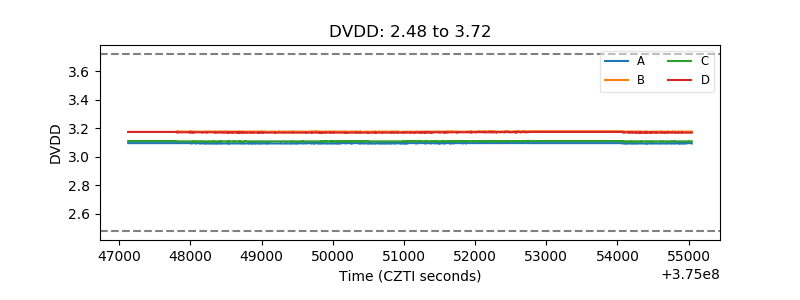 |
| Temperature 1 | 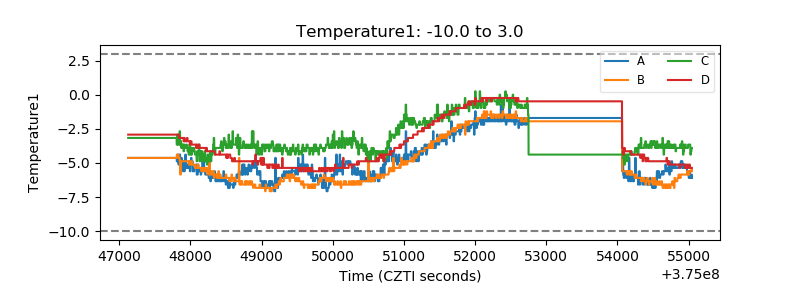 |
| Veto HV Monitor | 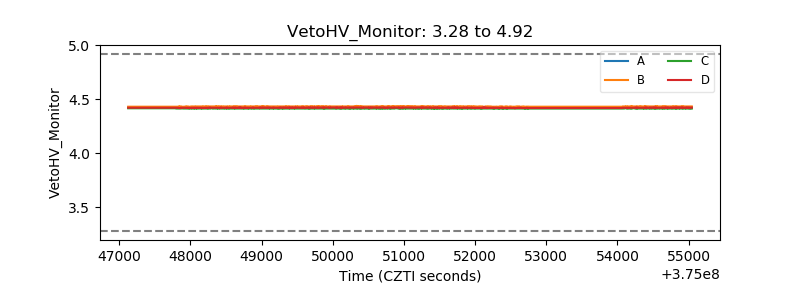 |
| Veto LLD | 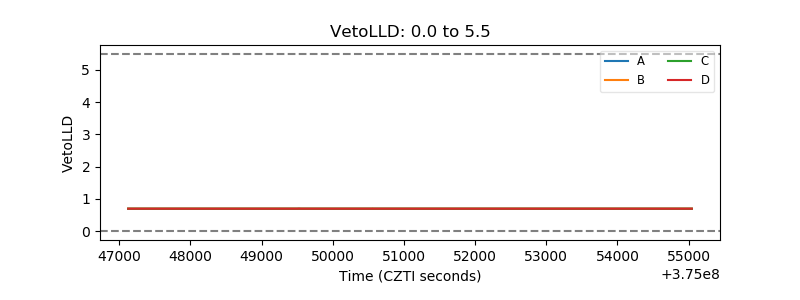 |
| Alpha Counter | 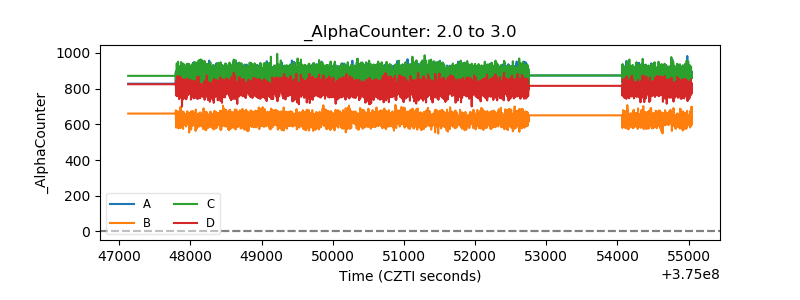 |
| _CPM_Rate | 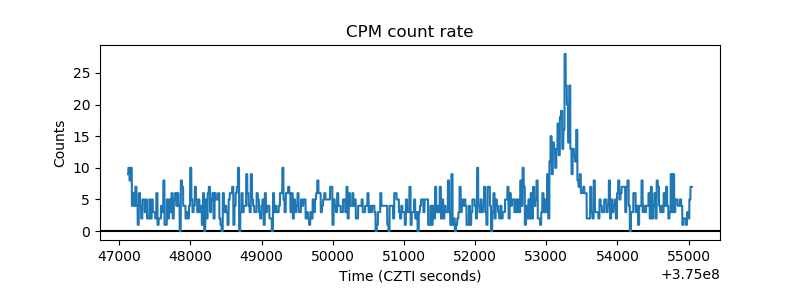 |
| CZT Counter | 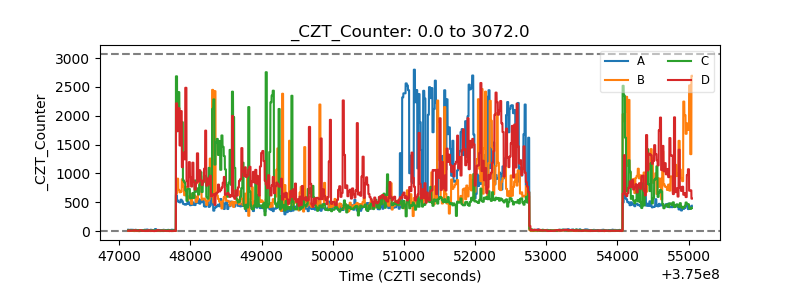 |
| +2.5 Volts monitor |  |
| +5 Volts monitor |  |
| _ROLL_ROT | 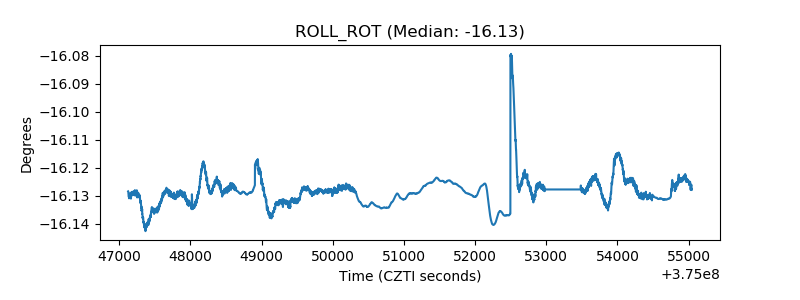 |
| _Roll_DEC | 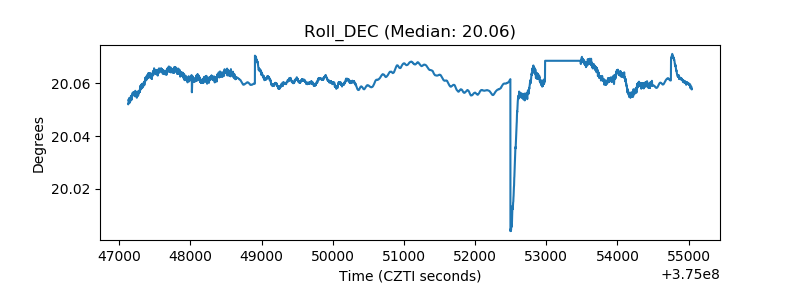 |
| _Roll_RA | 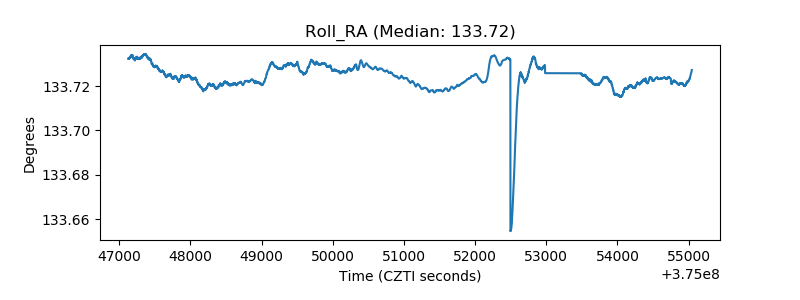 |
| Veto Counter | 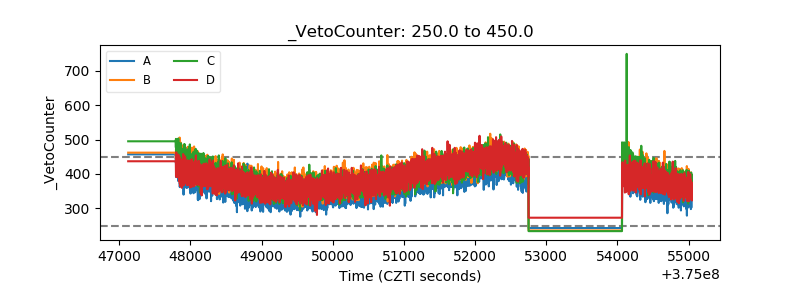 |