| Param | Original file | Final file |
|---|---|---|
| Filename | modeM0/AS1A10_067T01_9000004774_33229cztM0_level2.evt | modeM0/AS1A10_067T01_9000004774_33229cztM0_level2_quad_clean.evt |
| Size (bytes) | 1,658,476,800 | 194,814,720 |
| Size | 1.5 GB | 185.8 MB |
| Events in quadrant A | 7,204,388 | 1,247,628 |
| Events in quadrant B | 16,701,304 | 1,207,244 |
| Events in quadrant C | 8,166,473 | 1,215,506 |
| Events in quadrant D | 17,099,455 | 1,146,084 |
| Mode M9 | |||
|---|---|---|---|
| Quadrant | BADHDUFLAG | Total packets | Discarded packets |
| A | 0 | 48 | 0 |
| B | 0 | 48 | 0 |
| C | 0 | 48 | 0 |
| D | 0 | 49 | 0 |
| Mode SS | |||
|---|---|---|---|
| Quadrant | BADHDUFLAG | Total packets | Discarded packets |
| A | 0 | 320 | 0 |
| B | 0 | 320 | 0 |
| C | 0 | 320 | 0 |
| D | 0 | 320 | 0 |
| Mode M0 | |||
|---|---|---|---|
| Quadrant | BADHDUFLAG | Total packets | Discarded packets |
| A | 0 | 31869 | 5 |
| B | 0 | 60699 | 4 |
| C | 0 | 34986 | 4 |
| D | 0 | 61945 | 4 |
| Quadrant | Total seconds | Saturated seconds | Saturation percentage |
|---|---|---|---|
| A | 15707 | 23 | 0.146432% |
| B | 15707 | 2537 | 16.152034% |
| C | 15707 | 241 | 1.534348% |
| D | 15707 | 1398 | 8.900490% |
Noise dominated data is calculated using 1-second bins in cleaned event files. If a bin has >2000 counts, and if more than 50% of those come from <1% of pixels, then it is considered to be noise-dominated and hence unusable.
| Quadrant | # 1 sec bins | Bins with >0 counts | Bins with >2000 counts | High rate bins dominated by noise | Noise dominated (total time) | Noise dominated (detector-on time) | Marked lightcurve |
|---|---|---|---|---|---|---|---|
| A | 19977 | 15710 | 1 | 1 | 0.01% | 0.01% | 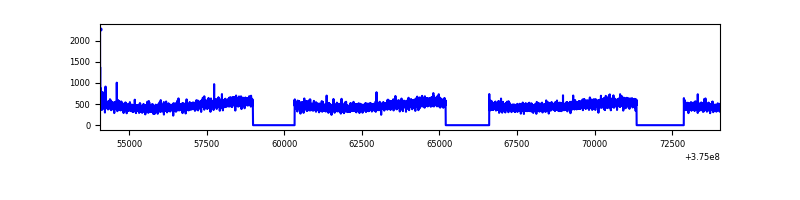 |
| B | 19977 | 15710 | 1527 | 1527 | 7.64% | 9.72% | 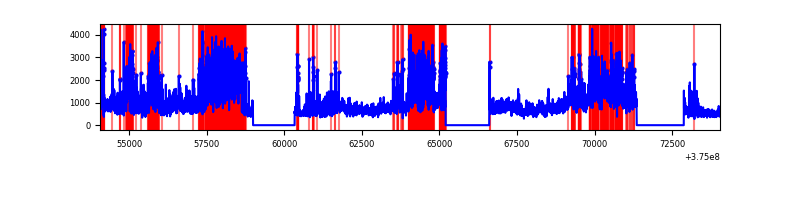 |
| C | 19977 | 15710 | 172 | 172 | 0.86% | 1.09% | 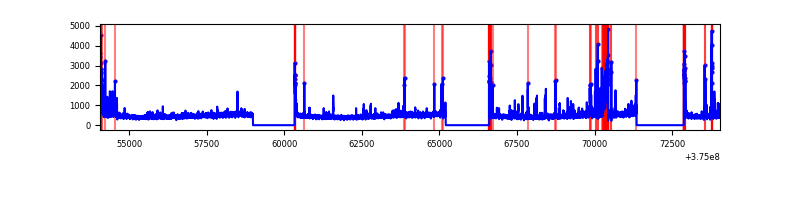 |
| D | 19977 | 15710 | 968 | 968 | 4.85% | 6.16% | 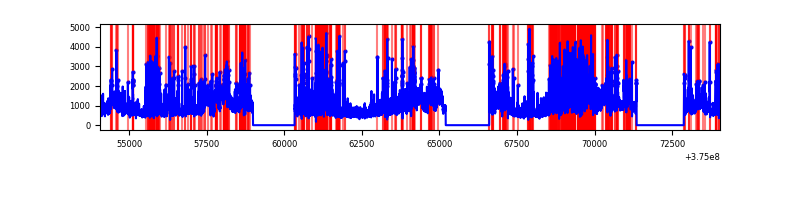 |
Top three noisy pixels from each quadrant. If the there are fewer than three noisy pixels in the level2.evt file, extra rows are filled as -1
| Pixel properties | Quadrant properties | ||||||
|---|---|---|---|---|---|---|---|
| Quadrant | DetID | PixID | Counts | Sigma | Mean | Median | Sigma |
| A | 15 | 47 | 55350 | 146.69 | 1837 | 1801 | 365.0 |
| A | 13 | 6 | 38151 | 99.58 | 1837 | 1801 | 365.0 |
| A | 13 | 254 | 26516 | 67.71 | 1837 | 1801 | 365.0 |
| B | 4 | 170 | 6549730 | 20304.99 | 1704 | 1663 | 322.5 |
| B | 5 | 172 | 2662544 | 8251.16 | 1704 | 1663 | 322.5 |
| B | 0 | 199 | 258832 | 797.46 | 1704 | 1663 | 322.5 |
| C | 14 | 254 | 583968 | 1443.95 | 1761 | 1775 | 403.2 |
| C | 0 | 10 | 314675 | 776.05 | 1761 | 1775 | 403.2 |
| C | 10 | 49 | 246422 | 606.77 | 1761 | 1775 | 403.2 |
| D | 8 | 195 | 5820130 | 12865.15 | 1723 | 1685 | 452.3 |
| D | 7 | 80 | 1465522 | 3236.69 | 1723 | 1685 | 452.3 |
| D | 2 | 250 | 1091837 | 2410.43 | 1723 | 1685 | 452.3 |
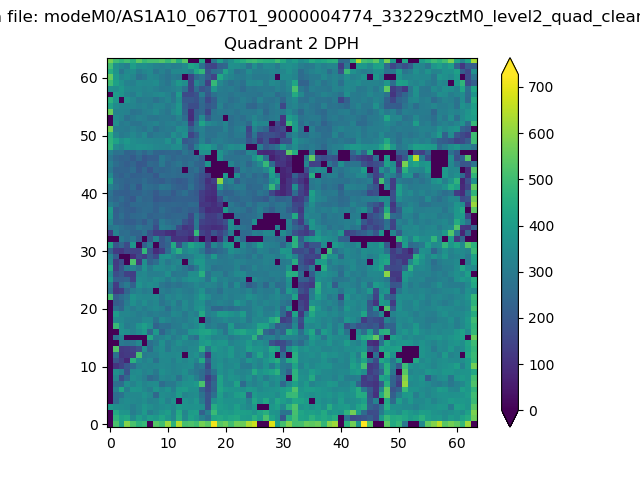
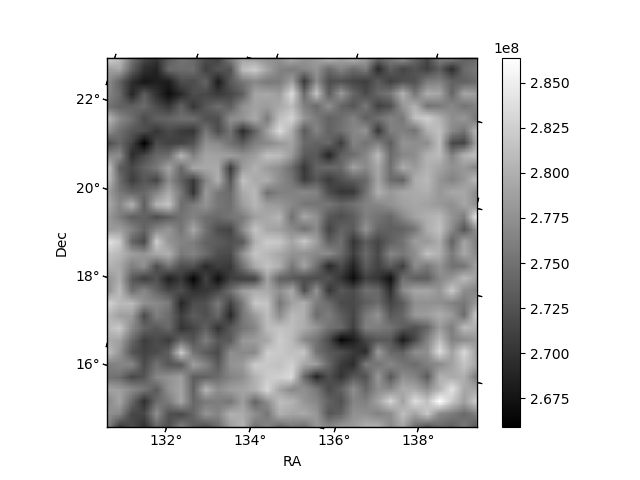
Histogram calculated using DETX and DETY for each event in the final _common_clean file
| Quadrant A |  |
 |
Quadrant B |
|---|---|---|---|
| Quadrant D | 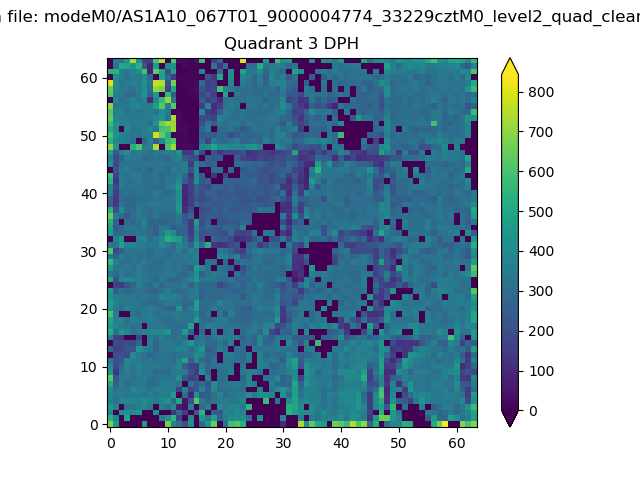 |
 |
Quadrant C |
| Plot type | Count rate plots | Images |
|---|---|---|
| Comparison with Poisson distribution Blue bars denote a histogram of data divided into 1 sec bins. Red curve is a Poisson curve with rate = median count rate of data. |
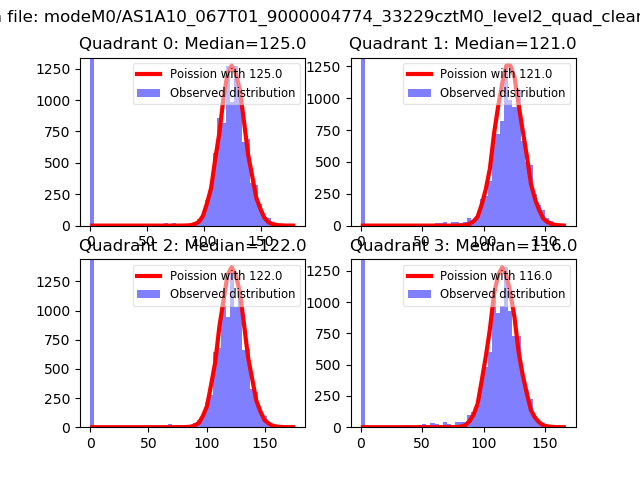 |
 |
| Quadrant-wise count rates Data is divided into 100 sec bins |
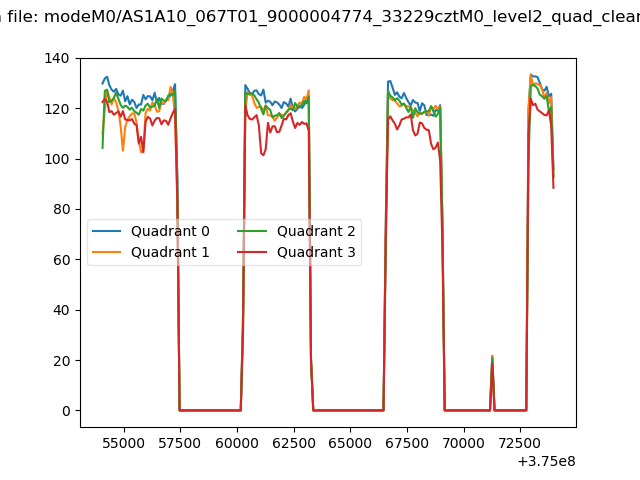 |
|
| Module-wise count rates for Quadrant A Data is divided into 100 sec bins |
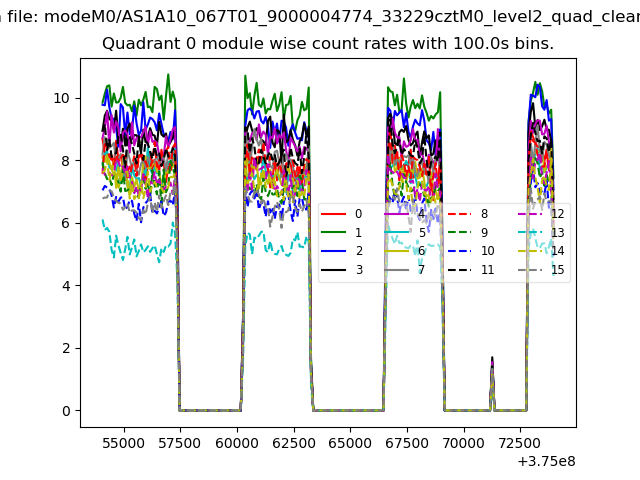 |
 |
| Module-wise count rates for Quadrant B Data is divided into 100 sec bins |
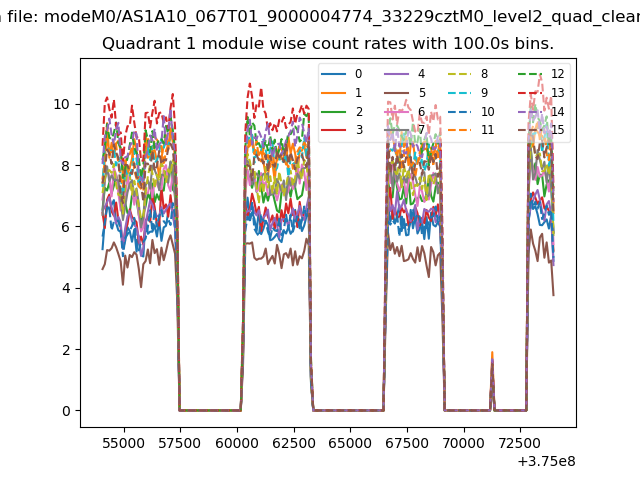 |
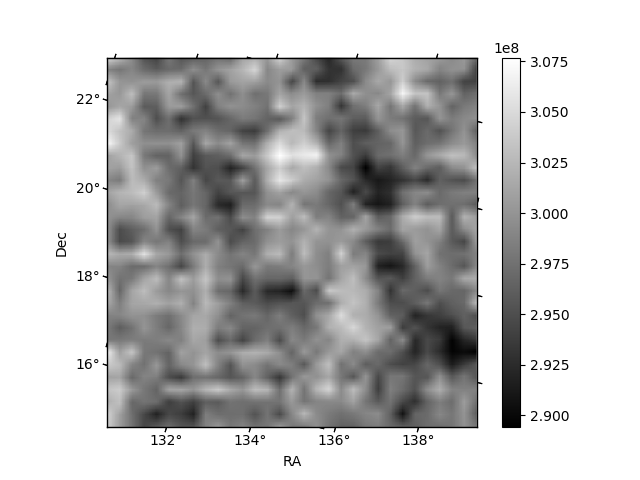 |
| Module-wise count rates for Quadrant C Data is divided into 100 sec bins |
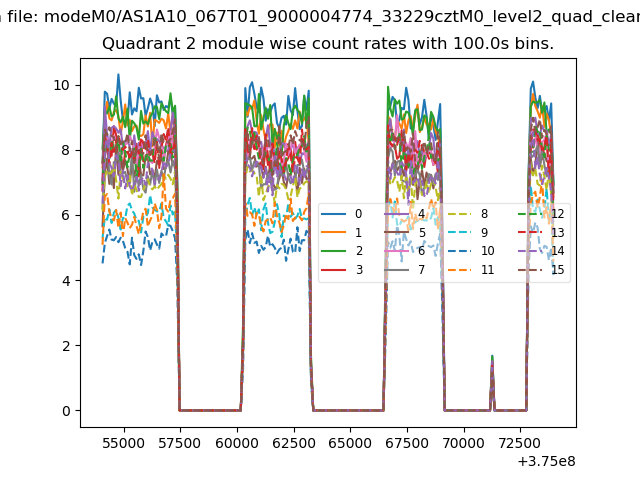 |
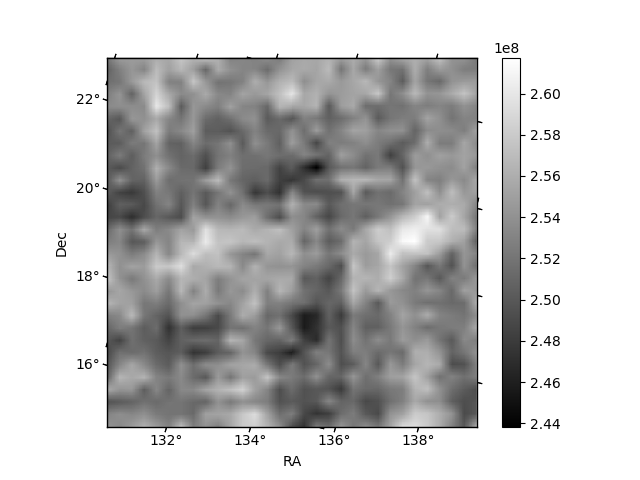 |
| Module-wise count rates for Quadrant D Data is divided into 100 sec bins |
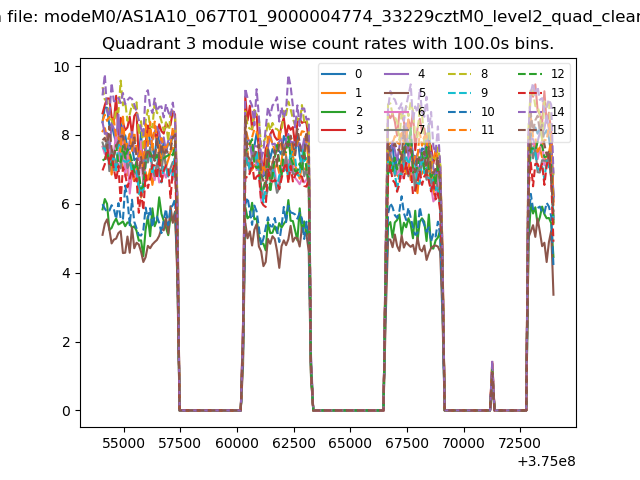 |
 |
| Parameter | Plot |
|---|---|
| CZT HV Monitor | 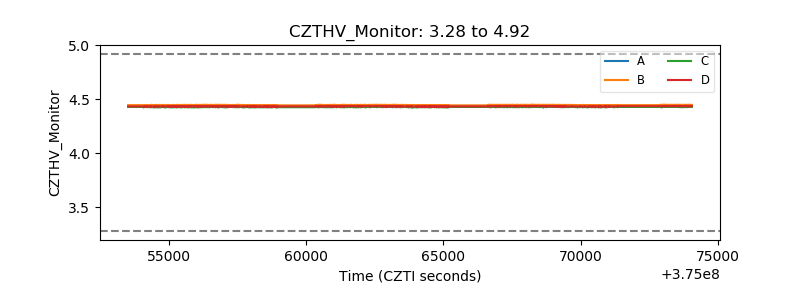 |
| D_VDD | 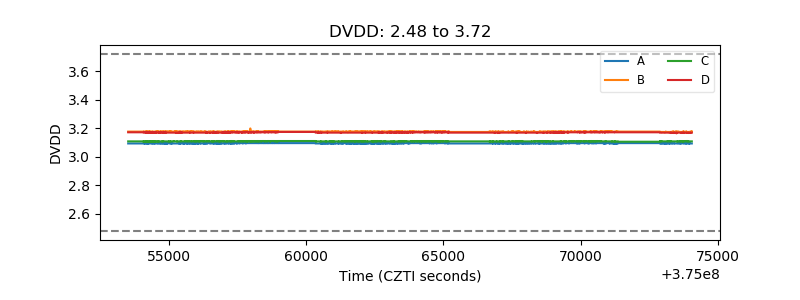 |
| Temperature 1 | 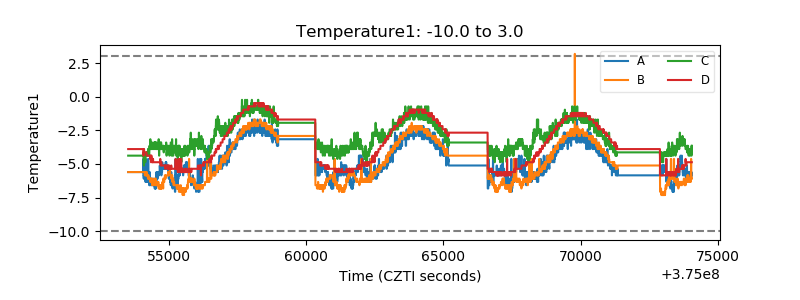 |
| Veto HV Monitor | 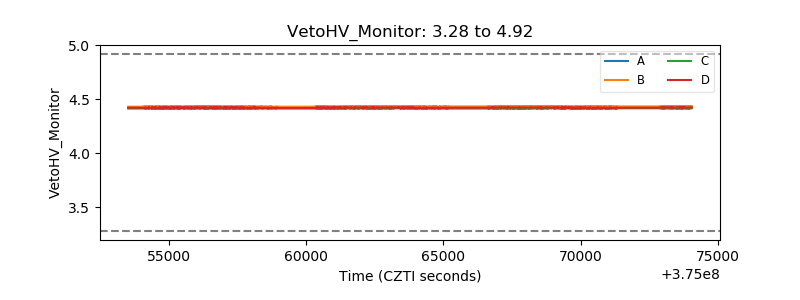 |
| Veto LLD | 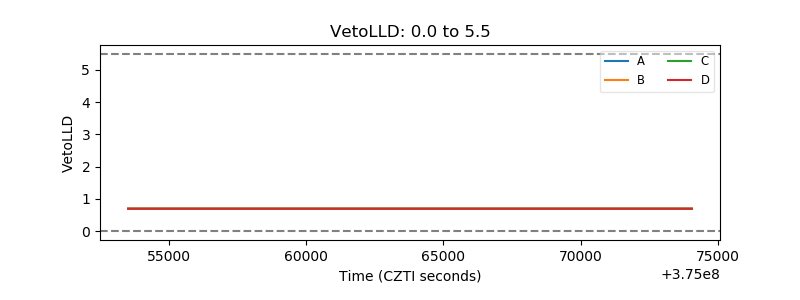 |
| Alpha Counter | 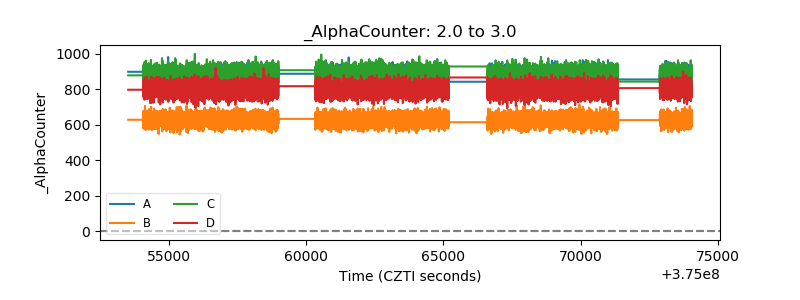 |
| _CPM_Rate |  |
| CZT Counter | 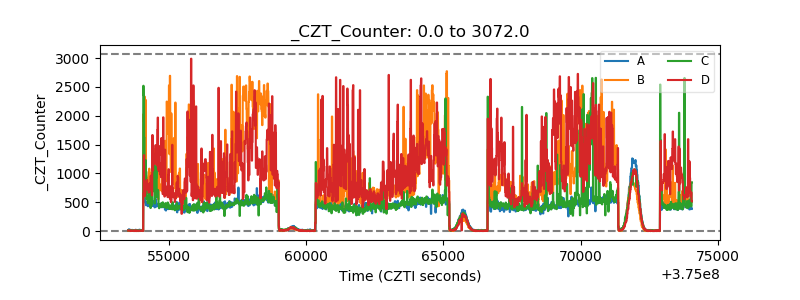 |
| +2.5 Volts monitor |  |
| +5 Volts monitor | 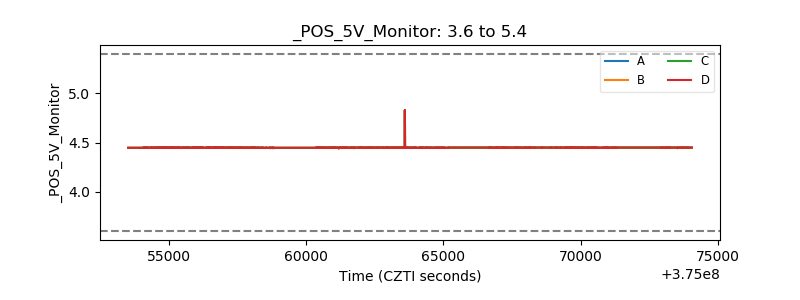 |
| _ROLL_ROT | 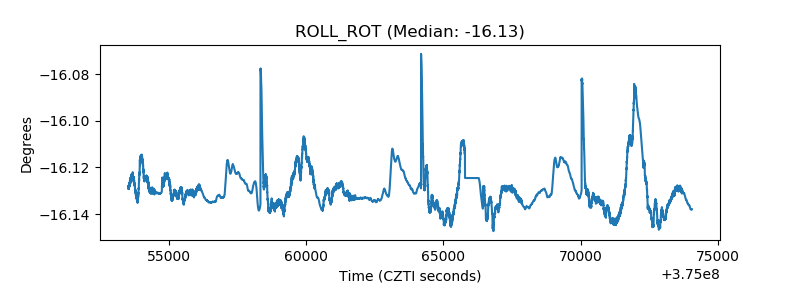 |
| _Roll_DEC | 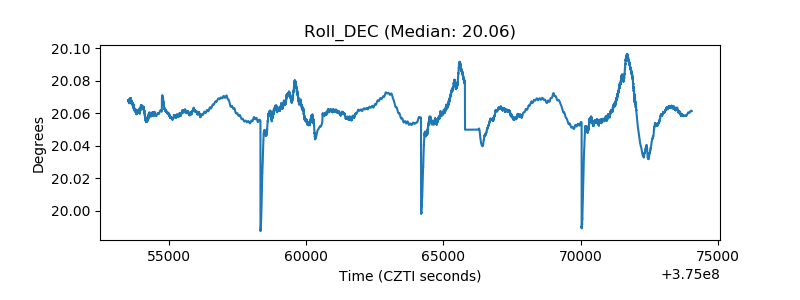 |
| _Roll_RA | 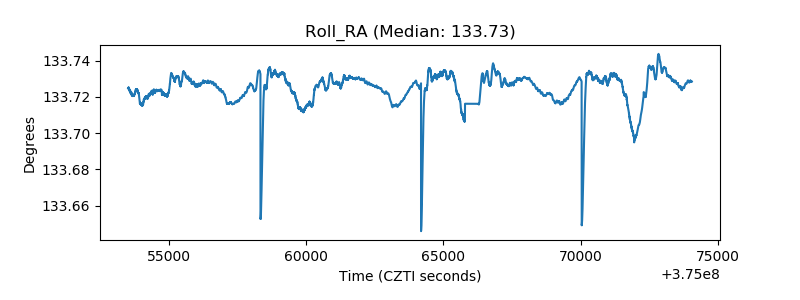 |
| Veto Counter | 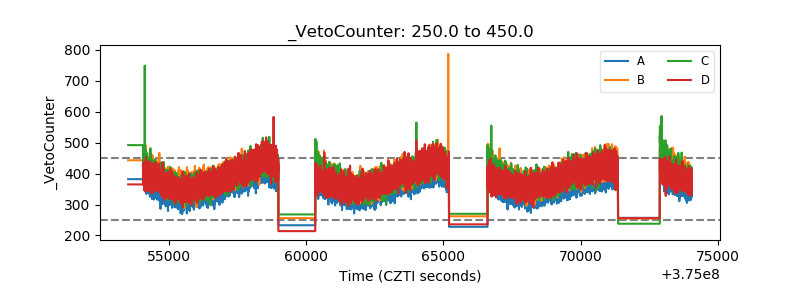 |