| Param | Original file | Final file |
|---|---|---|
| Filename | modeM0/AS1A10_067T01_9000004774_33230cztM0_level2.evt | modeM0/AS1A10_067T01_9000004774_33230cztM0_level2_quad_clean.evt |
| Size (bytes) | 520,695,360 | 69,733,440 |
| Size | 496.6 MB | 66.5 MB |
| Events in quadrant A | 2,571,632 | 443,298 |
| Events in quadrant B | 3,912,506 | 441,603 |
| Events in quadrant C | 3,531,140 | 429,503 |
| Events in quadrant D | 5,375,385 | 405,488 |
| Mode M9 | |||
|---|---|---|---|
| Quadrant | BADHDUFLAG | Total packets | Discarded packets |
| A | 0 | 25 | 0 |
| B | 0 | 25 | 0 |
| C | 0 | 25 | 0 |
| D | 0 | 26 | 0 |
| Mode SS | |||
|---|---|---|---|
| Quadrant | BADHDUFLAG | Total packets | Discarded packets |
| A | 0 | 112 | 0 |
| B | 0 | 112 | 0 |
| C | 0 | 112 | 0 |
| D | 0 | 112 | 0 |
| Mode M0 | |||
|---|---|---|---|
| Quadrant | BADHDUFLAG | Total packets | Discarded packets |
| A | 0 | 11258 | 3 |
| B | 0 | 15412 | 2 |
| C | 0 | 14275 | 2 |
| D | 0 | 19944 | 2 |
| Quadrant | Total seconds | Saturated seconds | Saturation percentage |
|---|---|---|---|
| A | 5602 | 2 | 0.035702% |
| B | 5602 | 149 | 2.659764% |
| C | 5602 | 116 | 2.070689% |
| D | 5602 | 270 | 4.819707% |
Noise dominated data is calculated using 1-second bins in cleaned event files. If a bin has >2000 counts, and if more than 50% of those come from <1% of pixels, then it is considered to be noise-dominated and hence unusable.
| Quadrant | # 1 sec bins | Bins with >0 counts | Bins with >2000 counts | High rate bins dominated by noise | Noise dominated (total time) | Noise dominated (detector-on time) | Marked lightcurve |
|---|---|---|---|---|---|---|---|
| A | 7245 | 5603 | 0 | 0 | 0.00% | 0.00% | 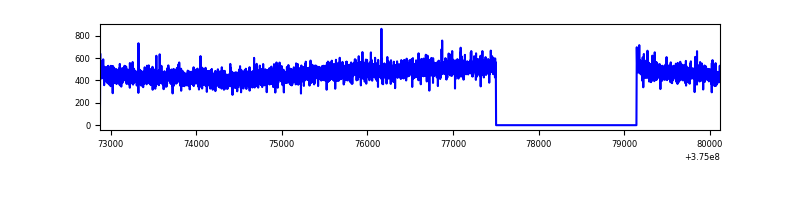 |
| B | 7245 | 5603 | 89 | 89 | 1.23% | 1.59% | 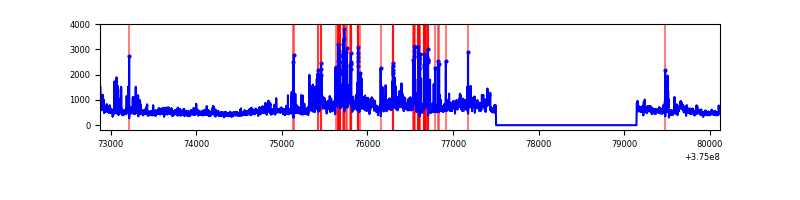 |
| C | 7245 | 5603 | 101 | 101 | 1.39% | 1.80% | 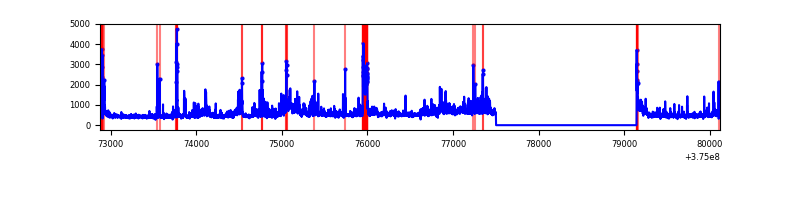 |
| D | 7245 | 5603 | 206 | 206 | 2.84% | 3.68% | 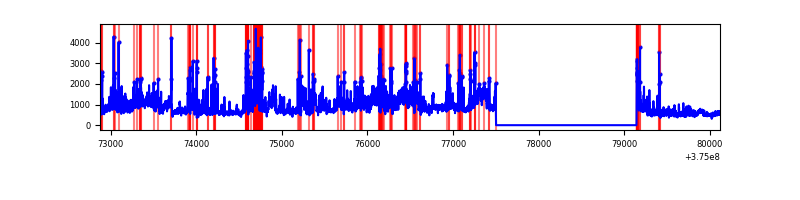 |
Top three noisy pixels from each quadrant. If the there are fewer than three noisy pixels in the level2.evt file, extra rows are filled as -1
| Pixel properties | Quadrant properties | ||||||
|---|---|---|---|---|---|---|---|
| Quadrant | DetID | PixID | Counts | Sigma | Mean | Median | Sigma |
| A | 13 | 6 | 13015 | 92.83 | 662 | 649 | 133.2 |
| A | 13 | 254 | 8661 | 60.14 | 662 | 649 | 133.2 |
| A | 3 | 137 | 6315 | 42.53 | 662 | 649 | 133.2 |
| B | 4 | 170 | 779325 | 6270.46 | 648 | 632 | 124.2 |
| B | 5 | 172 | 426011 | 3425.38 | 648 | 632 | 124.2 |
| B | 0 | 199 | 35035 | 277.03 | 648 | 632 | 124.2 |
| C | 10 | 49 | 399908 | 2694.64 | 632 | 636 | 148.2 |
| C | 14 | 254 | 274240 | 1846.52 | 632 | 636 | 148.2 |
| C | 1 | 23 | 183338 | 1233.03 | 632 | 636 | 148.2 |
| D | 8 | 195 | 1672707 | 10877.32 | 631 | 615 | 153.7 |
| D | 7 | 80 | 281825 | 1829.33 | 631 | 615 | 153.7 |
| D | 2 | 250 | 247809 | 1608.05 | 631 | 615 | 153.7 |
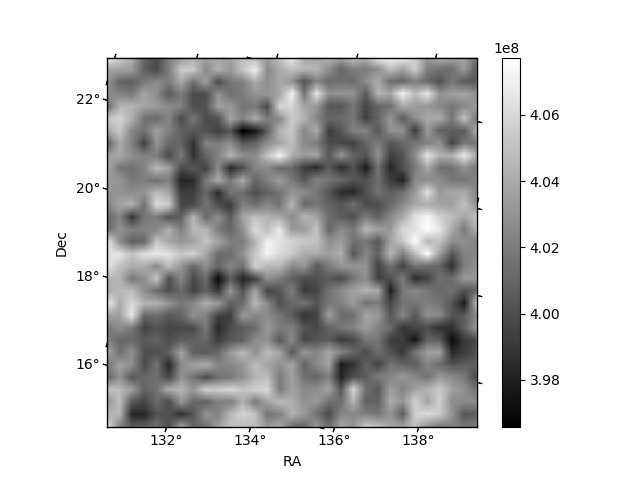
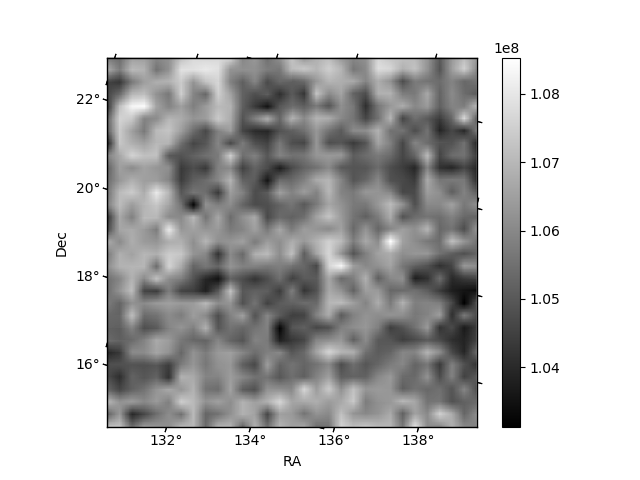
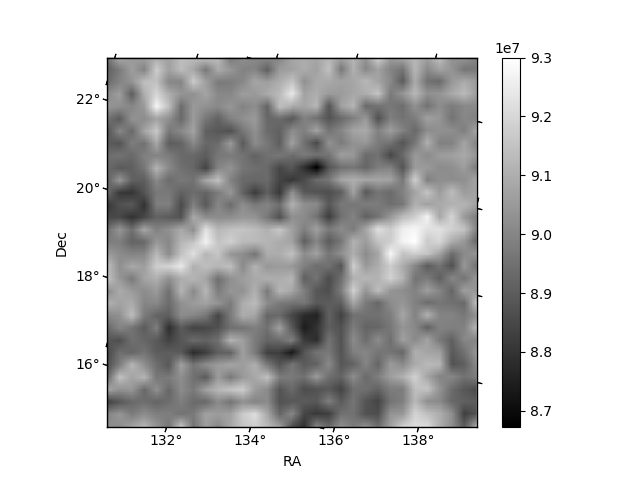
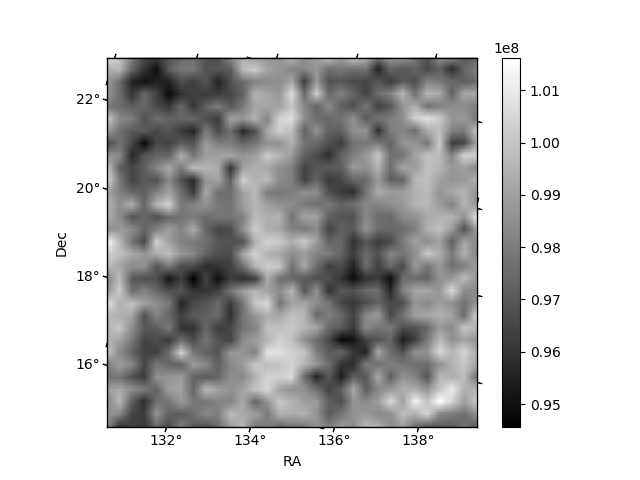
Histogram calculated using DETX and DETY for each event in the final _common_clean file
| Quadrant A | 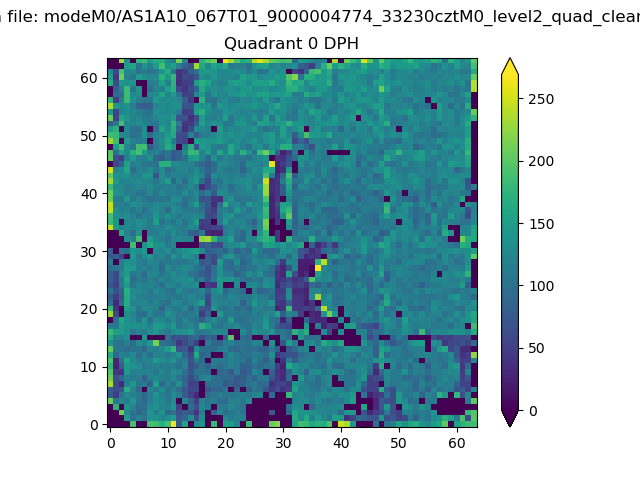 |
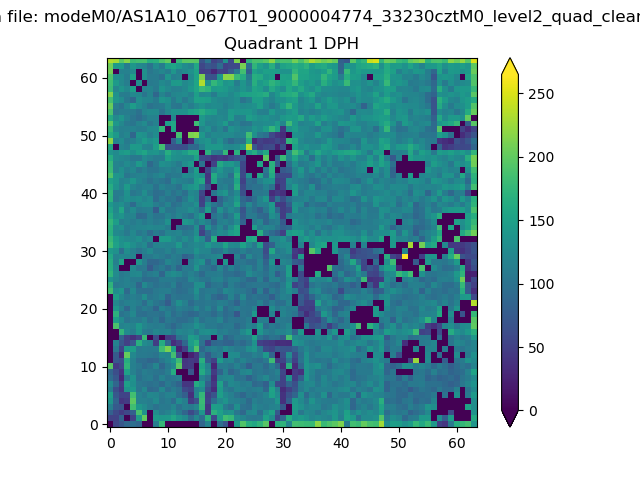 |
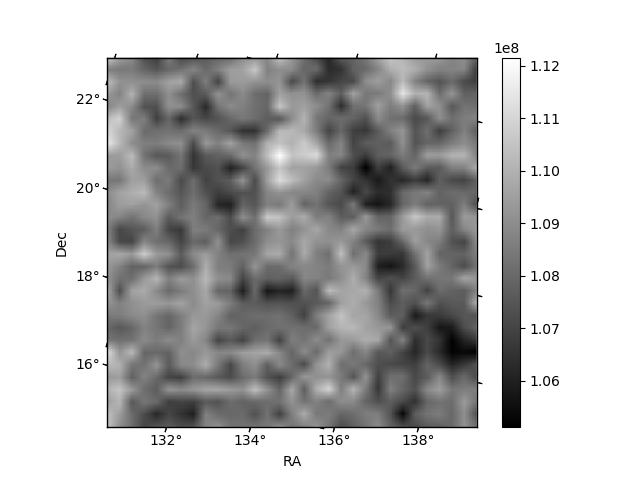
Quadrant B |
|---|---|---|---|
| Quadrant D | 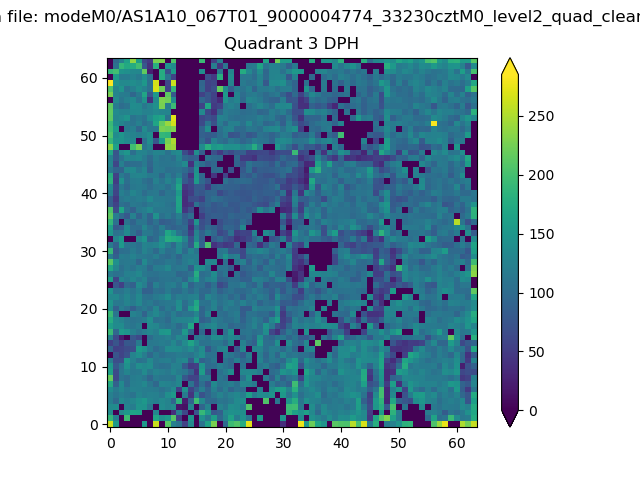 |
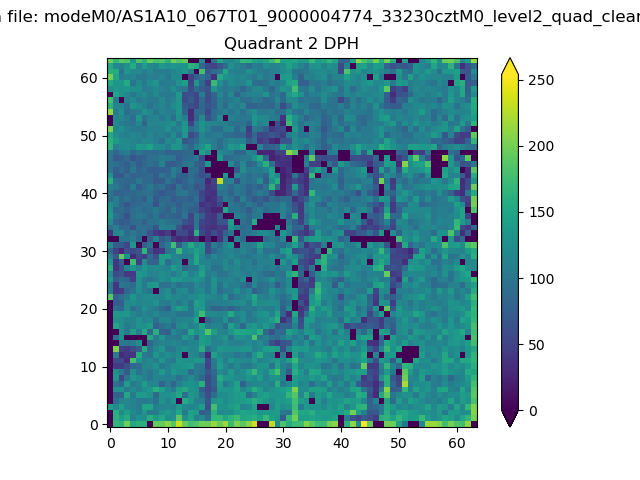 |
Quadrant C |
| Plot type | Count rate plots | Images |
|---|---|---|
| Comparison with Poisson distribution Blue bars denote a histogram of data divided into 1 sec bins. Red curve is a Poisson curve with rate = median count rate of data. |
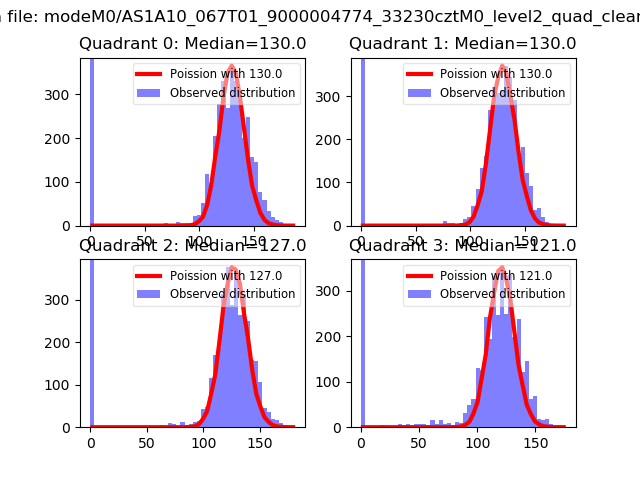 |
 |
| Quadrant-wise count rates Data is divided into 100 sec bins |
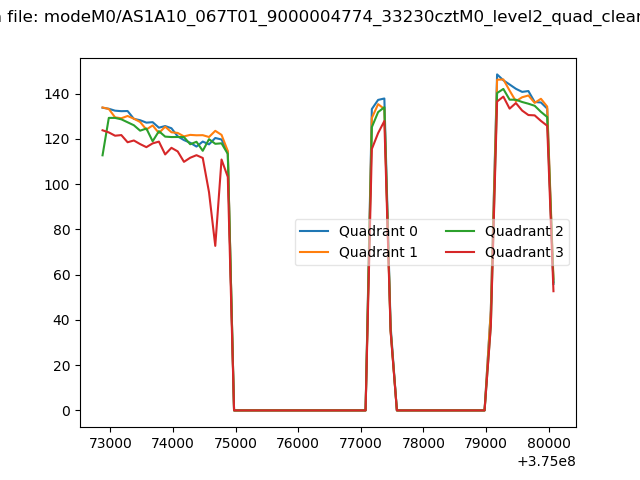 |
|
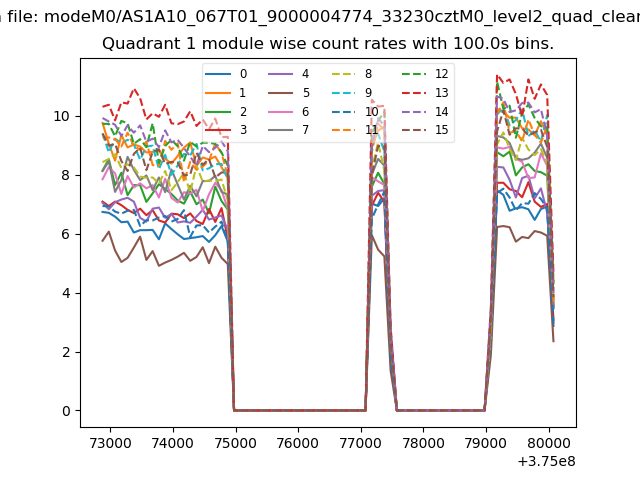
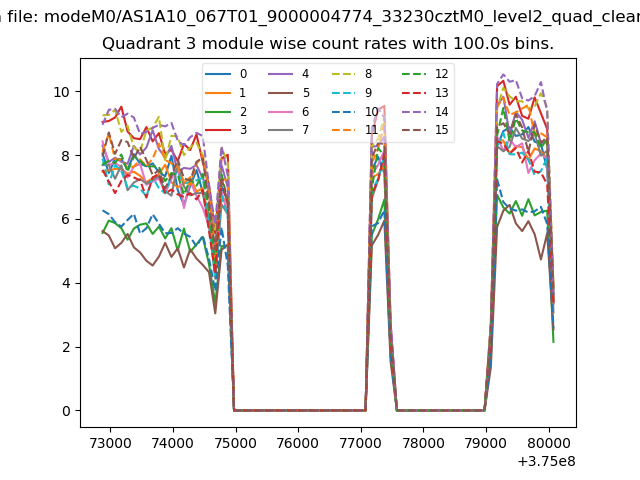
| Module-wise count rates for Quadrant A Data is divided into 100 sec bins |
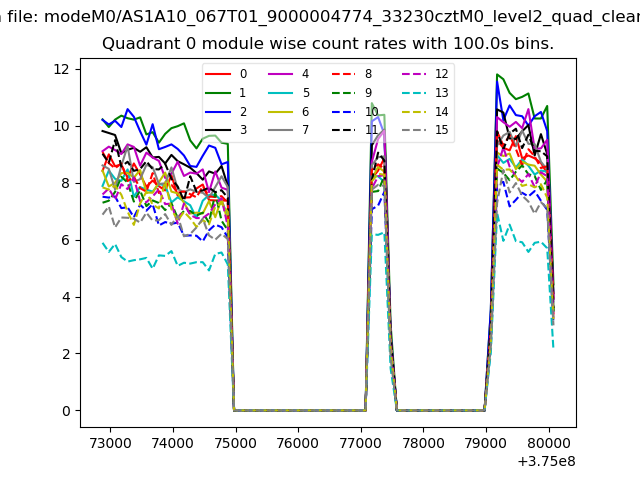 |
 |
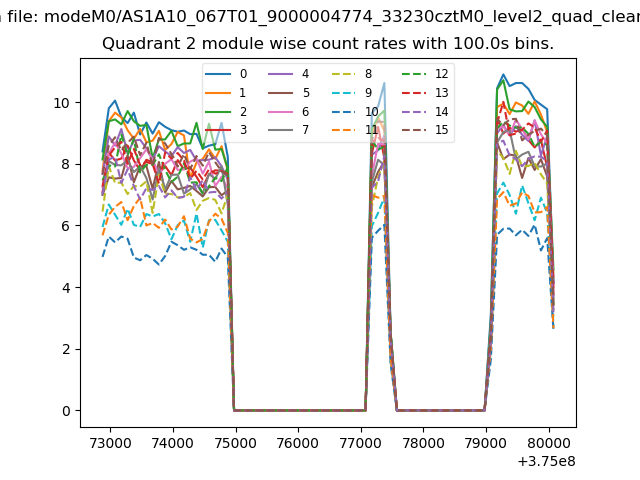
| Module-wise count rates for Quadrant B Data is divided into 100 sec bins |
 |
 |
| Module-wise count rates for Quadrant C Data is divided into 100 sec bins |
 |
 |
| Module-wise count rates for Quadrant D Data is divided into 100 sec bins |
 |
 |
| Parameter | Plot |
|---|---|
| CZT HV Monitor | 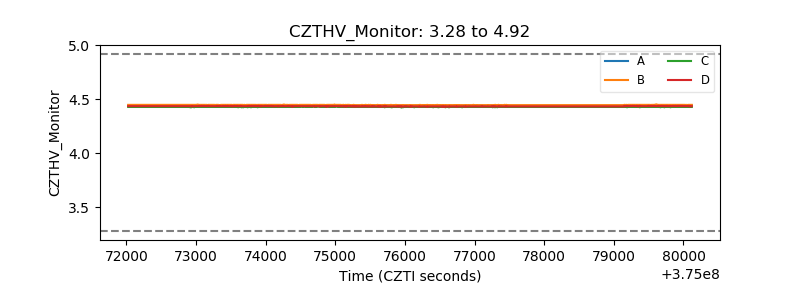 |
| D_VDD | 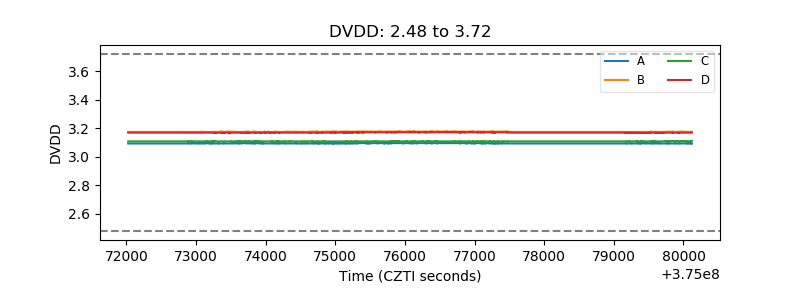 |
| Temperature 1 | 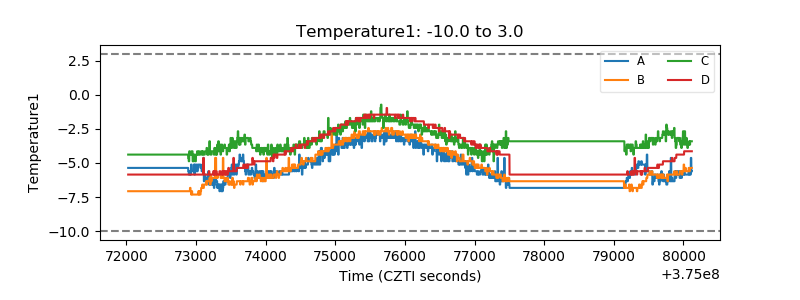 |
| Veto HV Monitor | 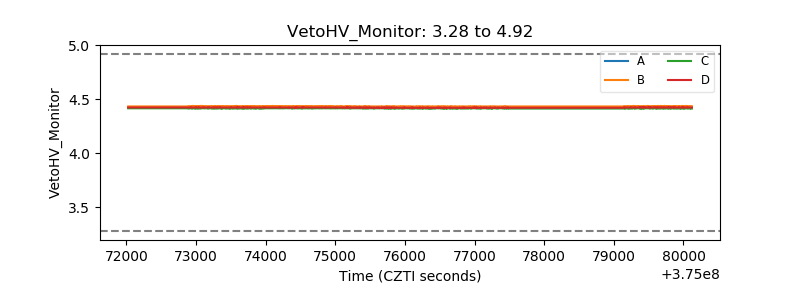 |
| Veto LLD | 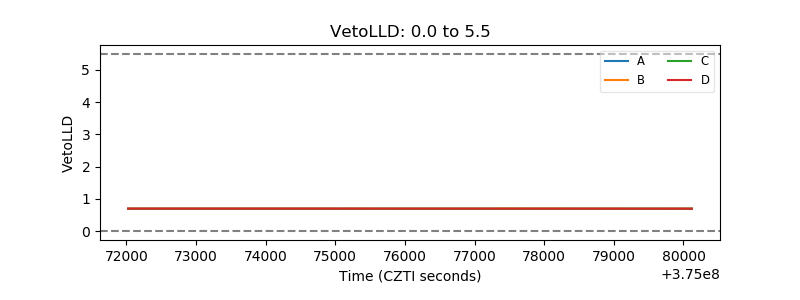 |
| Alpha Counter | 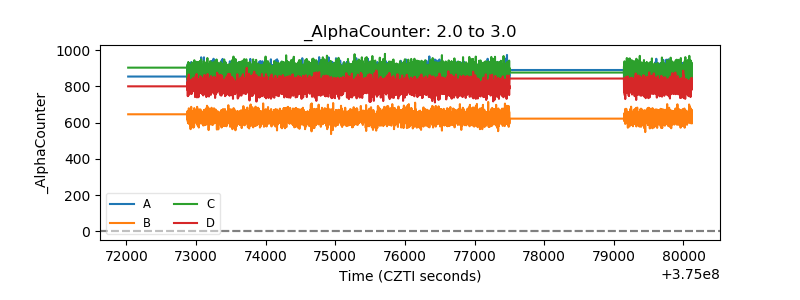 |
| _CPM_Rate | 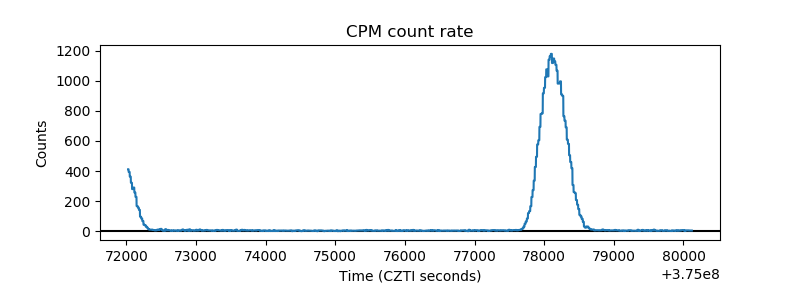 |
| CZT Counter | 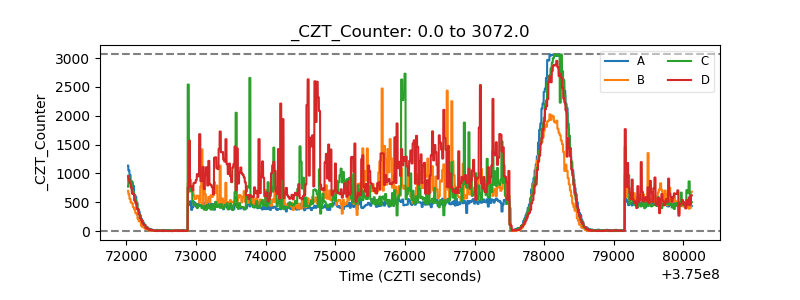 |
| +2.5 Volts monitor | 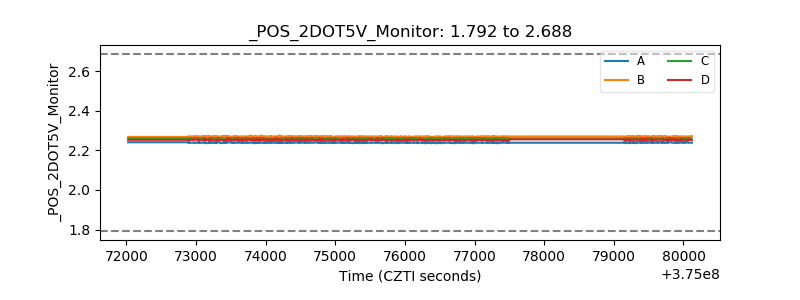 |
| +5 Volts monitor | 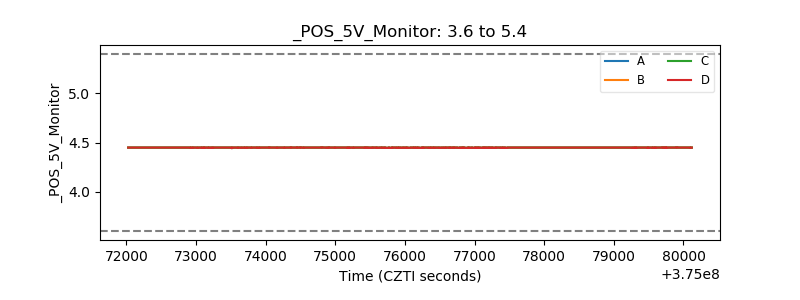 |
| _ROLL_ROT | 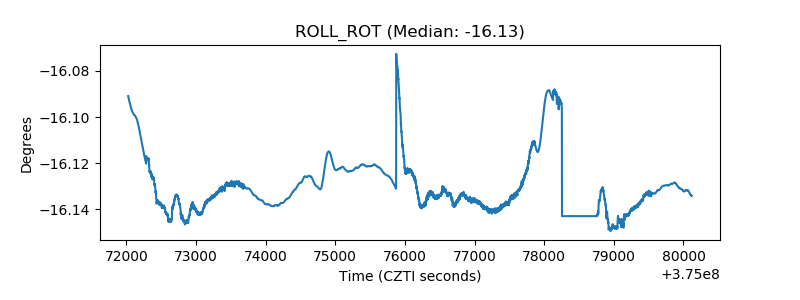 |
| _Roll_DEC | 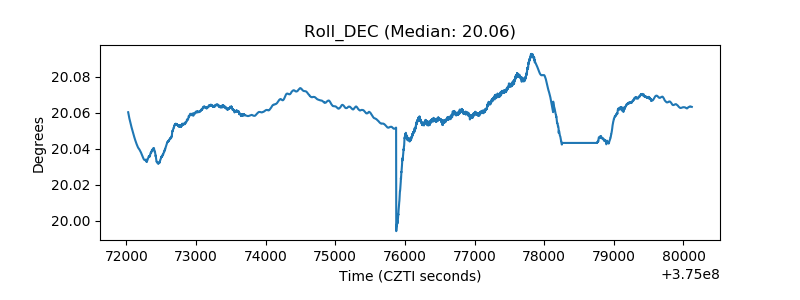 |
| _Roll_RA | 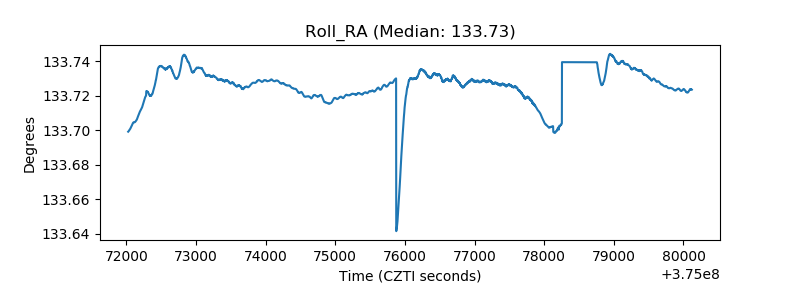 |
| Veto Counter | 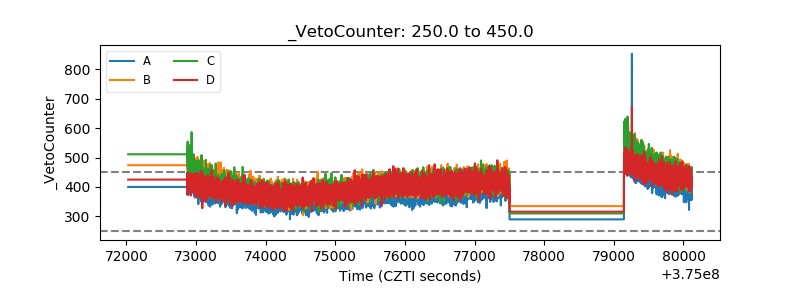 |