| Param | Original file | Final file |
|---|---|---|
| Filename | modeM0/AS1A10_067T01_9000004774_33234cztM0_level2.evt | modeM0/AS1A10_067T01_9000004774_33234cztM0_level2_quad_clean.evt |
| Size (bytes) | 471,084,480 | 61,522,560 |
| Size | 449.3 MB | 58.7 MB |
| Events in quadrant A | 2,640,114 | 393,033 |
| Events in quadrant B | 3,605,302 | 388,013 |
| Events in quadrant C | 2,937,496 | 380,400 |
| Events in quadrant D | 4,748,076 | 353,717 |
| Mode M9 | |||
|---|---|---|---|
| Quadrant | BADHDUFLAG | Total packets | Discarded packets |
| A | 0 | 23 | 0 |
| B | 0 | 23 | 0 |
| C | 0 | 23 | 0 |
| D | 0 | 24 | 0 |
| Mode SS | |||
|---|---|---|---|
| Quadrant | BADHDUFLAG | Total packets | Discarded packets |
| A | 0 | 100 | 0 |
| B | 0 | 100 | 0 |
| C | 0 | 100 | 0 |
| D | 0 | 100 | 0 |
| Mode M0 | |||
|---|---|---|---|
| Quadrant | BADHDUFLAG | Total packets | Discarded packets |
| A | 0 | 10557 | 3 |
| B | 0 | 13992 | 2 |
| C | 0 | 11623 | 2 |
| D | 0 | 17867 | 2 |
| Quadrant | Total seconds | Saturated seconds | Saturation percentage |
|---|---|---|---|
| A | 4957 | 9 | 0.181561% |
| B | 4957 | 232 | 4.680250% |
| C | 4957 | 51 | 1.028848% |
| D | 4957 | 409 | 8.250958% |
Noise dominated data is calculated using 1-second bins in cleaned event files. If a bin has >2000 counts, and if more than 50% of those come from <1% of pixels, then it is considered to be noise-dominated and hence unusable.
| Quadrant | # 1 sec bins | Bins with >0 counts | Bins with >2000 counts | High rate bins dominated by noise | Noise dominated (total time) | Noise dominated (detector-on time) | Marked lightcurve |
|---|---|---|---|---|---|---|---|
| A | 6990 | 4958 | 0 | 0 | 0.00% | 0.00% | 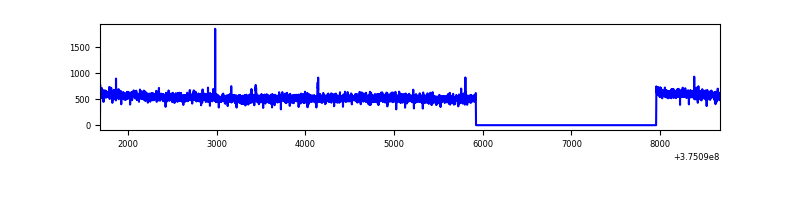 |
| B | 6990 | 4958 | 145 | 145 | 2.07% | 2.92% | 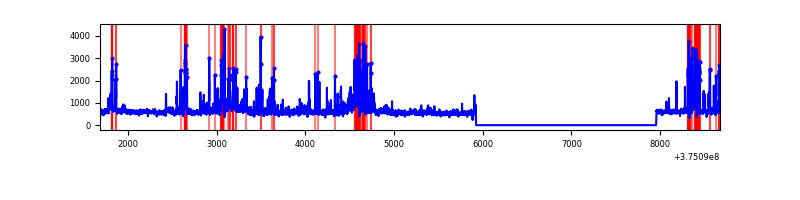 |
| C | 6990 | 4958 | 51 | 51 | 0.73% | 1.03% | 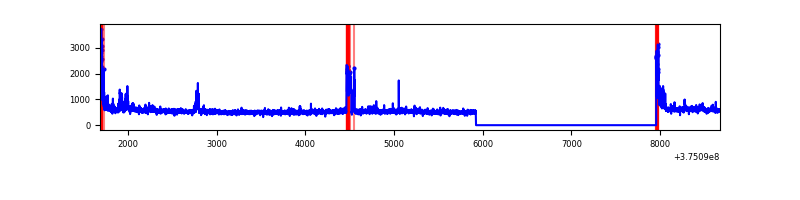 |
| D | 6990 | 4958 | 316 | 316 | 4.52% | 6.37% | 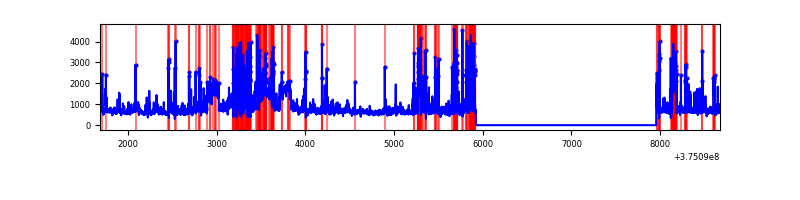 |
Top three noisy pixels from each quadrant. If the there are fewer than three noisy pixels in the level2.evt file, extra rows are filled as -1
| Pixel properties | Quadrant properties | ||||||
|---|---|---|---|---|---|---|---|
| Quadrant | DetID | PixID | Counts | Sigma | Mean | Median | Sigma |
| A | 15 | 47 | 19040 | 138.32 | 674 | 663 | 132.9 |
| A | 13 | 6 | 13939 | 99.93 | 674 | 663 | 132.9 |
| A | 13 | 254 | 8484 | 58.87 | 674 | 663 | 132.9 |
| B | 5 | 172 | 604486 | 4932.18 | 649 | 634 | 122.4 |
| B | 4 | 170 | 179636 | 1462.06 | 649 | 634 | 122.4 |
| B | 0 | 219 | 118051 | 959.05 | 649 | 634 | 122.4 |
| C | 0 | 10 | 148023 | 990.07 | 645 | 652 | 148.8 |
| C | 10 | 49 | 143184 | 957.57 | 645 | 652 | 148.8 |
| C | 3 | 233 | 93515 | 623.88 | 645 | 652 | 148.8 |
| D | 8 | 195 | 793232 | 5093.9 | 634 | 617 | 155.6 |
| D | 7 | 80 | 702888 | 4513.29 | 634 | 617 | 155.6 |
| D | 10 | 203 | 191973 | 1229.79 | 634 | 617 | 155.6 |
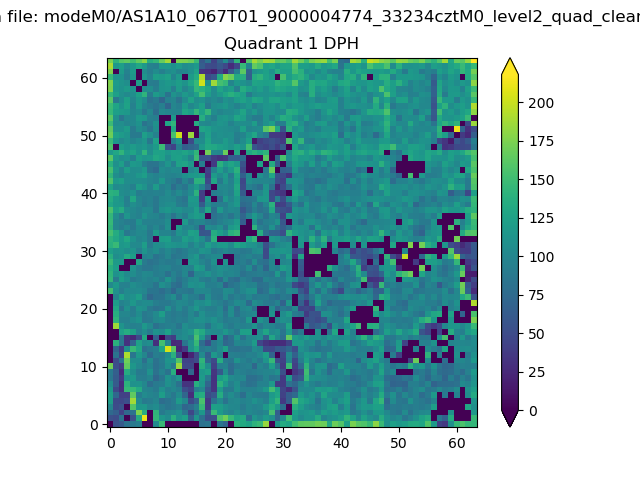
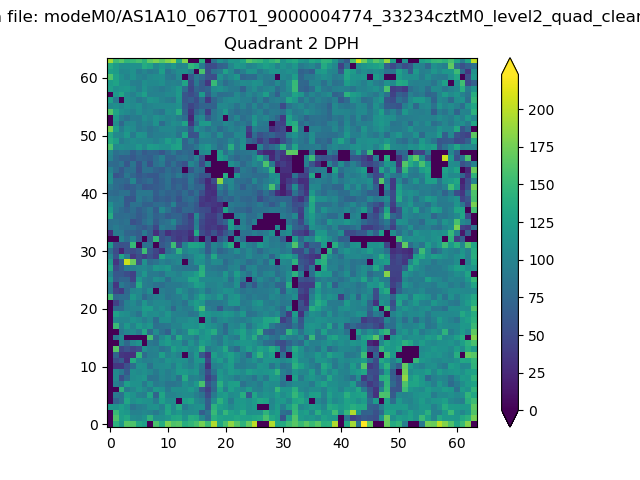
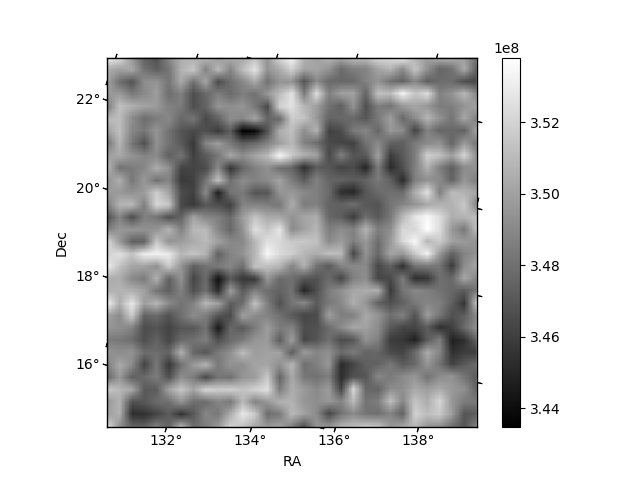
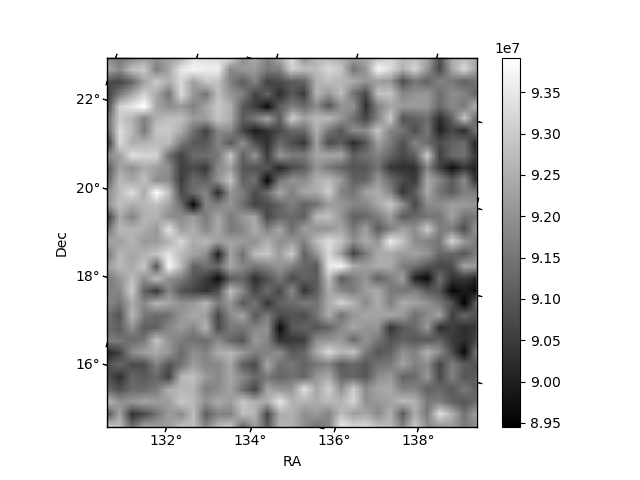
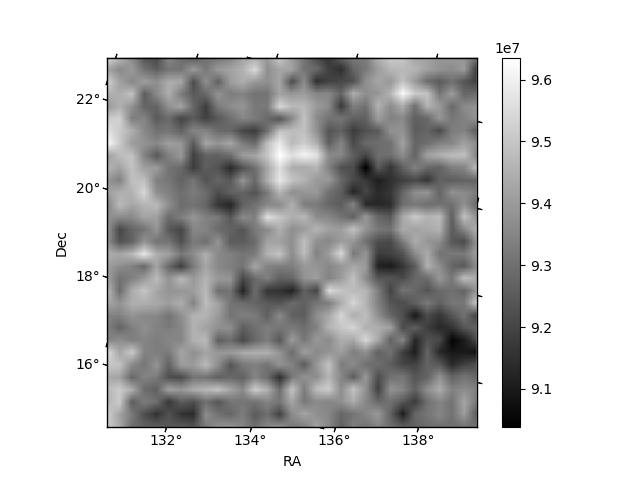
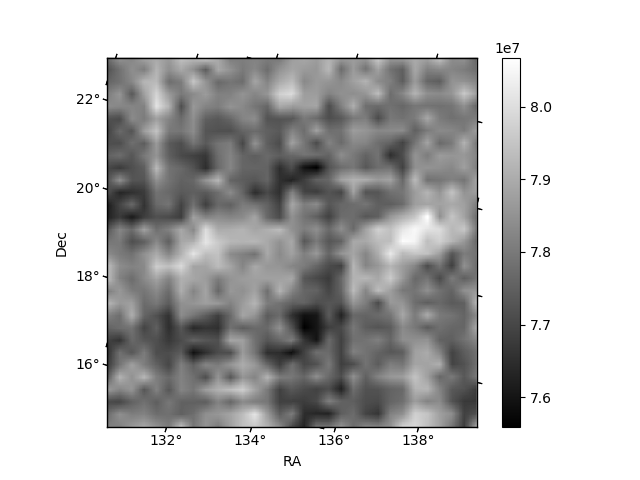
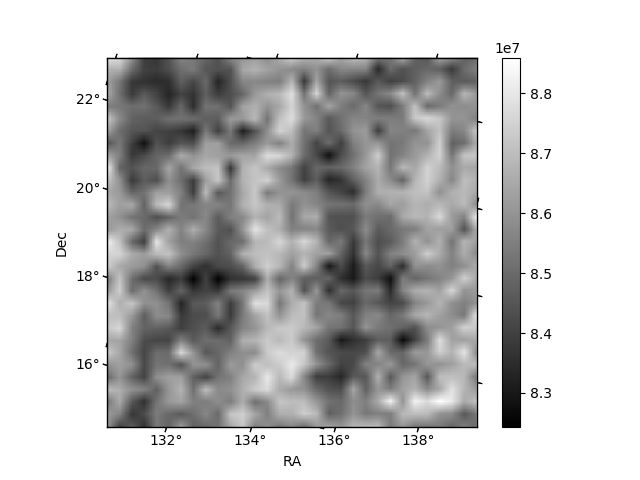
Histogram calculated using DETX and DETY for each event in the final _common_clean file
| Quadrant A |  |
 |
Quadrant B |
|---|---|---|---|
| Quadrant D | 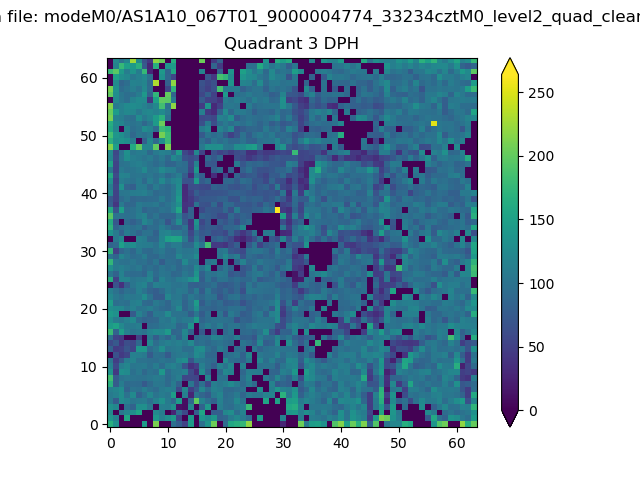 |
 |
Quadrant C |
| Plot type | Count rate plots | Images |
|---|---|---|
| Comparison with Poisson distribution Blue bars denote a histogram of data divided into 1 sec bins. Red curve is a Poisson curve with rate = median count rate of data. |
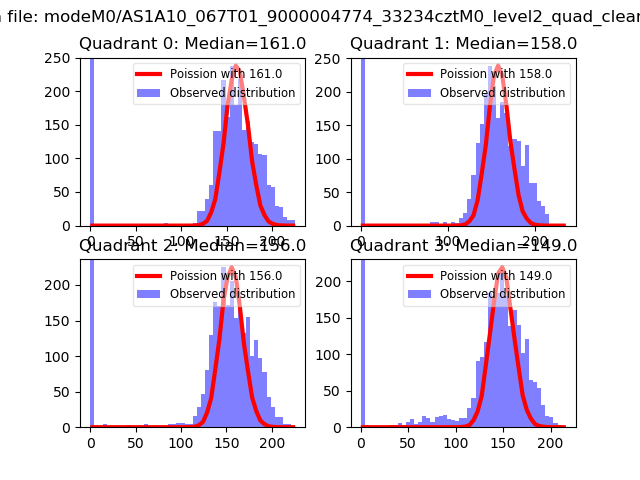 |
 |
| Quadrant-wise count rates Data is divided into 100 sec bins |
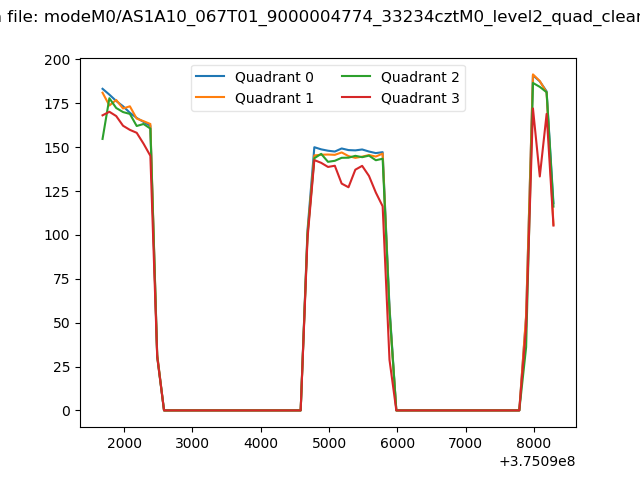 |
|
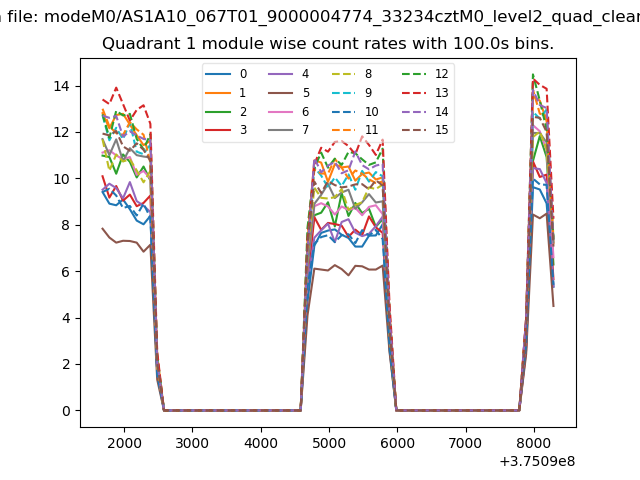
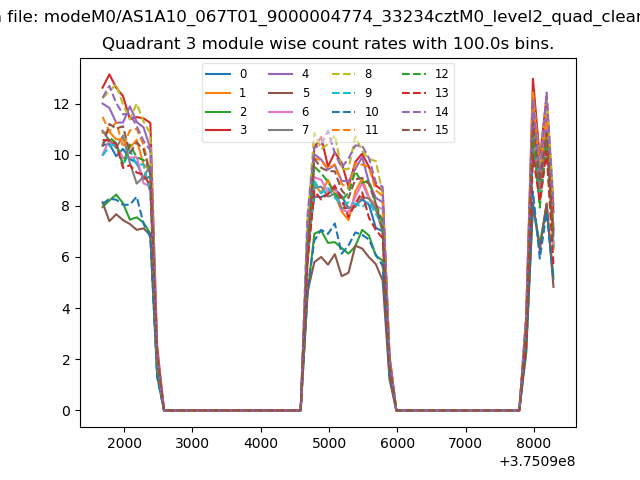
| Module-wise count rates for Quadrant A Data is divided into 100 sec bins |
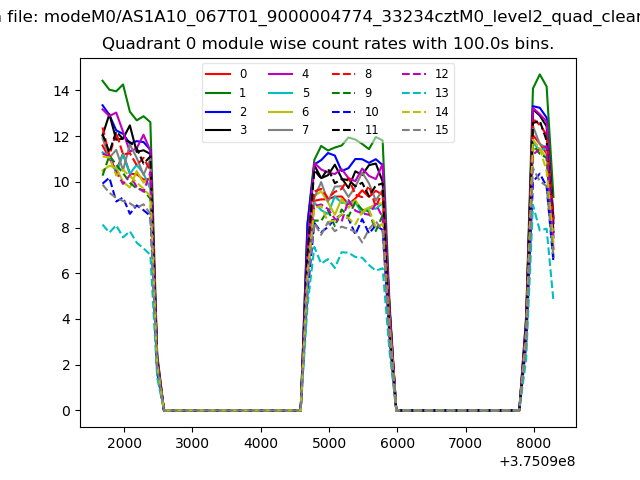 |
 |
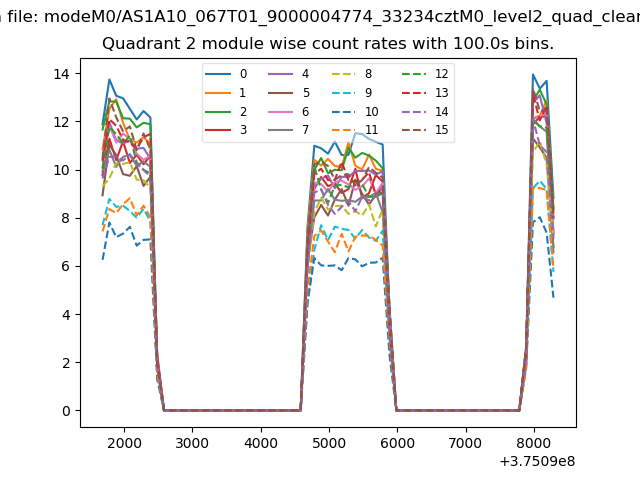
| Module-wise count rates for Quadrant B Data is divided into 100 sec bins |
 |
 |
| Module-wise count rates for Quadrant C Data is divided into 100 sec bins |
 |
 |
| Module-wise count rates for Quadrant D Data is divided into 100 sec bins |
 |
 |
| Parameter | Plot |
|---|---|
| CZT HV Monitor | 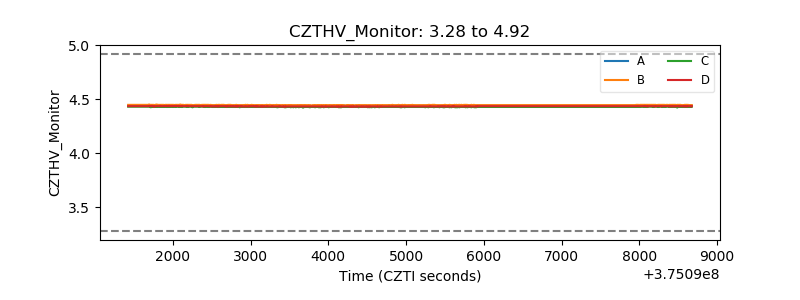 |
| D_VDD | 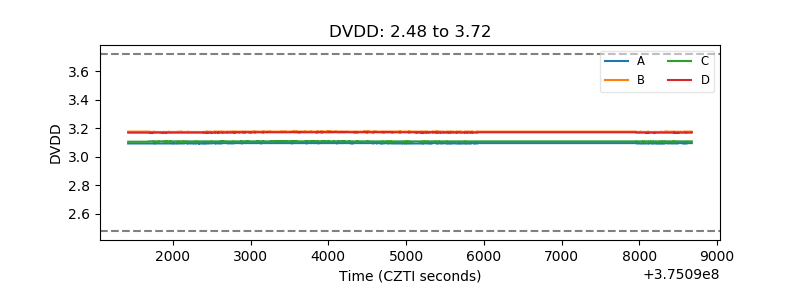 |
| Temperature 1 | 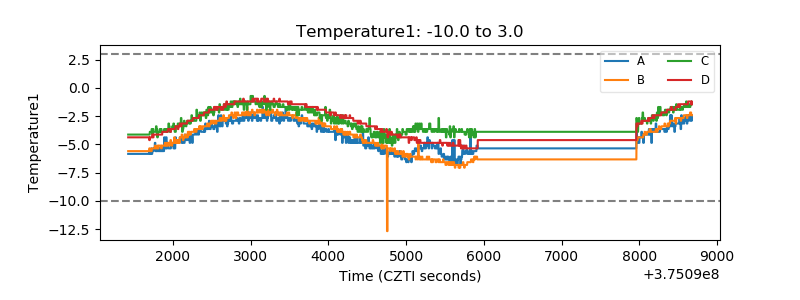 |
| Veto HV Monitor | 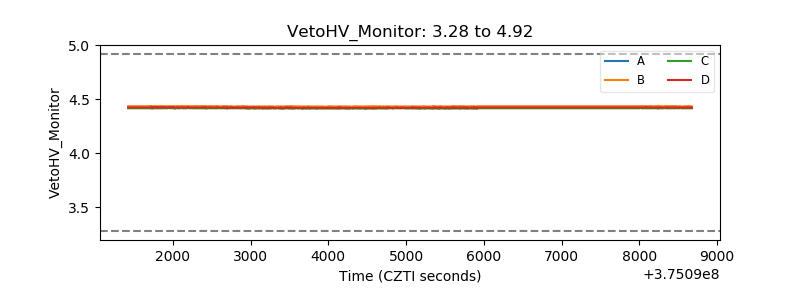 |
| Veto LLD | 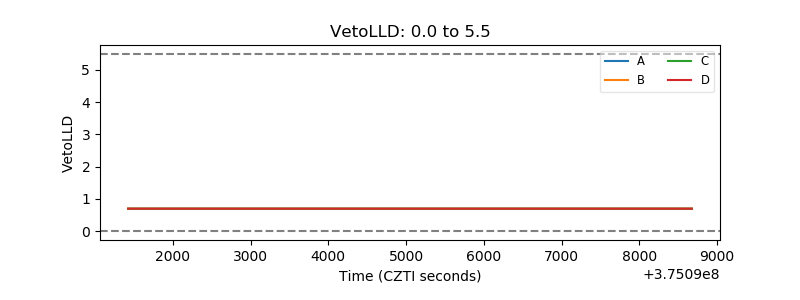 |
| Alpha Counter | 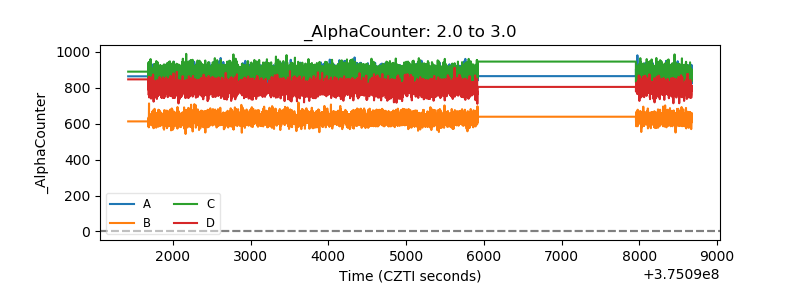 |
| _CPM_Rate | 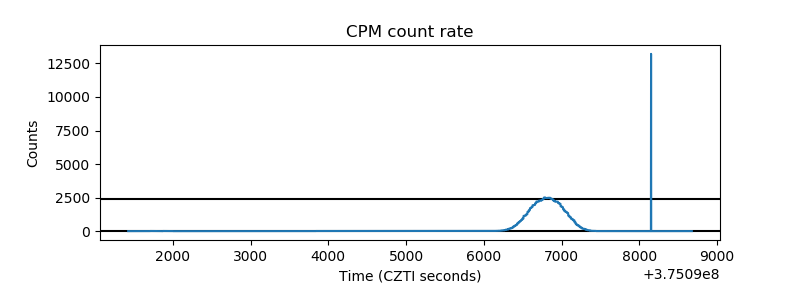 |
| CZT Counter | 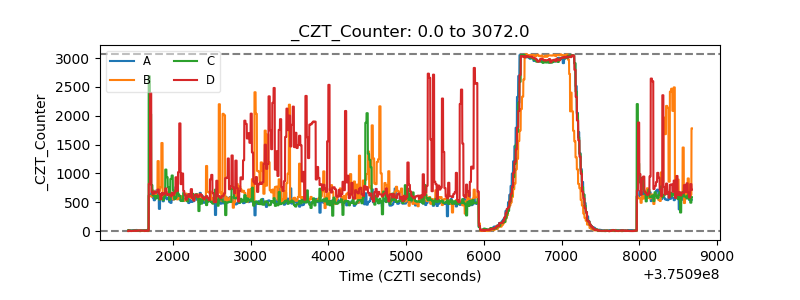 |
| +2.5 Volts monitor |  |
| +5 Volts monitor |  |
| _ROLL_ROT | 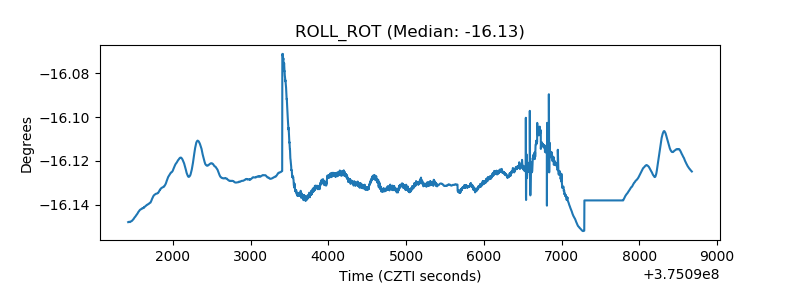 |
| _Roll_DEC | 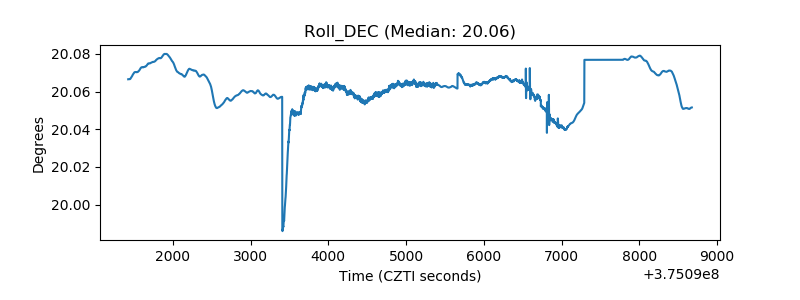 |
| _Roll_RA | 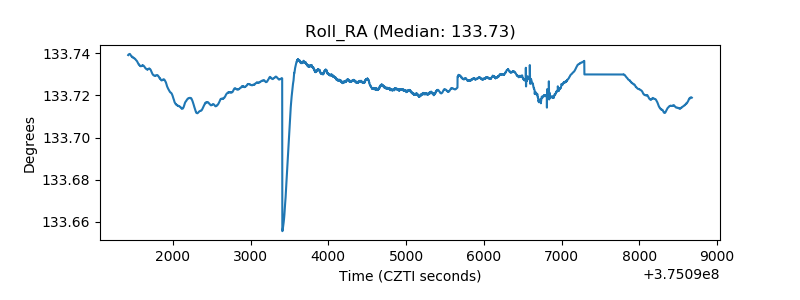 |
| Veto Counter | 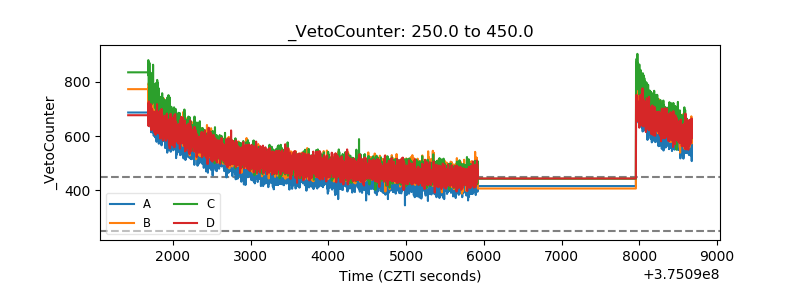 |