| Param | Original file | Final file |
|---|---|---|
| Filename | modeM0/AS1A10_067T01_9000004774_33235cztM0_level2.evt | modeM0/AS1A10_067T01_9000004774_33235cztM0_level2_quad_clean.evt |
| Size (bytes) | 498,395,520 | 50,022,720 |
| Size | 475.3 MB | 47.7 MB |
| Events in quadrant A | 2,630,241 | 306,994 |
| Events in quadrant B | 3,949,479 | 298,970 |
| Events in quadrant C | 2,906,669 | 297,240 |
| Events in quadrant D | 5,278,628 | 270,240 |
| Mode M9 | |||
|---|---|---|---|
| Quadrant | BADHDUFLAG | Total packets | Discarded packets |
| A | 0 | 23 | 0 |
| B | 0 | 23 | 0 |
| C | 0 | 23 | 0 |
| D | 0 | 24 | 0 |
| Mode SS | |||
|---|---|---|---|
| Quadrant | BADHDUFLAG | Total packets | Discarded packets |
| A | 0 | 98 | 0 |
| B | 0 | 98 | 0 |
| C | 0 | 98 | 0 |
| D | 0 | 98 | 0 |
| Mode M0 | |||
|---|---|---|---|
| Quadrant | BADHDUFLAG | Total packets | Discarded packets |
| A | 0 | 10545 | 2 |
| B | 0 | 15053 | 1 |
| C | 0 | 11528 | 1 |
| D | 0 | 19295 | 1 |
| Quadrant | Total seconds | Saturated seconds | Saturation percentage |
|---|---|---|---|
| A | 4860 | 9 | 0.185185% |
| B | 4860 | 417 | 8.580247% |
| C | 4860 | 42 | 0.864198% |
| D | 4860 | 509 | 10.473251% |
Noise dominated data is calculated using 1-second bins in cleaned event files. If a bin has >2000 counts, and if more than 50% of those come from <1% of pixels, then it is considered to be noise-dominated and hence unusable.
| Quadrant | # 1 sec bins | Bins with >0 counts | Bins with >2000 counts | High rate bins dominated by noise | Noise dominated (total time) | Noise dominated (detector-on time) | Marked lightcurve |
|---|---|---|---|---|---|---|---|
| A | 6984 | 4861 | 0 | 0 | 0.00% | 0.00% | 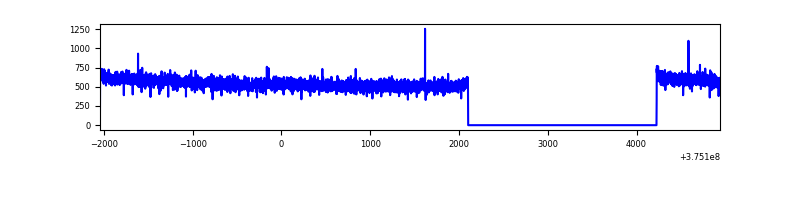 |
| B | 6984 | 4861 | 271 | 271 | 3.88% | 5.57% | 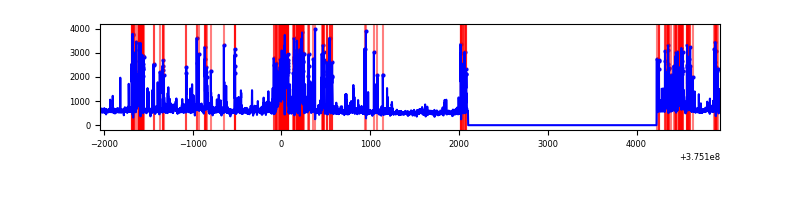 |
| C | 6984 | 4861 | 36 | 36 | 0.52% | 0.74% | 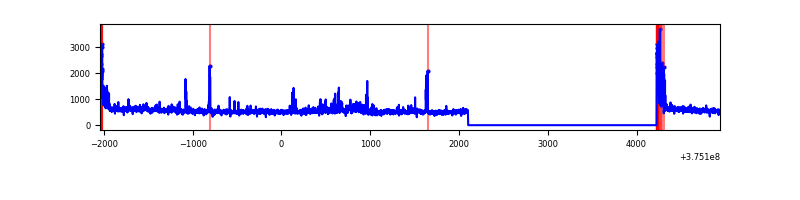 |
| D | 6984 | 4861 | 388 | 388 | 5.56% | 7.98% | 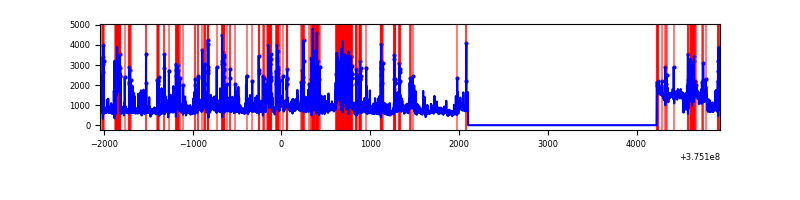 |
Top three noisy pixels from each quadrant. If the there are fewer than three noisy pixels in the level2.evt file, extra rows are filled as -1
| Pixel properties | Quadrant properties | ||||||
|---|---|---|---|---|---|---|---|
| Quadrant | DetID | PixID | Counts | Sigma | Mean | Median | Sigma |
| A | 13 | 6 | 17756 | 128.19 | 673 | 663 | 133.3 |
| A | 13 | 254 | 8377 | 57.85 | 673 | 663 | 133.3 |
| A | 0 | 226 | 5815 | 38.64 | 673 | 663 | 133.3 |
| B | 5 | 172 | 1130299 | 9459.13 | 637 | 623 | 119.4 |
| B | 4 | 170 | 105661 | 879.52 | 637 | 623 | 119.4 |
| B | 0 | 219 | 65759 | 545.4 | 637 | 623 | 119.4 |
| C | 0 | 10 | 171179 | 1155.67 | 645 | 653 | 147.6 |
| C | 10 | 49 | 140403 | 947.1 | 645 | 653 | 147.6 |
| C | 14 | 254 | 23818 | 156.99 | 645 | 653 | 147.6 |
| D | 8 | 195 | 969838 | 6308.59 | 631 | 614 | 153.6 |
| D | 7 | 80 | 448380 | 2914.47 | 631 | 614 | 153.6 |
| D | 12 | 3 | 401046 | 2606.37 | 631 | 614 | 153.6 |
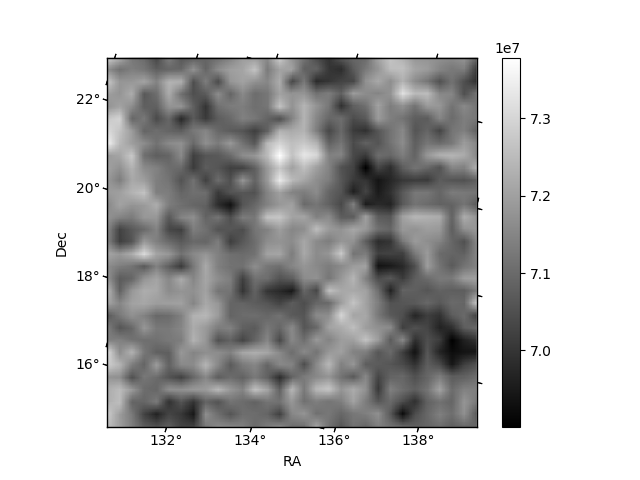
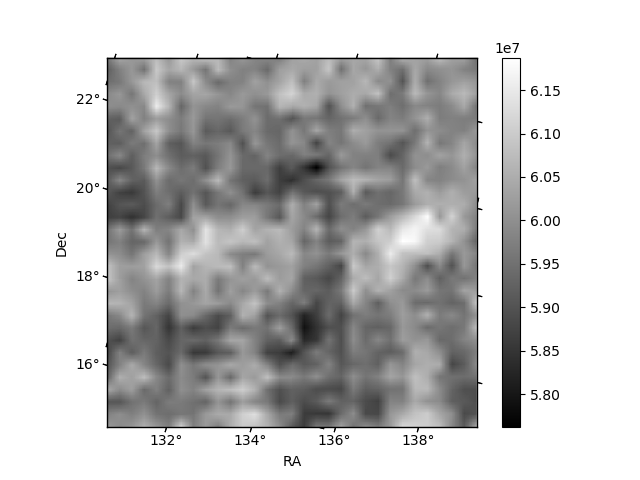
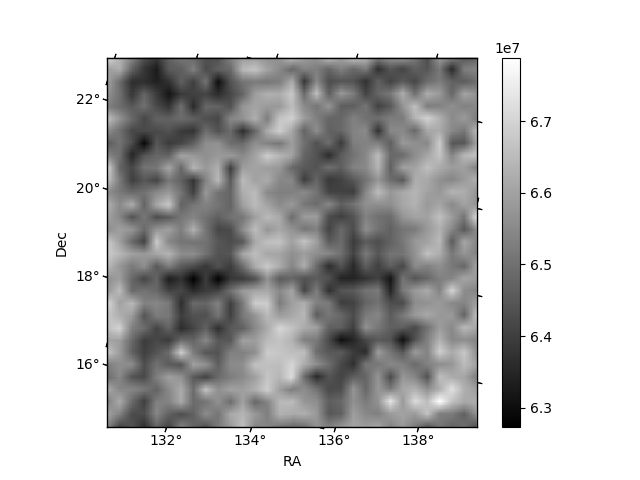
Histogram calculated using DETX and DETY for each event in the final _common_clean file
| Quadrant A | 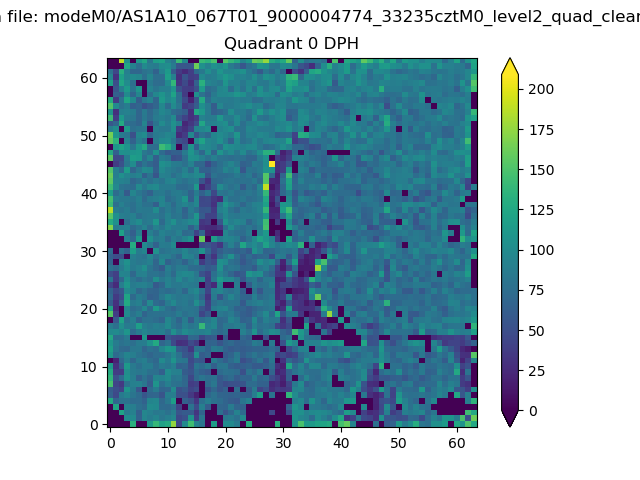 |
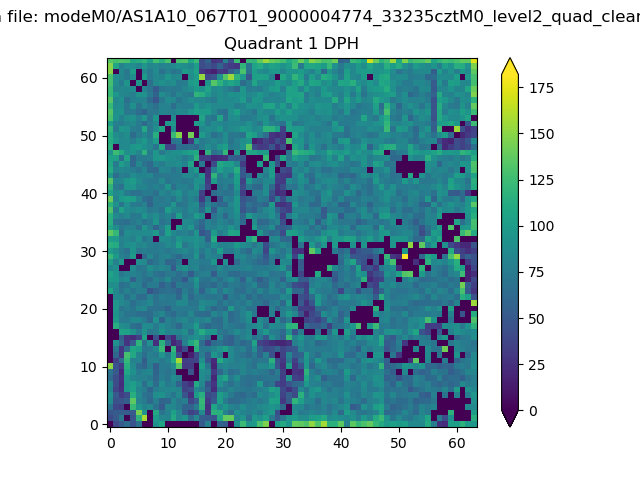 |
Quadrant B |
|---|---|---|---|
| Quadrant D | 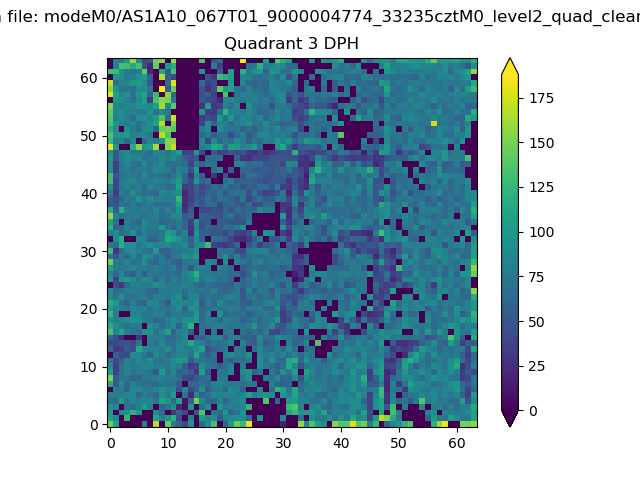 |
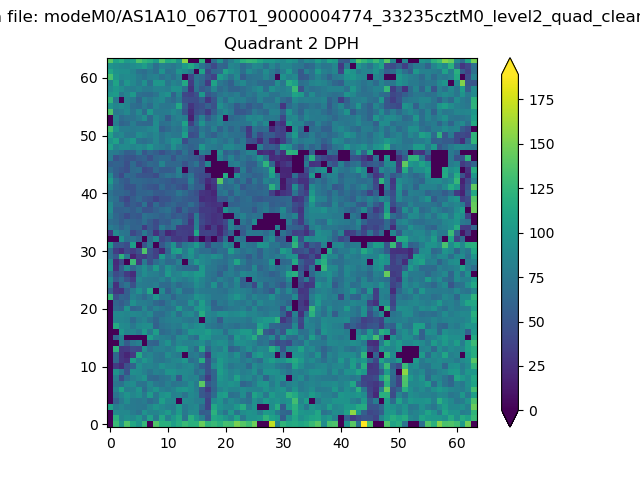 |
Quadrant C |
| Plot type | Count rate plots | Images |
|---|---|---|
| Comparison with Poisson distribution Blue bars denote a histogram of data divided into 1 sec bins. Red curve is a Poisson curve with rate = median count rate of data. |
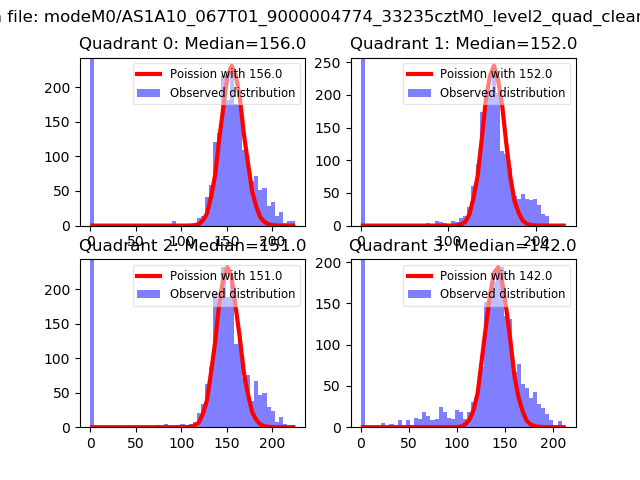 |
 |
| Quadrant-wise count rates Data is divided into 100 sec bins |
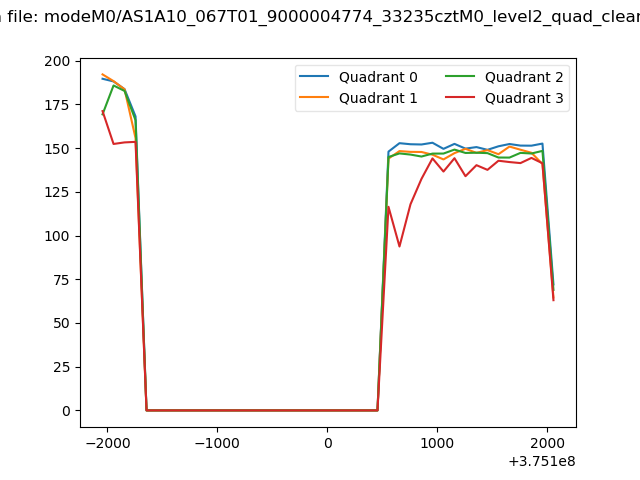 |
|
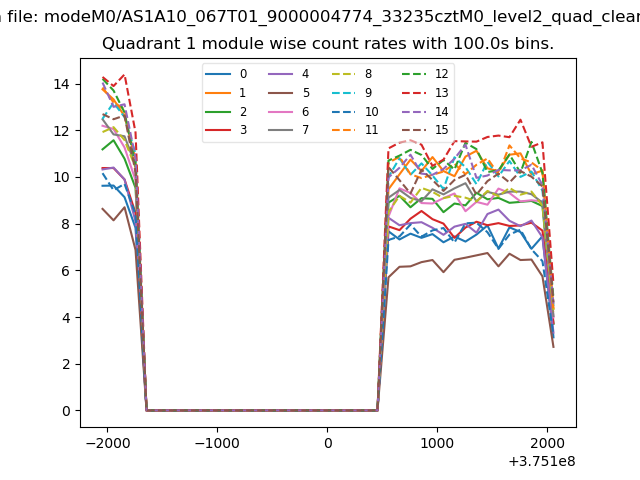
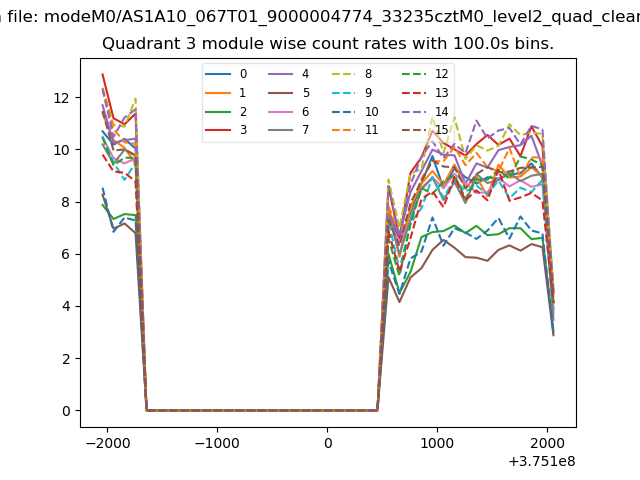
| Module-wise count rates for Quadrant A Data is divided into 100 sec bins |
 |
 |
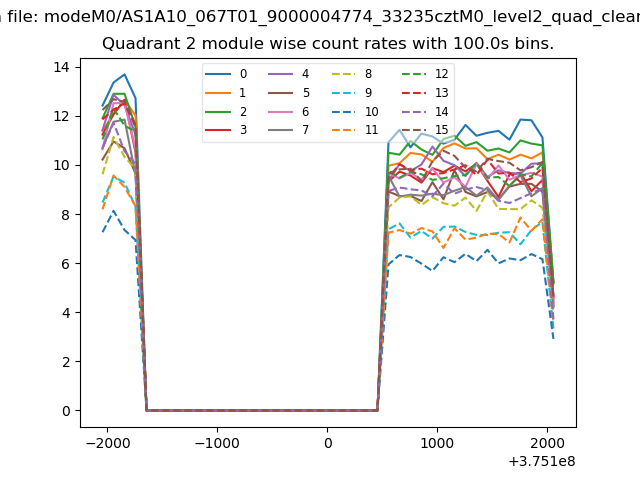
| Module-wise count rates for Quadrant B Data is divided into 100 sec bins |
 |
 |
| Module-wise count rates for Quadrant C Data is divided into 100 sec bins |
 |
 |
| Module-wise count rates for Quadrant D Data is divided into 100 sec bins |
 |
 |
| Parameter | Plot |
|---|---|
| CZT HV Monitor | 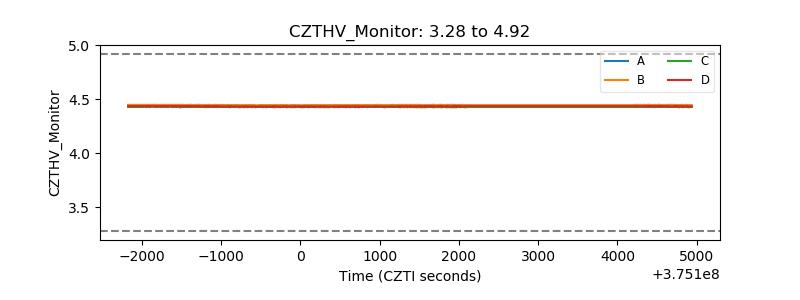 |
| D_VDD | 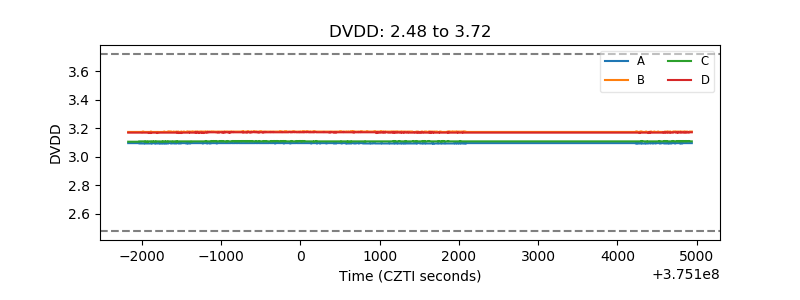 |
| Temperature 1 | 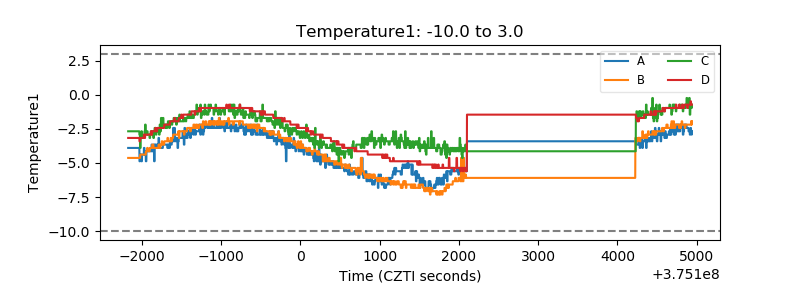 |
| Veto HV Monitor | 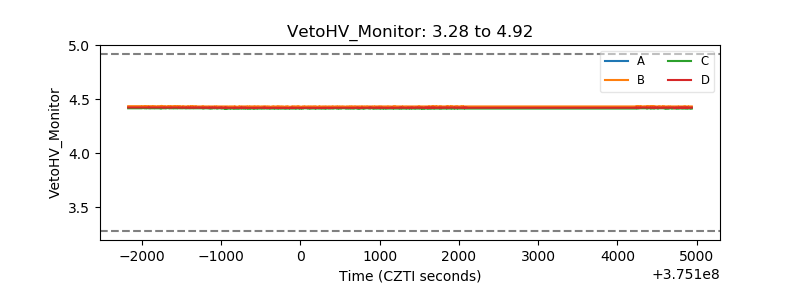 |
| Veto LLD | 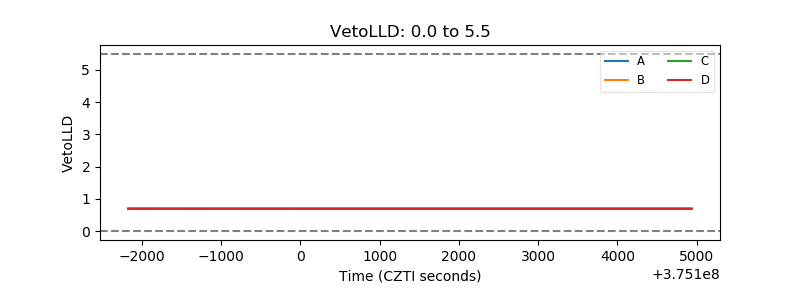 |
| Alpha Counter | 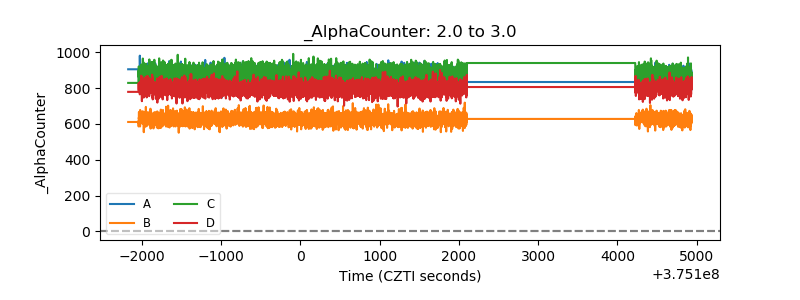 |
| _CPM_Rate | 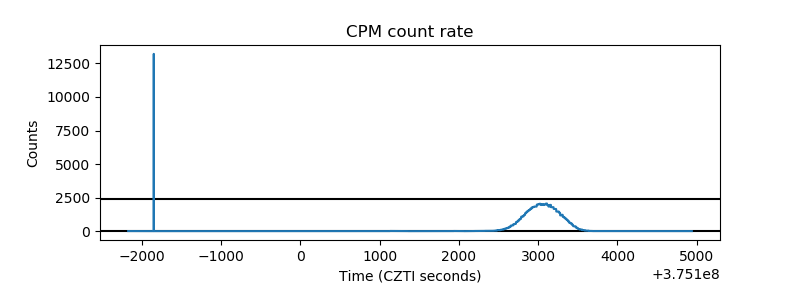 |
| CZT Counter | 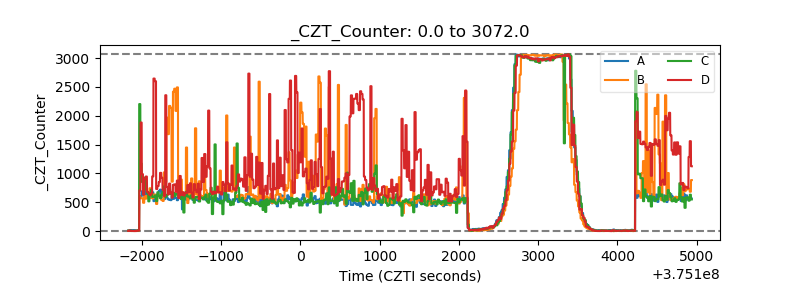 |
| +2.5 Volts monitor | 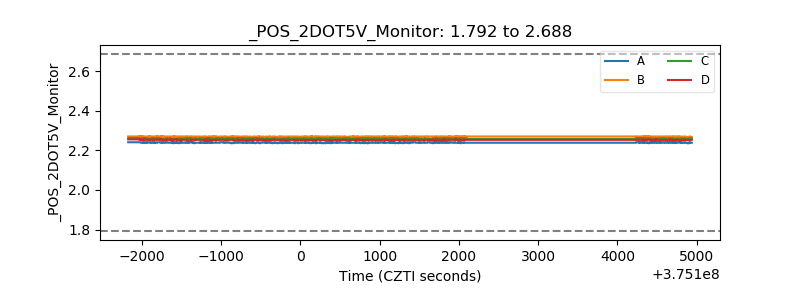 |
| +5 Volts monitor |  |
| _ROLL_ROT | 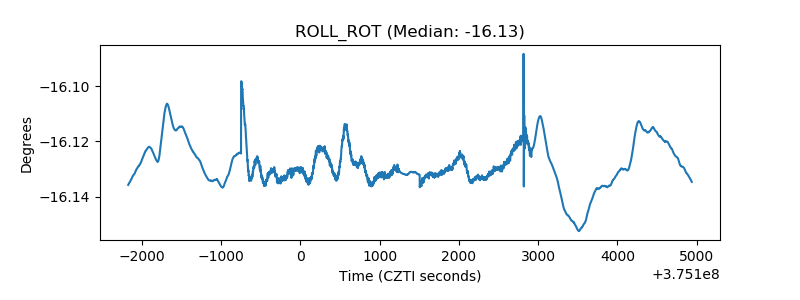 |
| _Roll_DEC | 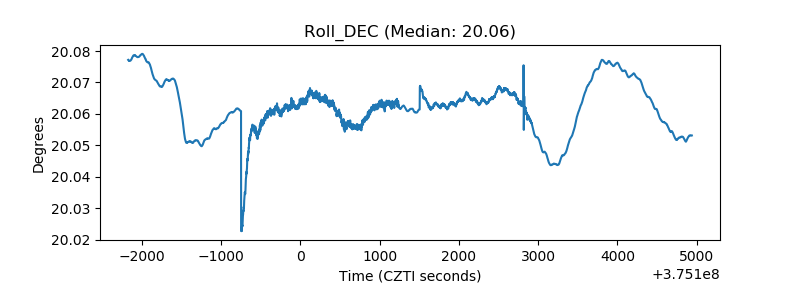 |
| _Roll_RA | 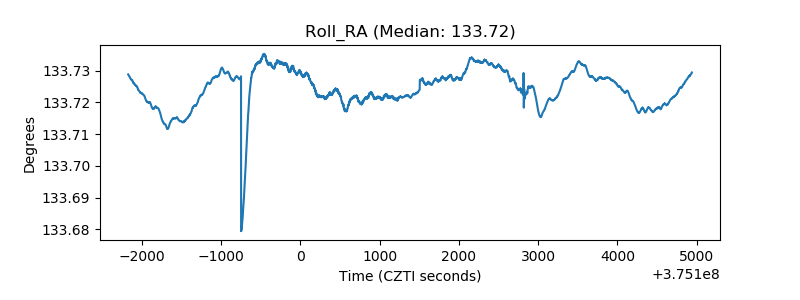 |
| Veto Counter | 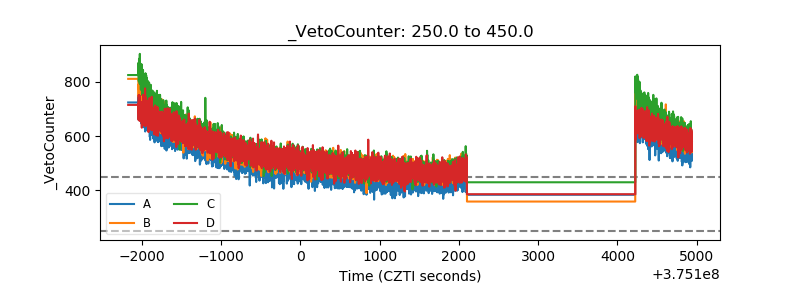 |