| Param | Original file | Final file |
|---|---|---|
| Filename | modeM0/AS1A10_067T01_9000004774_33236cztM0_level2.evt | modeM0/AS1A10_067T01_9000004774_33236cztM0_level2_quad_clean.evt |
| Size (bytes) | 608,065,920 | 48,314,880 |
| Size | 579.9 MB | 46.1 MB |
| Events in quadrant A | 2,728,757 | 291,704 |
| Events in quadrant B | 4,841,356 | 280,852 |
| Events in quadrant C | 2,970,468 | 284,158 |
| Events in quadrant D | 7,525,337 | 242,997 |
| Mode M9 | |||
|---|---|---|---|
| Quadrant | BADHDUFLAG | Total packets | Discarded packets |
| A | 0 | 28 | 0 |
| B | 0 | 28 | 0 |
| C | 0 | 28 | 0 |
| D | 0 | 29 | 0 |
| Mode SS | |||
|---|---|---|---|
| Quadrant | BADHDUFLAG | Total packets | Discarded packets |
| A | 0 | 106 | 0 |
| B | 0 | 106 | 0 |
| C | 0 | 106 | 0 |
| D | 0 | 106 | 0 |
| Mode M0 | |||
|---|---|---|---|
| Quadrant | BADHDUFLAG | Total packets | Discarded packets |
| A | 0 | 10975 | 2 |
| B | 0 | 17964 | 1 |
| C | 0 | 11706 | 1 |
| D | 0 | 25967 | 1 |
| Quadrant | Total seconds | Saturated seconds | Saturation percentage |
|---|---|---|---|
| A | 5173 | 7 | 0.135318% |
| B | 5173 | 754 | 14.575681% |
| C | 5173 | 81 | 1.565823% |
| D | 5173 | 881 | 17.030737% |
Noise dominated data is calculated using 1-second bins in cleaned event files. If a bin has >2000 counts, and if more than 50% of those come from <1% of pixels, then it is considered to be noise-dominated and hence unusable.
| Quadrant | # 1 sec bins | Bins with >0 counts | Bins with >2000 counts | High rate bins dominated by noise | Noise dominated (total time) | Noise dominated (detector-on time) | Marked lightcurve |
|---|---|---|---|---|---|---|---|
| A | 7326 | 5174 | 0 | 0 | 0.00% | 0.00% |  |
| B | 7326 | 5174 | 493 | 493 | 6.73% | 9.53% |  |
| C | 7326 | 5174 | 55 | 55 | 0.75% | 1.06% | 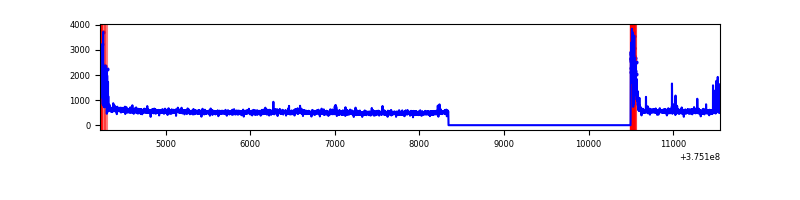 |
| D | 7326 | 5174 | 745 | 745 | 10.17% | 14.40% |  |
Top three noisy pixels from each quadrant. If the there are fewer than three noisy pixels in the level2.evt file, extra rows are filled as -1
| Pixel properties | Quadrant properties | ||||||
|---|---|---|---|---|---|---|---|
| Quadrant | DetID | PixID | Counts | Sigma | Mean | Median | Sigma |
| A | 13 | 6 | 16517 | 115.86 | 695 | 684 | 136.7 |
| A | 12 | 16 | 9158 | 62.01 | 695 | 684 | 136.7 |
| A | 13 | 254 | 8778 | 59.23 | 695 | 684 | 136.7 |
| B | 5 | 172 | 1874105 | 15864.54 | 629 | 616 | 118.1 |
| B | 4 | 170 | 146475 | 1235.12 | 629 | 616 | 118.1 |
| B | 0 | 190 | 93186 | 783.87 | 629 | 616 | 118.1 |
| C | 0 | 10 | 235978 | 1544.15 | 670 | 677 | 152.4 |
| C | 1 | 23 | 40688 | 262.57 | 670 | 677 | 152.4 |
| C | 10 | 49 | 35768 | 230.28 | 670 | 677 | 152.4 |
| D | 8 | 195 | 2910839 | 18479.17 | 638 | 621 | 157.5 |
| D | 7 | 80 | 718923 | 4561.04 | 638 | 621 | 157.5 |
| D | 12 | 3 | 527143 | 3343.29 | 638 | 621 | 157.5 |
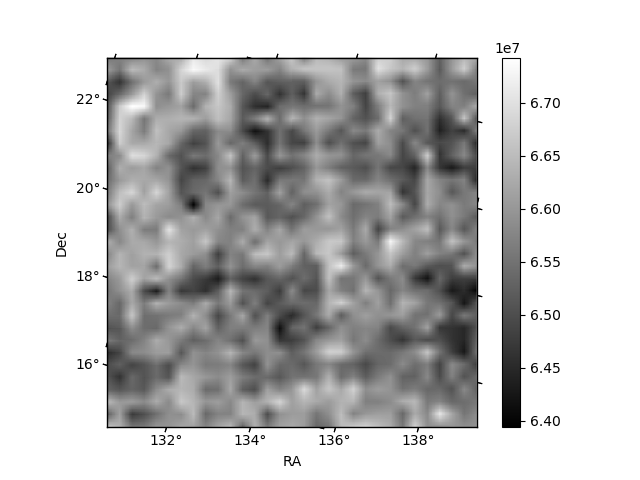
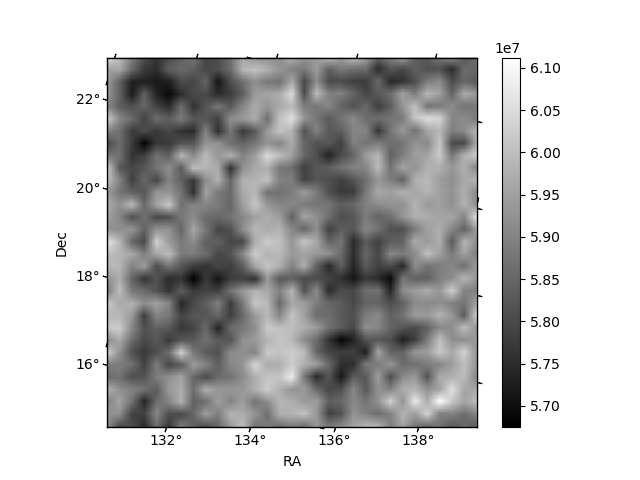
Histogram calculated using DETX and DETY for each event in the final _common_clean file
| Quadrant A |  |
 |
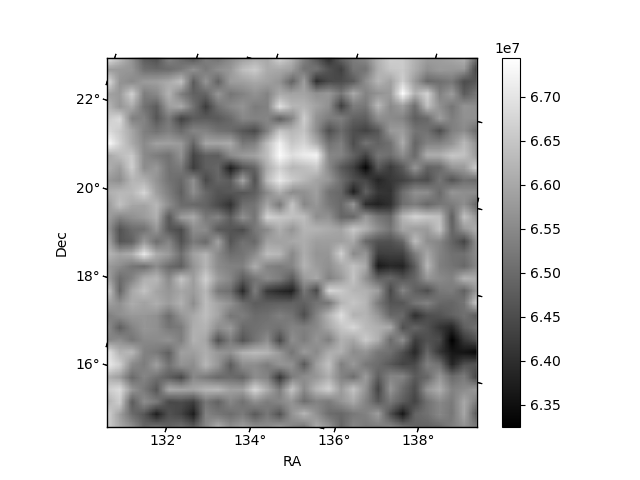
Quadrant B |
|---|---|---|---|
| Quadrant D | 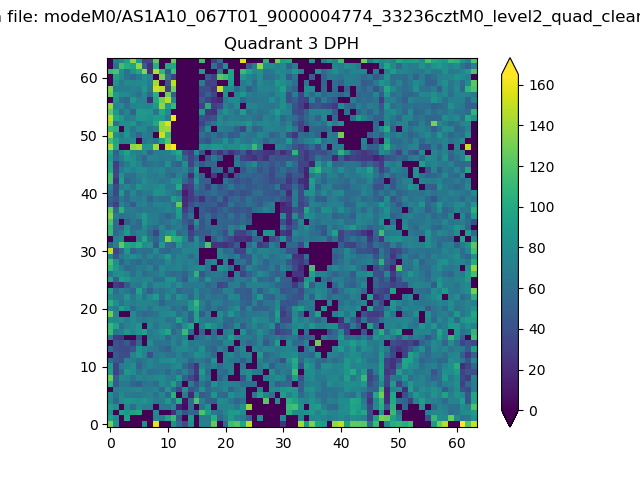 |
 |
Quadrant C |
| Plot type | Count rate plots | Images |
|---|---|---|
| Comparison with Poisson distribution Blue bars denote a histogram of data divided into 1 sec bins. Red curve is a Poisson curve with rate = median count rate of data. |
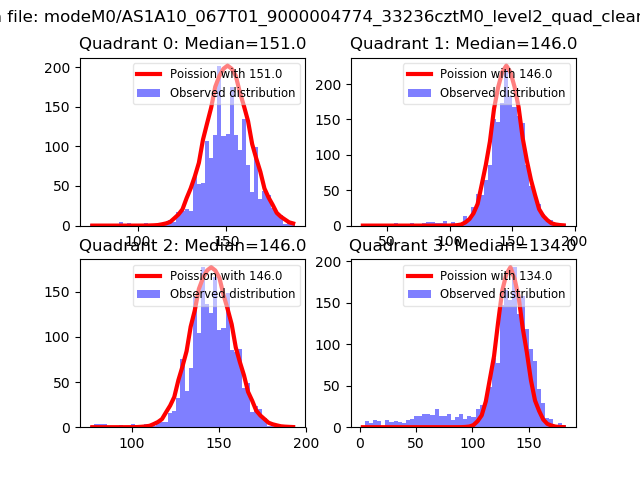 |
 |
| Quadrant-wise count rates Data is divided into 100 sec bins |
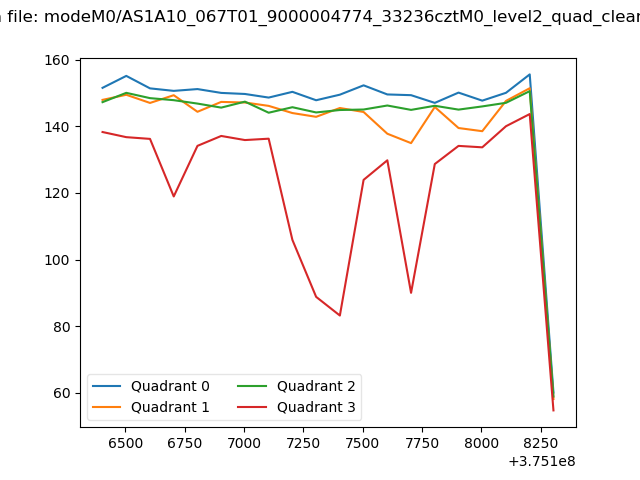 |
|
| Module-wise count rates for Quadrant A Data is divided into 100 sec bins |
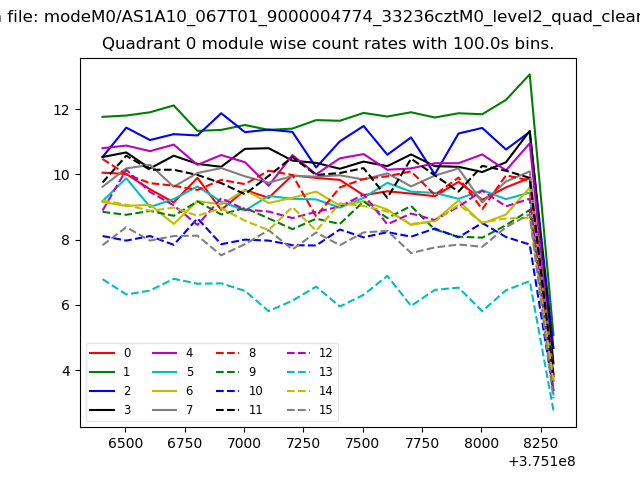 |
 |
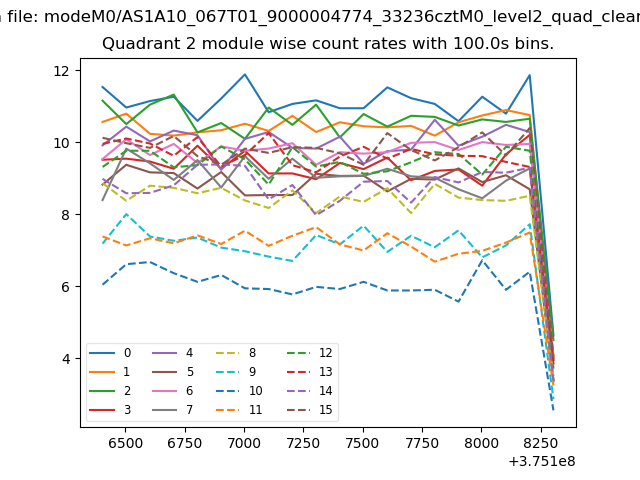
| Module-wise count rates for Quadrant B Data is divided into 100 sec bins |
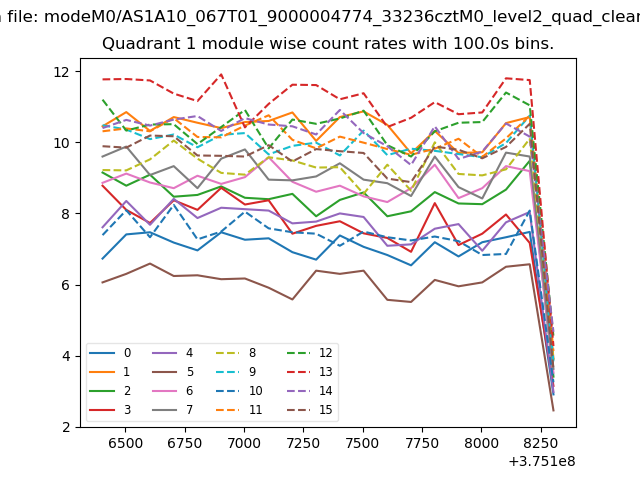 |
 |
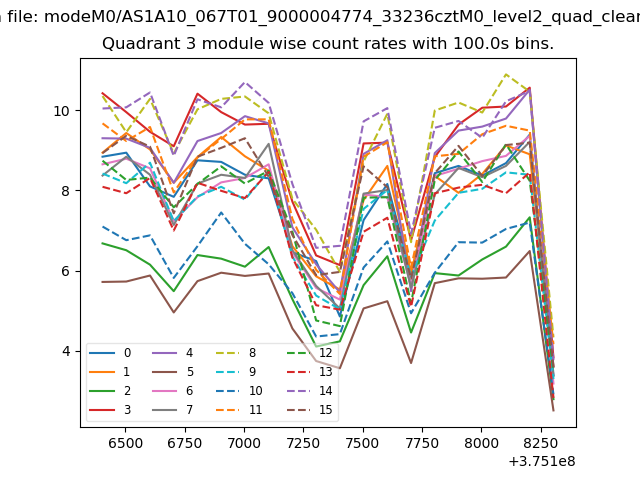
| Module-wise count rates for Quadrant C Data is divided into 100 sec bins |
 |
 |
| Module-wise count rates for Quadrant D Data is divided into 100 sec bins |
 |
 |
| Parameter | Plot |
|---|---|
| CZT HV Monitor | 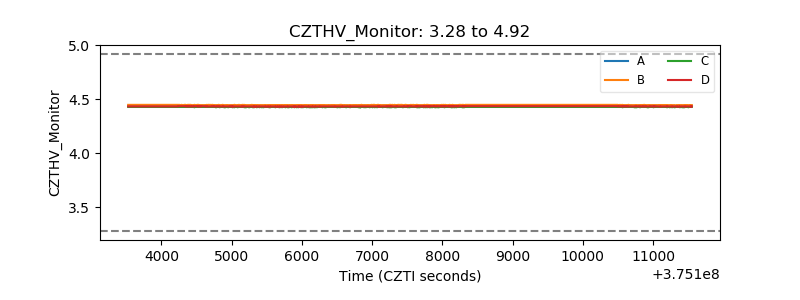 |
| D_VDD |  |
| Temperature 1 | 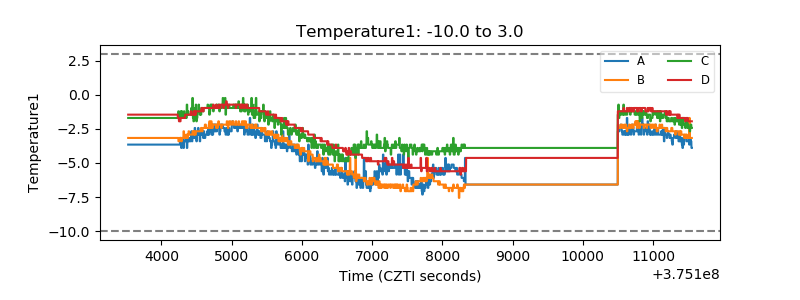 |
| Veto HV Monitor |  |
| Veto LLD | 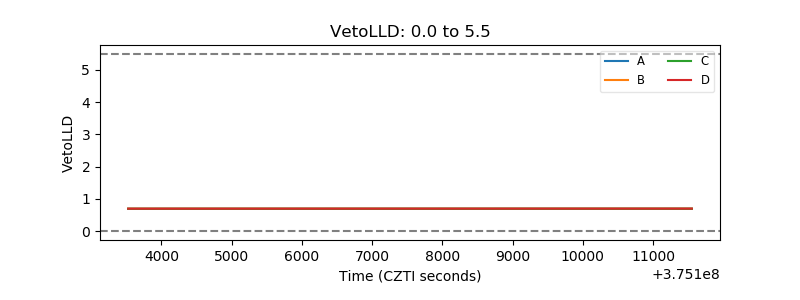 |
| Alpha Counter | 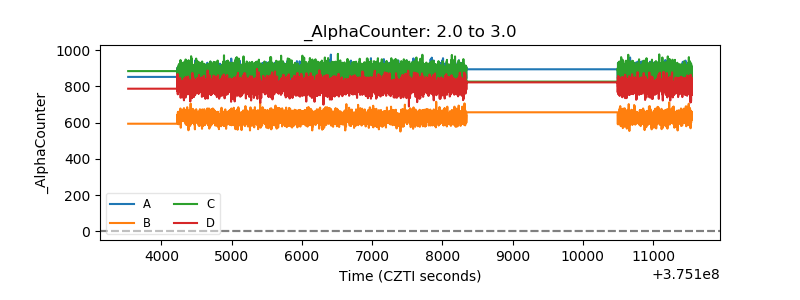 |
| _CPM_Rate | 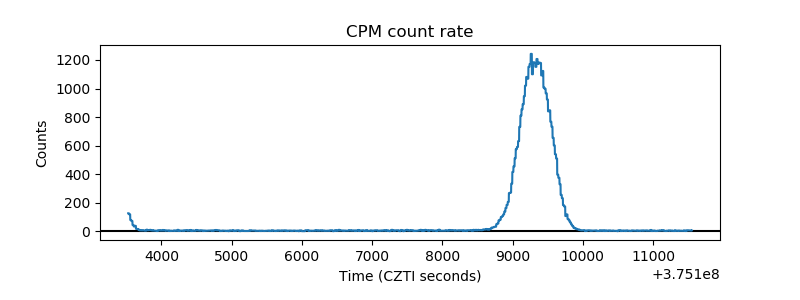 |
| CZT Counter |  |
| +2.5 Volts monitor | 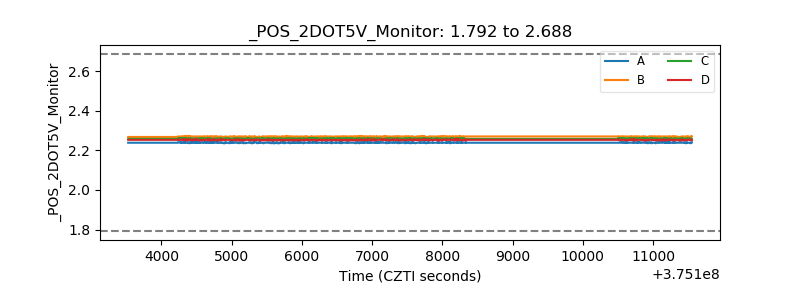 |
| +5 Volts monitor | 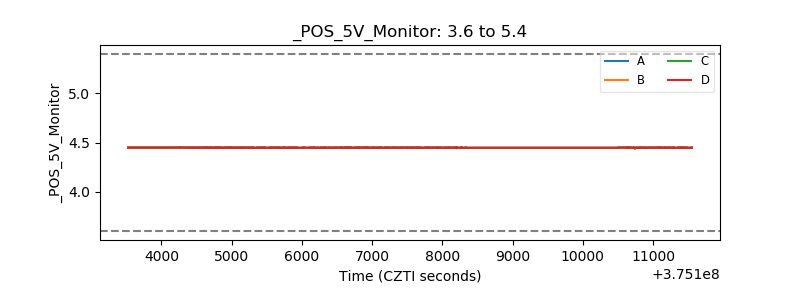 |
| _ROLL_ROT | 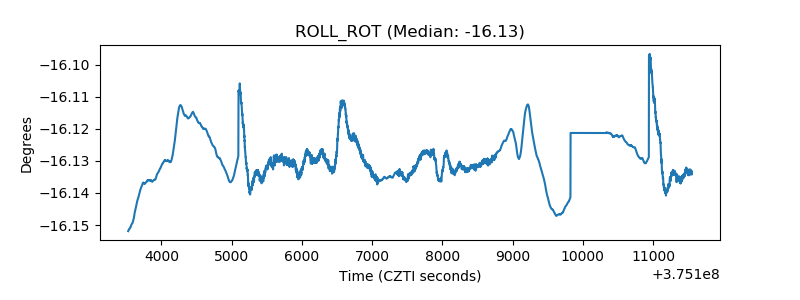 |
| _Roll_DEC | 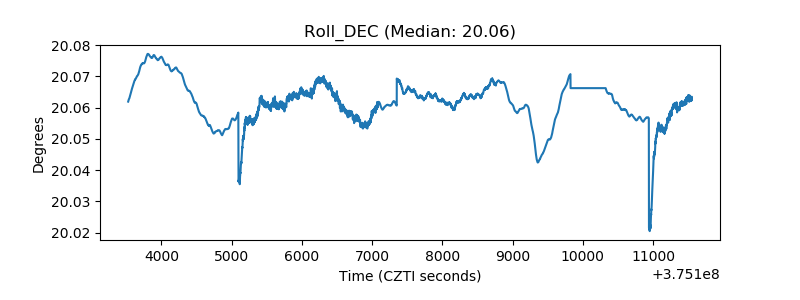 |
| _Roll_RA |  |
| Veto Counter | 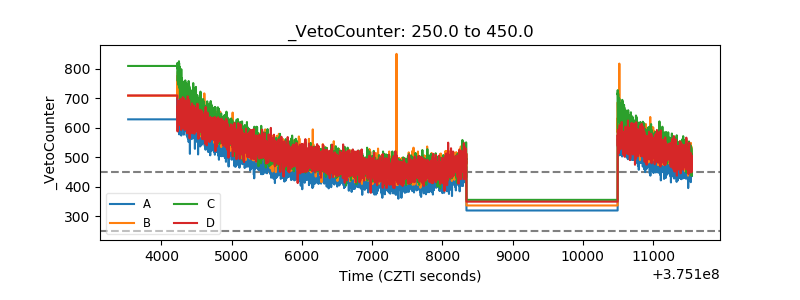 |