| Param | Original file | Final file |
|---|---|---|
| Filename | modeM0/AS1A10_067T01_9000004774_33238cztM0_level2.evt | modeM0/AS1A10_067T01_9000004774_33238cztM0_level2_quad_clean.evt |
| Size (bytes) | 601,344,000 | 63,089,280 |
| Size | 573.5 MB | 60.2 MB |
| Events in quadrant A | 2,460,023 | 421,233 |
| Events in quadrant B | 3,321,853 | 410,856 |
| Events in quadrant C | 2,745,071 | 413,528 |
| Events in quadrant D | 9,334,262 | 300,961 |
| Mode M9 | |||
|---|---|---|---|
| Quadrant | BADHDUFLAG | Total packets | Discarded packets |
| A | 0 | 28 | 0 |
| B | 0 | 28 | 0 |
| C | 0 | 28 | 0 |
| D | 0 | 29 | 0 |
| Mode SS | |||
|---|---|---|---|
| Quadrant | BADHDUFLAG | Total packets | Discarded packets |
| A | 0 | 104 | 0 |
| B | 0 | 104 | 0 |
| C | 0 | 104 | 0 |
| D | 0 | 104 | 0 |
| Mode M0 | |||
|---|---|---|---|
| Quadrant | BADHDUFLAG | Total packets | Discarded packets |
| A | 0 | 10484 | 3 |
| B | 0 | 13195 | 2 |
| C | 0 | 11359 | 2 |
| D | 0 | 31406 | 2 |
| Quadrant | Total seconds | Saturated seconds | Saturation percentage |
|---|---|---|---|
| A | 5185 | 6 | 0.115718% |
| B | 5185 | 217 | 4.185149% |
| C | 5185 | 94 | 1.812922% |
| D | 5185 | 2212 | 42.661524% |
Noise dominated data is calculated using 1-second bins in cleaned event files. If a bin has >2000 counts, and if more than 50% of those come from <1% of pixels, then it is considered to be noise-dominated and hence unusable.
| Quadrant | # 1 sec bins | Bins with >0 counts | Bins with >2000 counts | High rate bins dominated by noise | Noise dominated (total time) | Noise dominated (detector-on time) | Marked lightcurve |
|---|---|---|---|---|---|---|---|
| A | 7038 | 5186 | 0 | 0 | 0.00% | 0.00% | 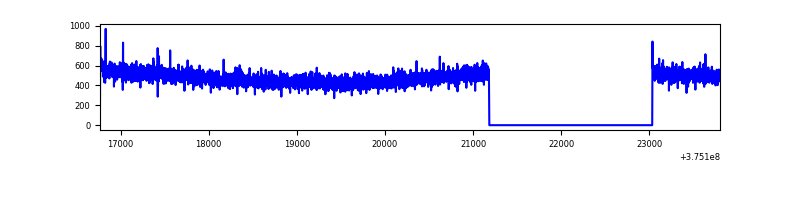 |
| B | 7038 | 5186 | 156 | 156 | 2.22% | 3.01% | 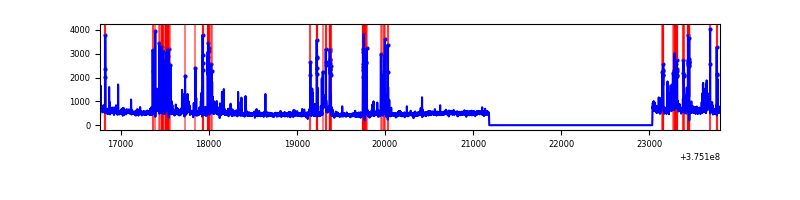 |
| C | 7038 | 5186 | 68 | 68 | 0.97% | 1.31% | 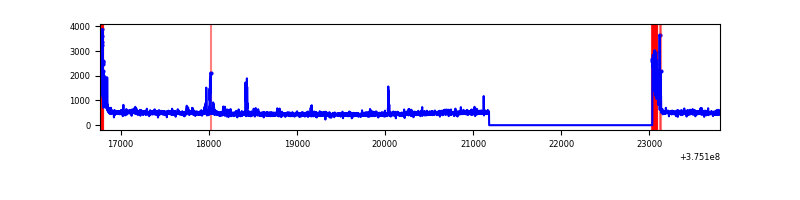 |
| D | 7038 | 5186 | 1981 | 1981 | 28.15% | 38.20% | 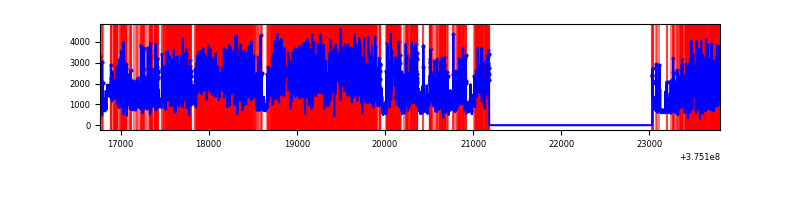 |
Top three noisy pixels from each quadrant. If the there are fewer than three noisy pixels in the level2.evt file, extra rows are filled as -1
| Pixel properties | Quadrant properties | ||||||
|---|---|---|---|---|---|---|---|
| Quadrant | DetID | PixID | Counts | Sigma | Mean | Median | Sigma |
| A | 14 | 4 | 9560 | 70.7 | 630 | 618 | 126.5 |
| A | 13 | 254 | 8825 | 64.89 | 630 | 618 | 126.5 |
| A | 13 | 6 | 7685 | 55.88 | 630 | 618 | 126.5 |
| B | 5 | 172 | 543145 | 4673.78 | 613 | 601 | 116.1 |
| B | 0 | 219 | 112145 | 960.9 | 613 | 601 | 116.1 |
| B | 5 | 200 | 85121 | 728.1 | 613 | 601 | 116.1 |
| C | 0 | 10 | 255598 | 1818.34 | 608 | 613 | 140.2 |
| C | 1 | 23 | 35081 | 245.8 | 608 | 613 | 140.2 |
| C | 14 | 254 | 26197 | 182.44 | 608 | 613 | 140.2 |
| D | 12 | 3 | 4372596 | 33963.31 | 512 | 498 | 128.7 |
| D | 8 | 195 | 1770757 | 13751.72 | 512 | 498 | 128.7 |
| D | 7 | 80 | 320767 | 2487.91 | 512 | 498 | 128.7 |
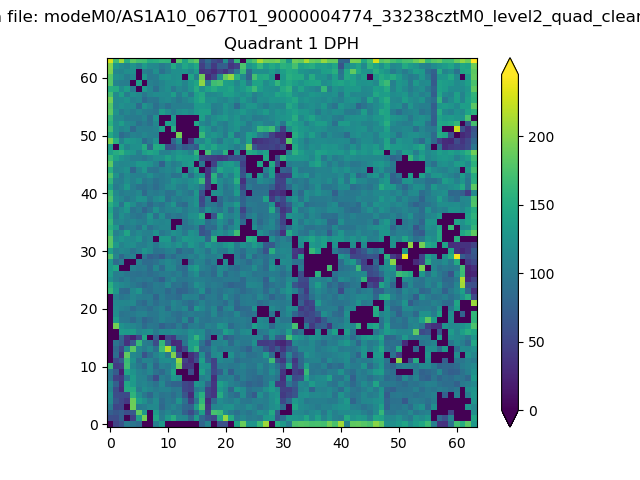
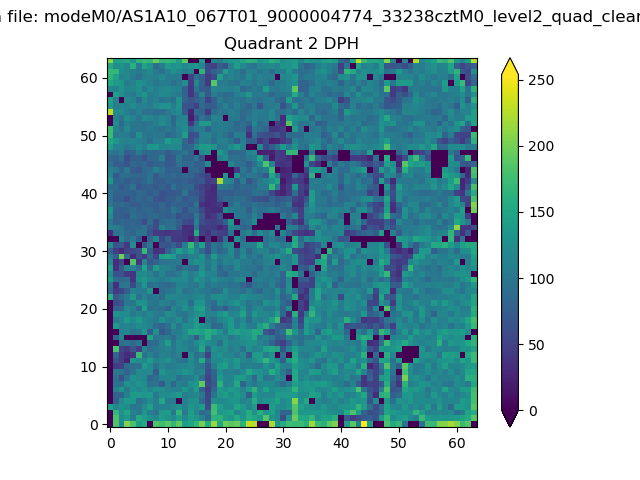
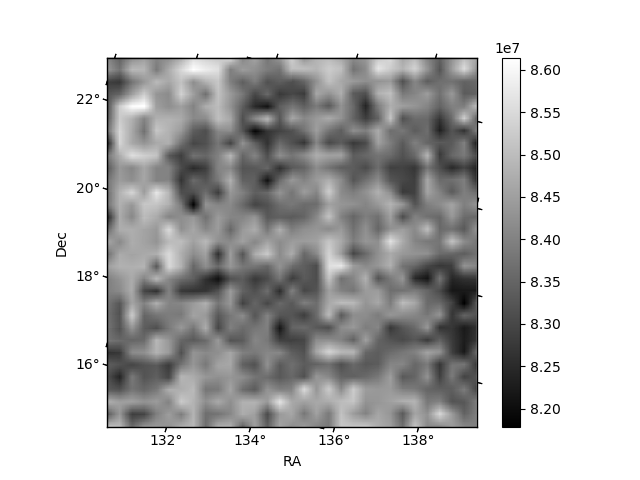
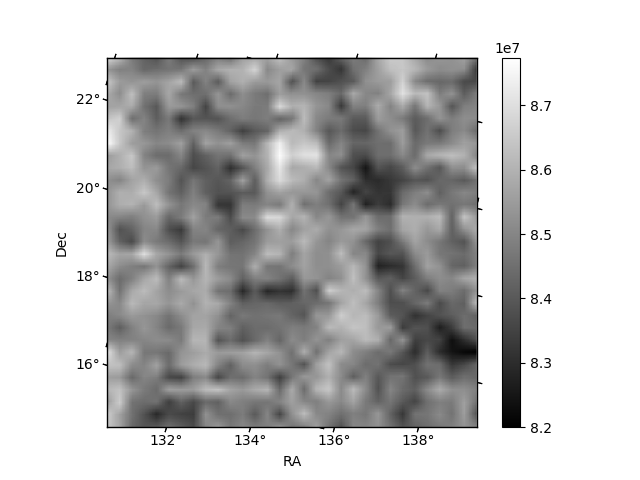
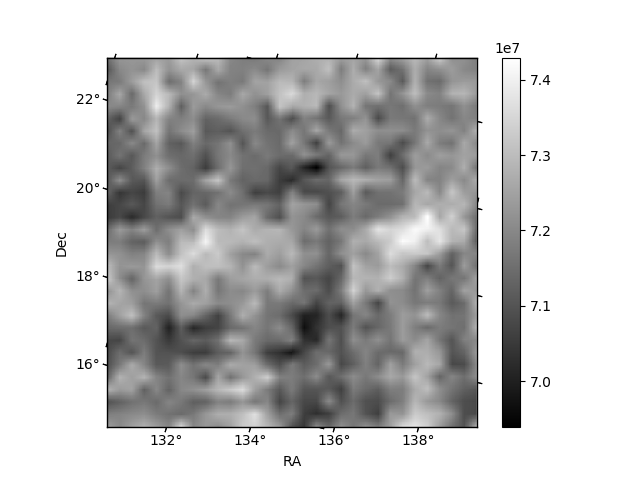
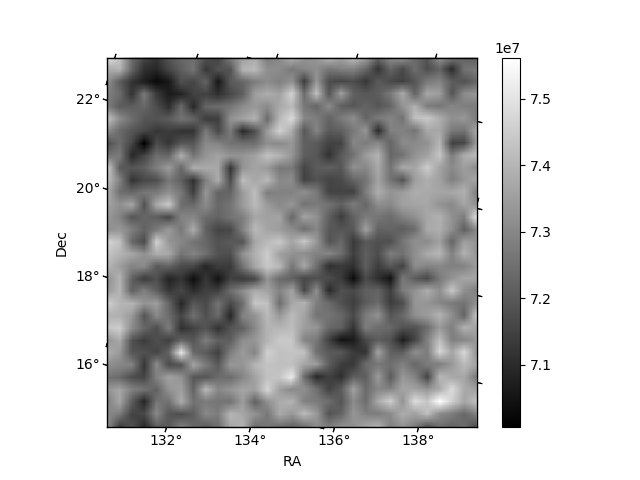
Histogram calculated using DETX and DETY for each event in the final _common_clean file
| Quadrant A |  |
 |
Quadrant B |
|---|---|---|---|
| Quadrant D |  |
 |
Quadrant C |
| Plot type | Count rate plots | Images |
|---|---|---|
| Comparison with Poisson distribution Blue bars denote a histogram of data divided into 1 sec bins. Red curve is a Poisson curve with rate = median count rate of data. |
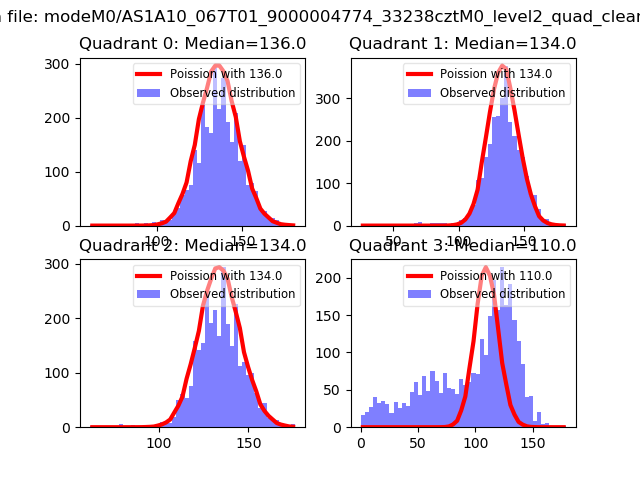 |
 |
| Quadrant-wise count rates Data is divided into 100 sec bins |
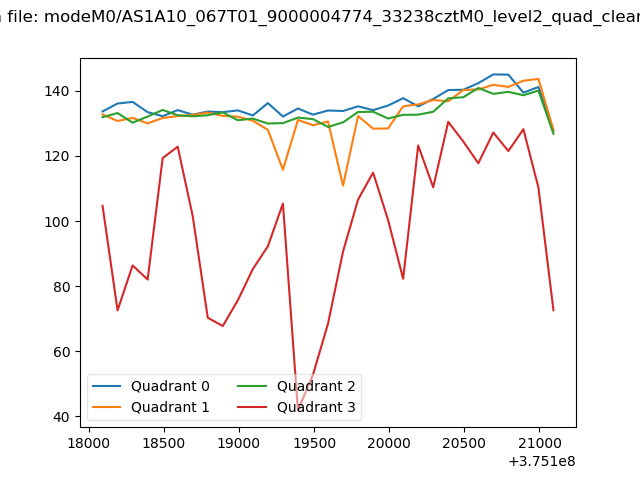 |
|
| Module-wise count rates for Quadrant A Data is divided into 100 sec bins |
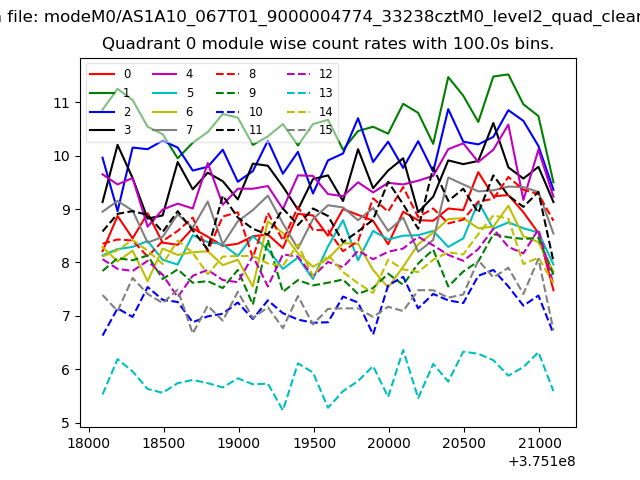 |
 |
| Module-wise count rates for Quadrant B Data is divided into 100 sec bins |
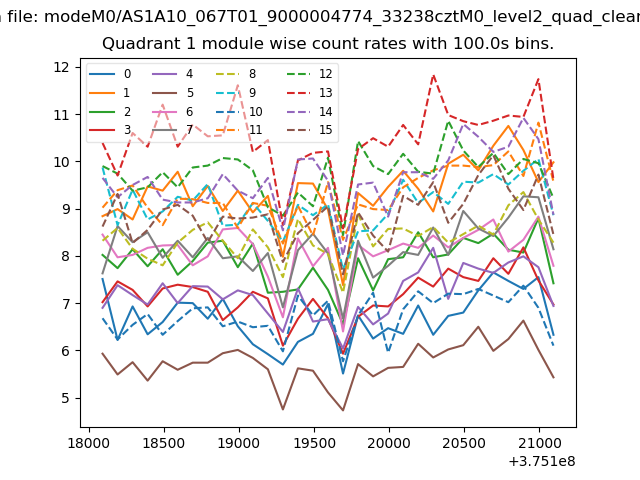 |
 |
| Module-wise count rates for Quadrant C Data is divided into 100 sec bins |
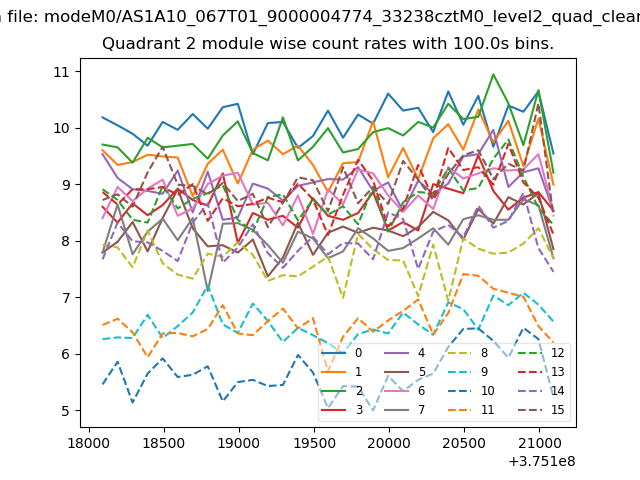 |
 |
| Module-wise count rates for Quadrant D Data is divided into 100 sec bins |
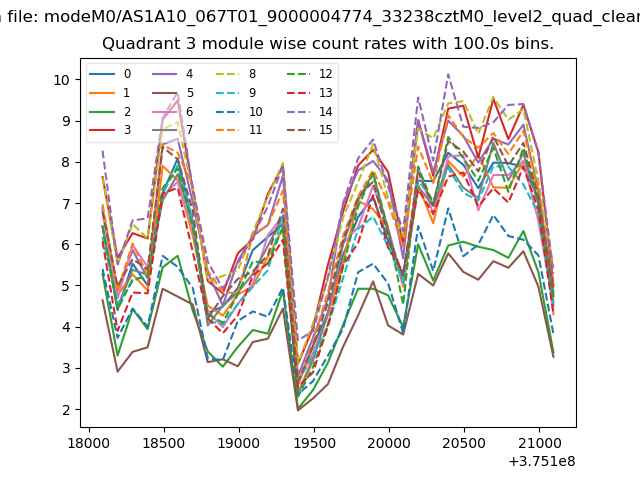 |
 |
| Parameter | Plot |
|---|---|
| CZT HV Monitor | 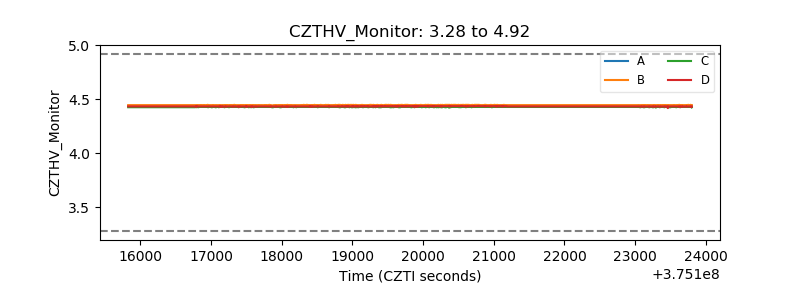 |
| D_VDD | 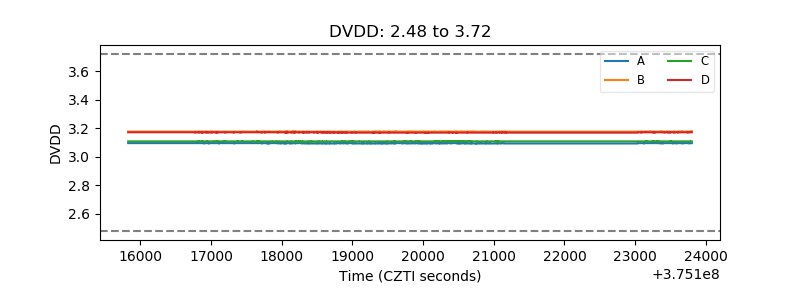 |
| Temperature 1 | 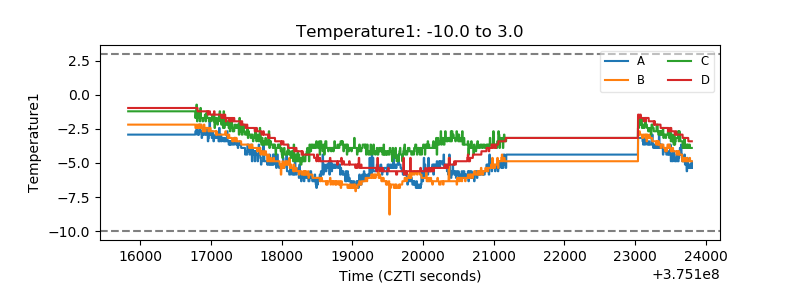 |
| Veto HV Monitor | 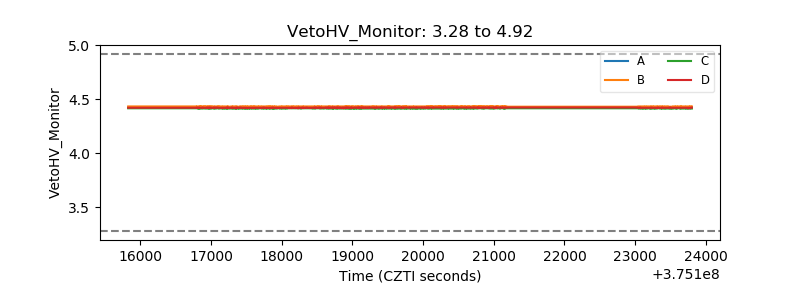 |
| Veto LLD | 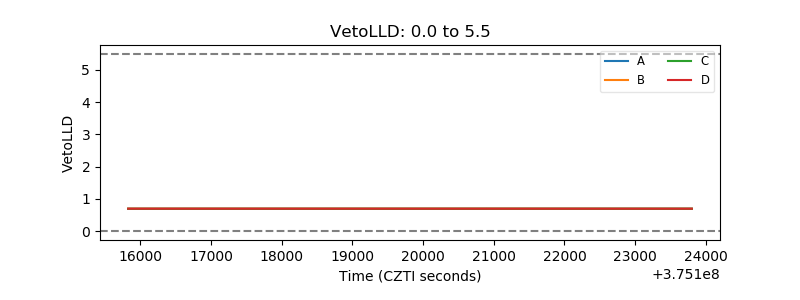 |
| Alpha Counter | 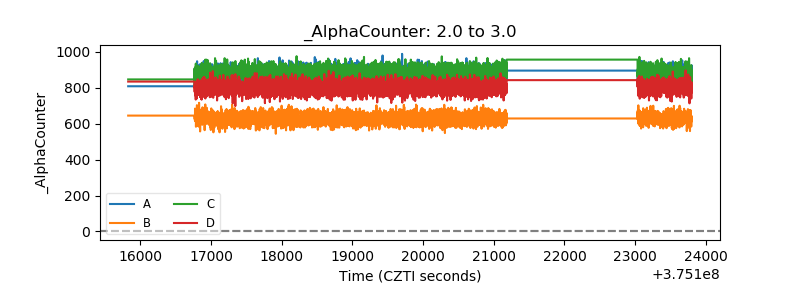 |
| _CPM_Rate | 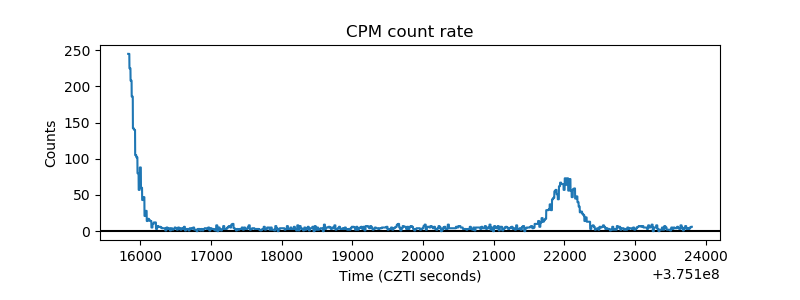 |
| CZT Counter | 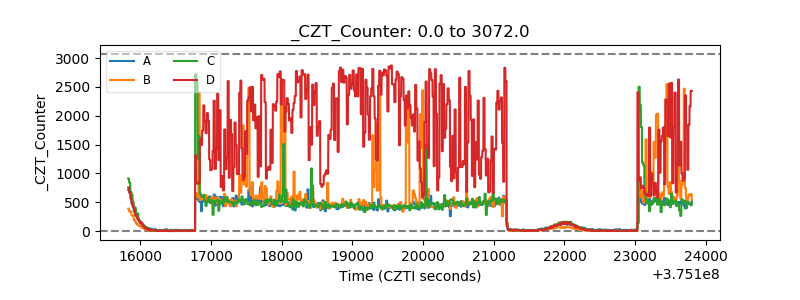 |
| +2.5 Volts monitor | 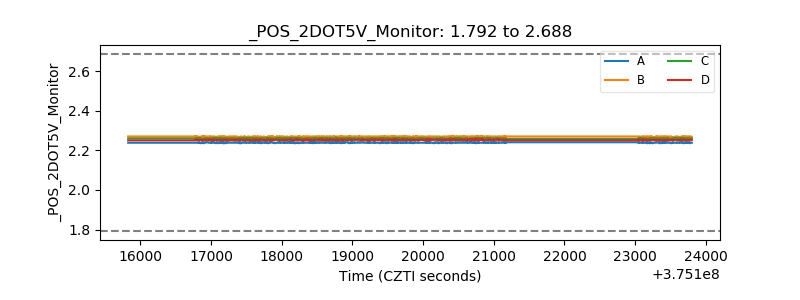 |
| +5 Volts monitor |  |
| _ROLL_ROT | 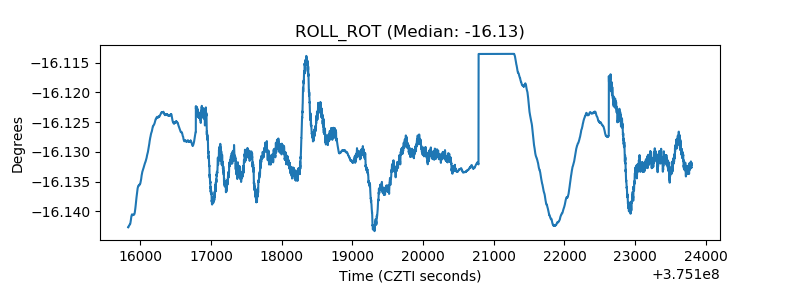 |
| _Roll_DEC | 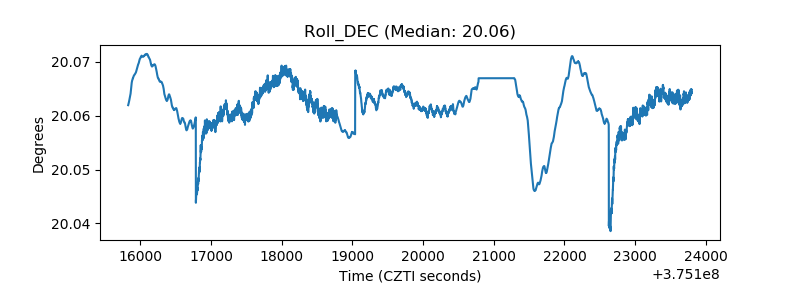 |
| _Roll_RA | 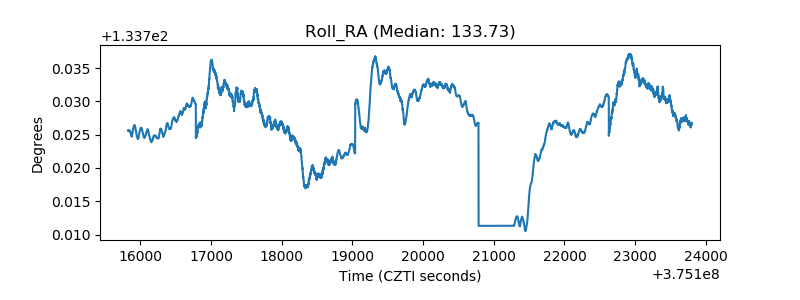 |
| Veto Counter | 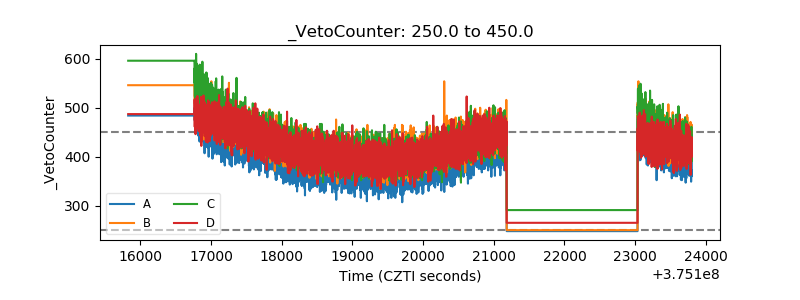 |