| Param | Original file | Final file |
|---|---|---|
| Filename | modeM0/AS1A10_067T01_9000004774_33239cztM0_level2.evt | modeM0/AS1A10_067T01_9000004774_33239cztM0_level2_quad_clean.evt |
| Size (bytes) | 713,698,560 | 71,375,040 |
| Size | 680.6 MB | 68.1 MB |
| Events in quadrant A | 2,589,784 | 516,555 |
| Events in quadrant B | 3,904,293 | 495,929 |
| Events in quadrant C | 3,069,151 | 503,327 |
| Events in quadrant D | 11,674,249 | 254,069 |
| Mode M9 | |||
|---|---|---|---|
| Quadrant | BADHDUFLAG | Total packets | Discarded packets |
| A | 0 | 32 | 0 |
| B | 0 | 32 | 0 |
| C | 0 | 32 | 0 |
| D | 0 | 33 | 0 |
| Mode SS | |||
|---|---|---|---|
| Quadrant | BADHDUFLAG | Total packets | Discarded packets |
| A | 0 | 112 | 0 |
| B | 0 | 112 | 0 |
| C | 0 | 112 | 0 |
| D | 0 | 112 | 0 |
| Mode M0 | |||
|---|---|---|---|
| Quadrant | BADHDUFLAG | Total packets | Discarded packets |
| A | 0 | 11233 | 3 |
| B | 0 | 15323 | 2 |
| C | 0 | 12640 | 2 |
| D | 0 | 38540 | 2 |
| Quadrant | Total seconds | Saturated seconds | Saturation percentage |
|---|---|---|---|
| A | 5577 | 4 | 0.071723% |
| B | 5577 | 294 | 5.271651% |
| C | 5577 | 108 | 1.936525% |
| D | 5577 | 3668 | 65.770127% |
Noise dominated data is calculated using 1-second bins in cleaned event files. If a bin has >2000 counts, and if more than 50% of those come from <1% of pixels, then it is considered to be noise-dominated and hence unusable.
| Quadrant | # 1 sec bins | Bins with >0 counts | Bins with >2000 counts | High rate bins dominated by noise | Noise dominated (total time) | Noise dominated (detector-on time) | Marked lightcurve |
|---|---|---|---|---|---|---|---|
| A | 7040 | 5578 | 0 | 0 | 0.00% | 0.00% | 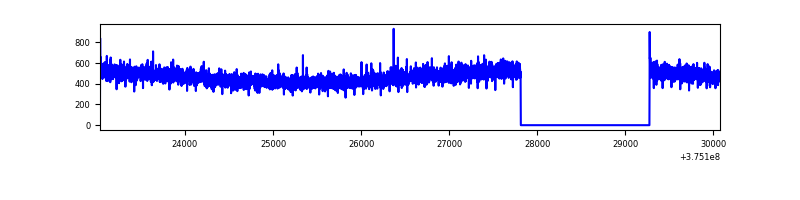 |
| B | 7040 | 5578 | 193 | 193 | 2.74% | 3.46% | 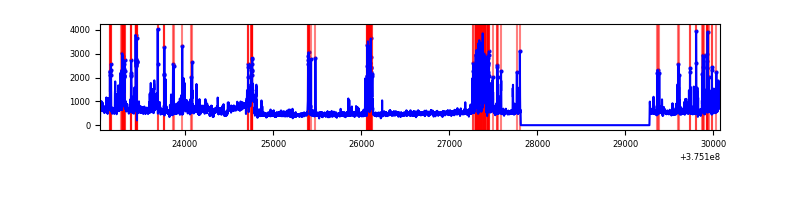 |
| C | 7040 | 5578 | 89 | 89 | 1.26% | 1.60% | 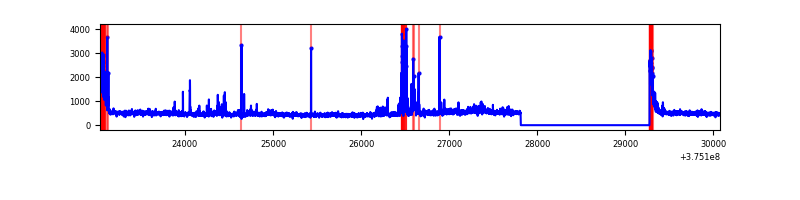 |
| D | 7039 | 5577 | 3194 | 3194 | 45.38% | 57.27% | 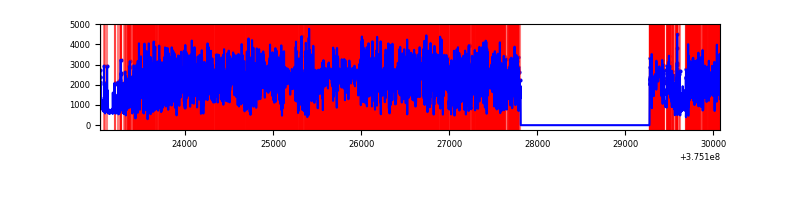 |
Top three noisy pixels from each quadrant. If the there are fewer than three noisy pixels in the level2.evt file, extra rows are filled as -1
| Pixel properties | Quadrant properties | ||||||
|---|---|---|---|---|---|---|---|
| Quadrant | DetID | PixID | Counts | Sigma | Mean | Median | Sigma |
| A | 13 | 6 | 9443 | 65.97 | 665 | 652 | 133.3 |
| A | 13 | 254 | 9275 | 64.71 | 665 | 652 | 133.3 |
| A | 3 | 137 | 6274 | 42.19 | 665 | 652 | 133.3 |
| B | 5 | 172 | 732879 | 5909.81 | 644 | 629 | 123.9 |
| B | 5 | 200 | 209426 | 1685.15 | 644 | 629 | 123.9 |
| B | 4 | 170 | 133510 | 1072.45 | 644 | 629 | 123.9 |
| C | 0 | 10 | 273895 | 1846.98 | 639 | 645 | 147.9 |
| C | 1 | 23 | 188483 | 1269.65 | 639 | 645 | 147.9 |
| C | 14 | 254 | 38877 | 258.42 | 639 | 645 | 147.9 |
| D | 12 | 3 | 6564242 | 55207.99 | 423 | 415 | 118.9 |
| D | 8 | 195 | 1492933 | 12553.49 | 423 | 415 | 118.9 |
| D | 7 | 80 | 1199743 | 10087.48 | 423 | 415 | 118.9 |
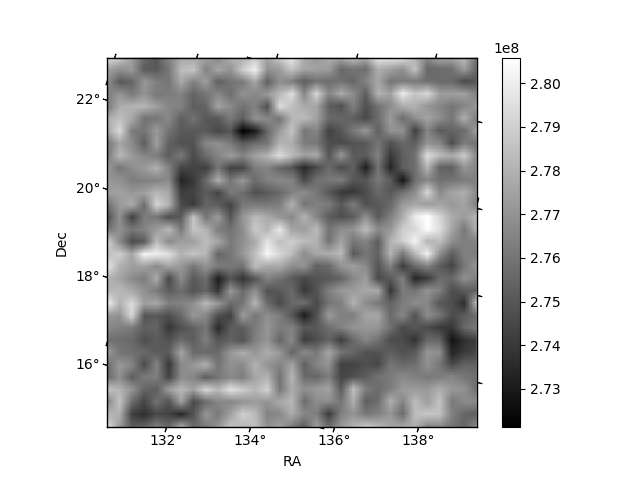
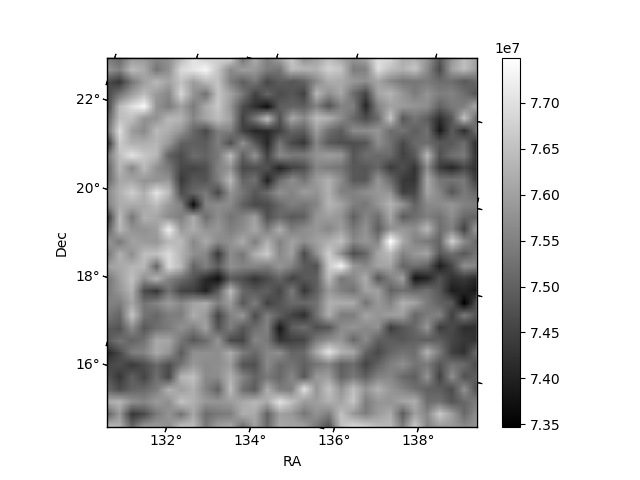
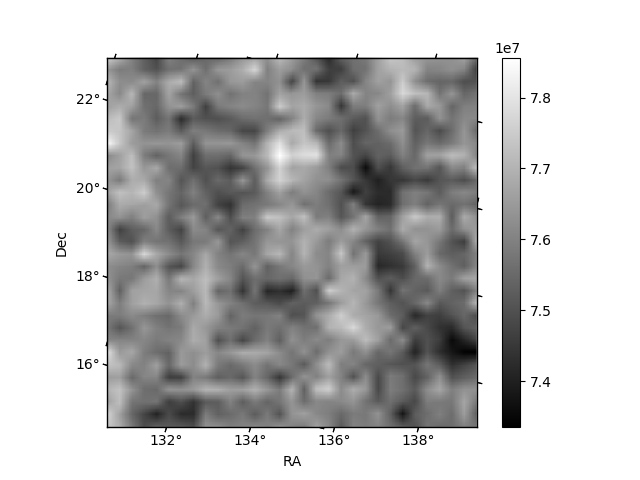
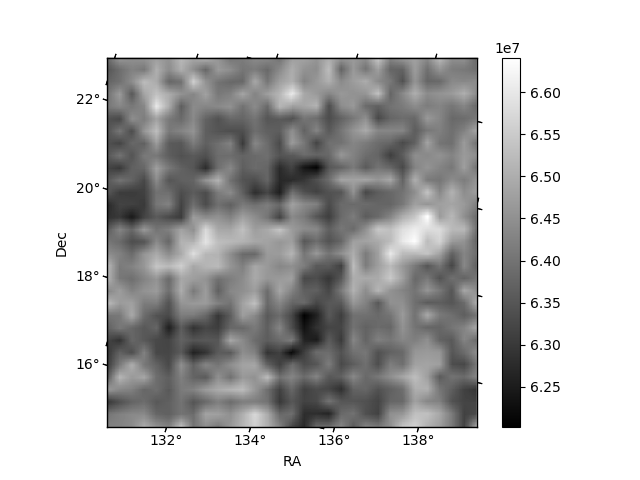
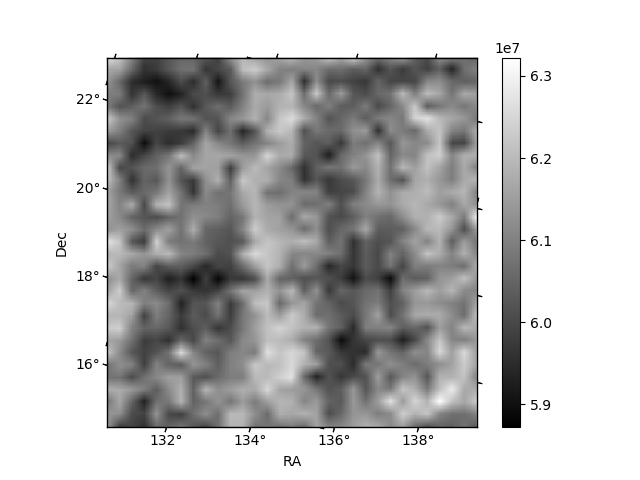
Histogram calculated using DETX and DETY for each event in the final _common_clean file
| Quadrant A | 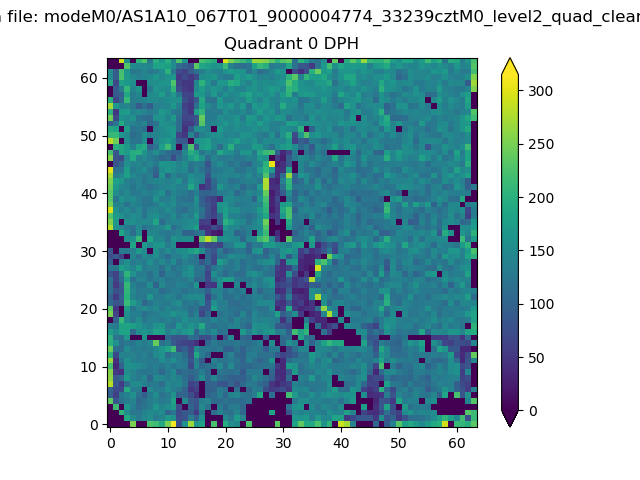 |
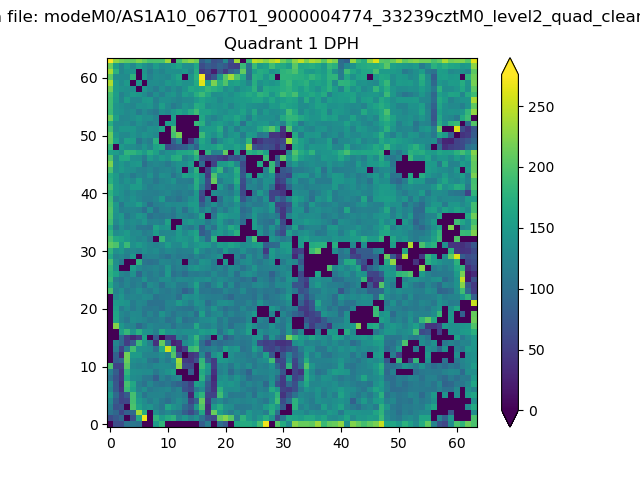 |
Quadrant B |
|---|---|---|---|
| Quadrant D | 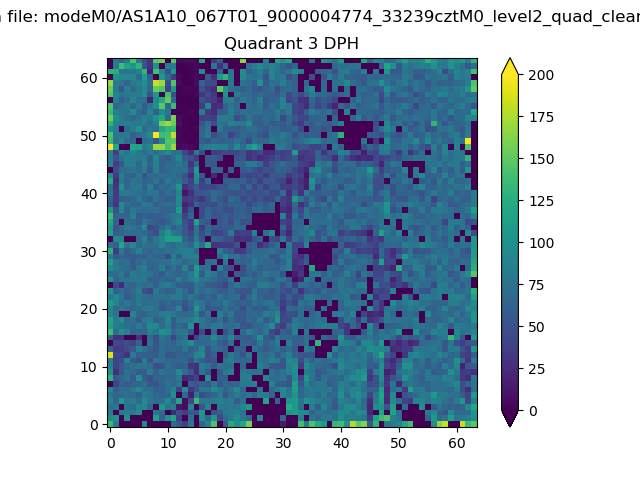 |
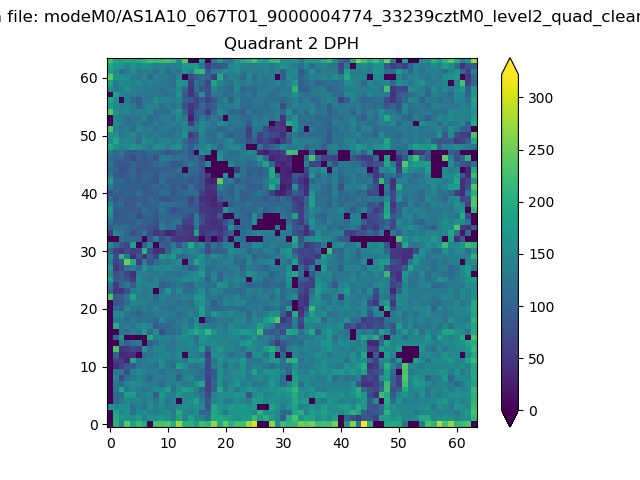 |
Quadrant C |
| Plot type | Count rate plots | Images |
|---|---|---|
| Comparison with Poisson distribution Blue bars denote a histogram of data divided into 1 sec bins. Red curve is a Poisson curve with rate = median count rate of data. |
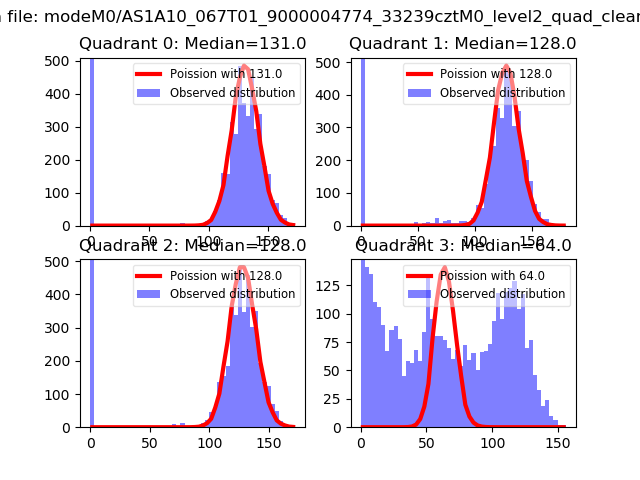 |
 |
| Quadrant-wise count rates Data is divided into 100 sec bins |
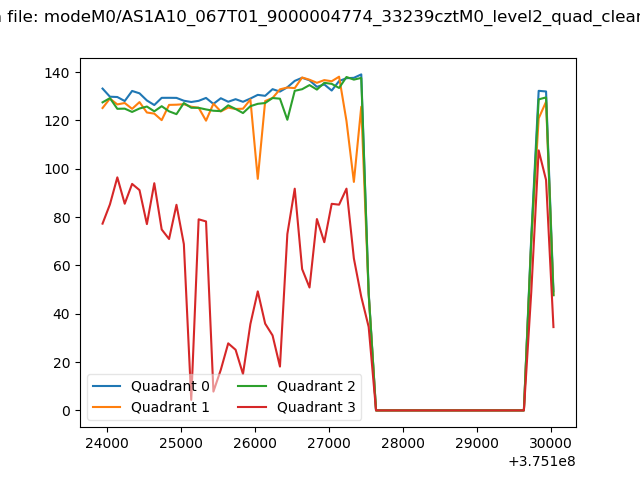 |
|
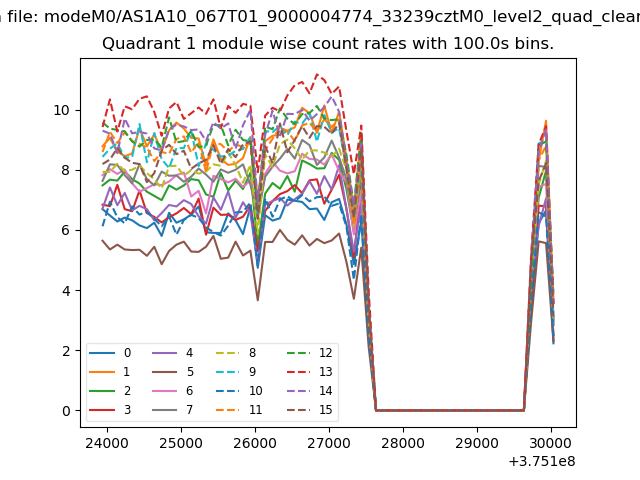
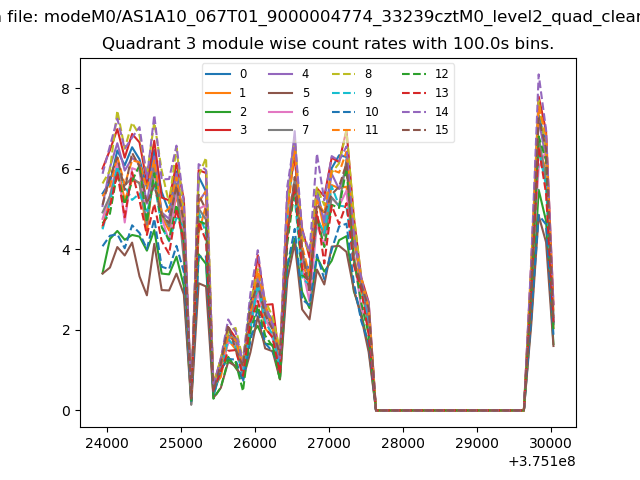
| Module-wise count rates for Quadrant A Data is divided into 100 sec bins |
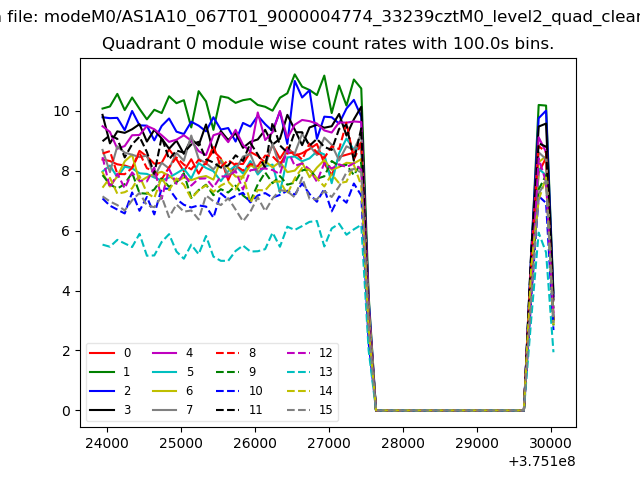 |
 |
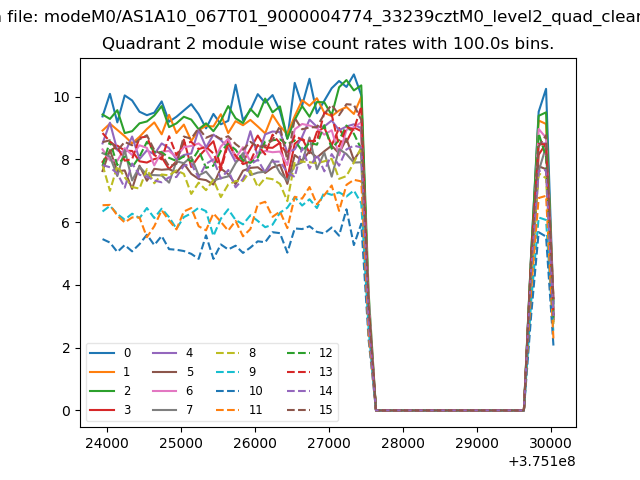
| Module-wise count rates for Quadrant B Data is divided into 100 sec bins |
 |
 |
| Module-wise count rates for Quadrant C Data is divided into 100 sec bins |
 |
 |
| Module-wise count rates for Quadrant D Data is divided into 100 sec bins |
 |
 |
| Parameter | Plot |
|---|---|
| CZT HV Monitor | 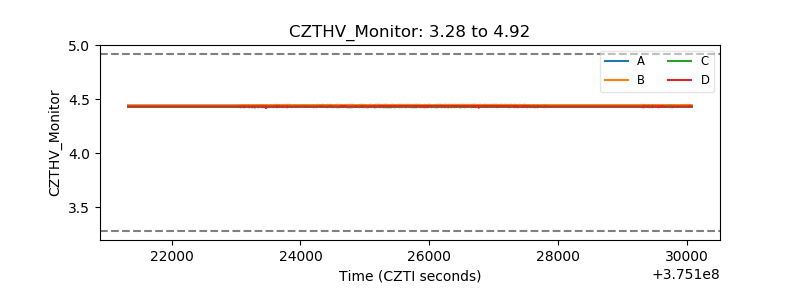 |
| D_VDD | 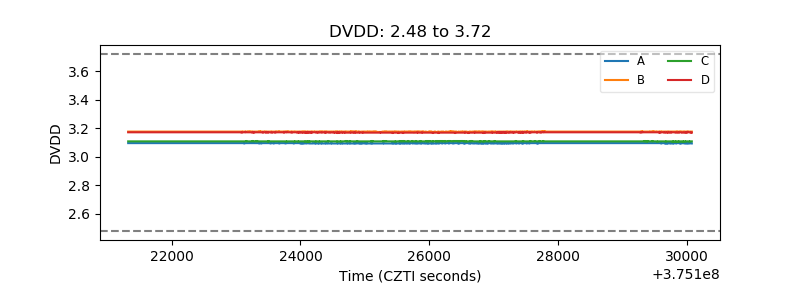 |
| Temperature 1 | 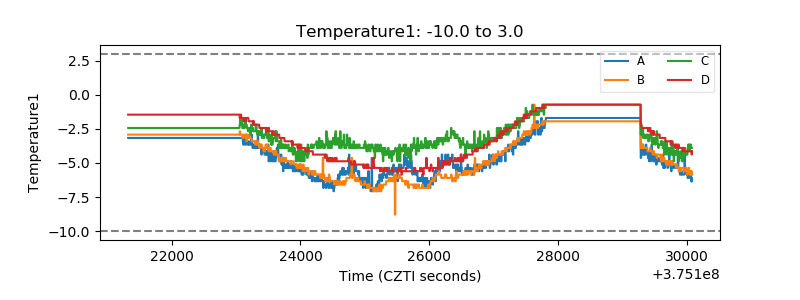 |
| Veto HV Monitor | 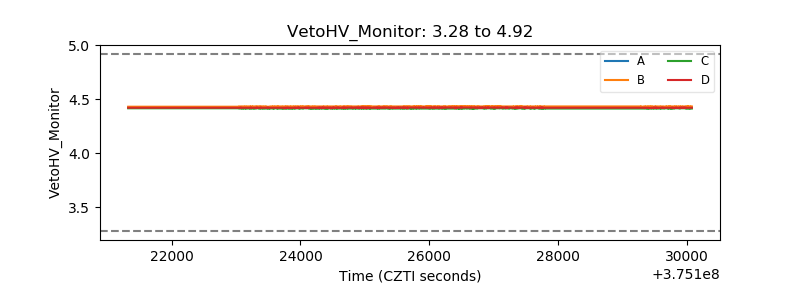 |
| Veto LLD | 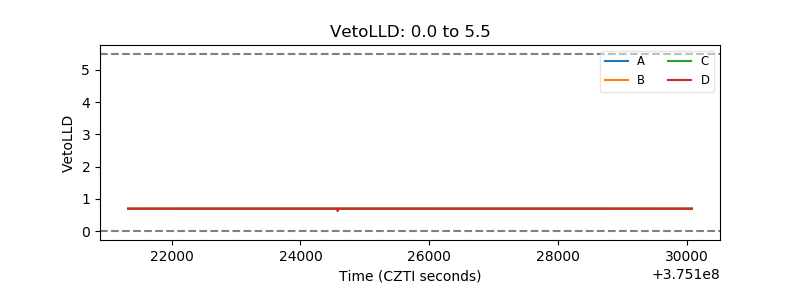 |
| Alpha Counter | 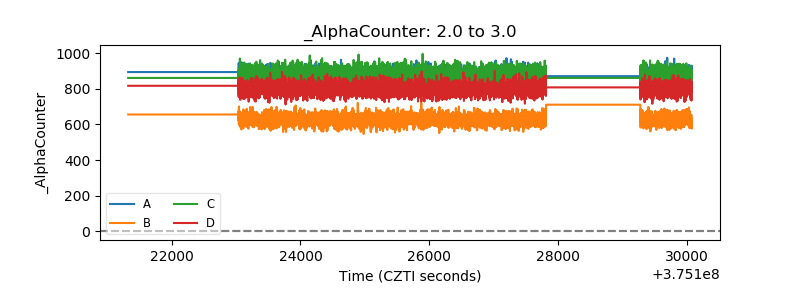 |
| _CPM_Rate | 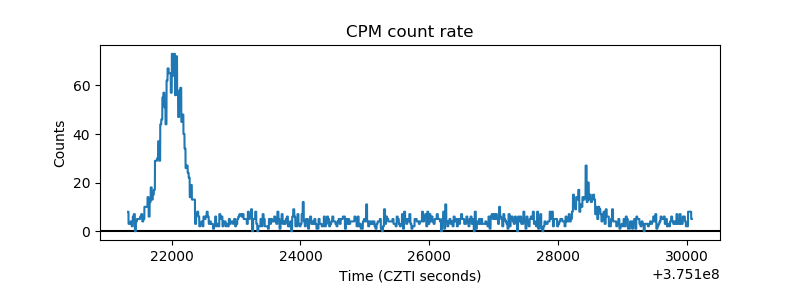 |
| CZT Counter | 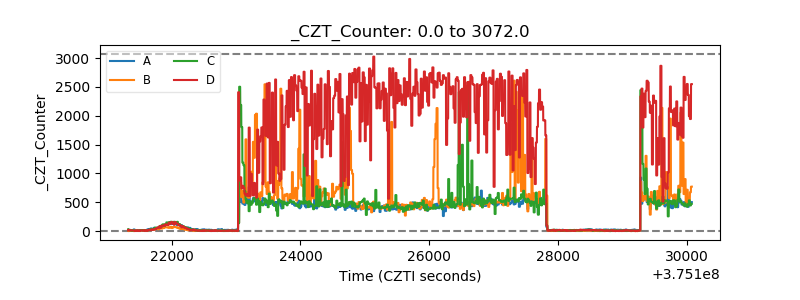 |
| +2.5 Volts monitor | 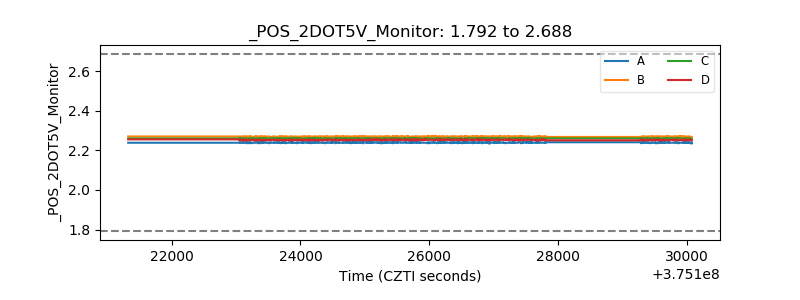 |
| +5 Volts monitor |  |
| _ROLL_ROT | 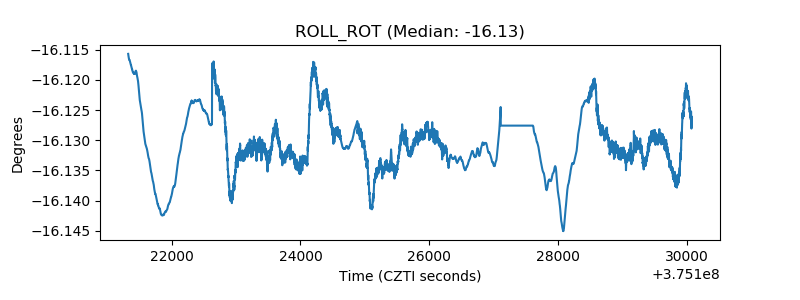 |
| _Roll_DEC | 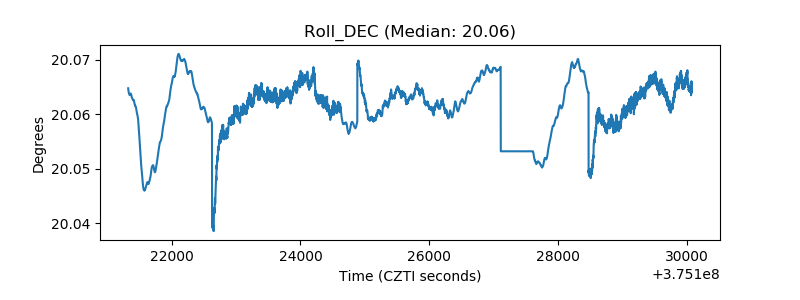 |
| _Roll_RA | 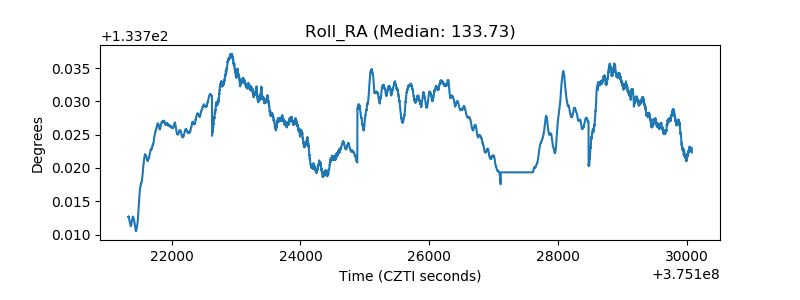 |
| Veto Counter | 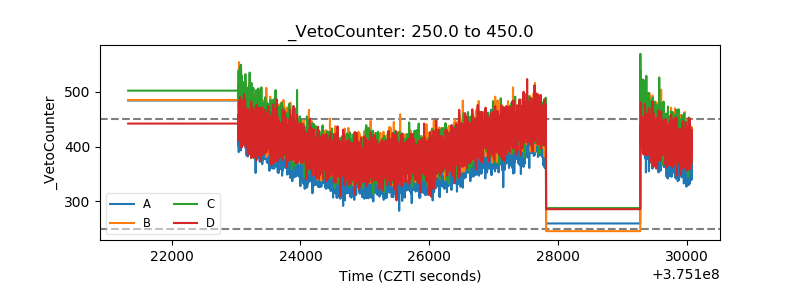 |