| Param | Original file | Final file |
|---|---|---|
| Filename | modeM0/AS1A10_067T01_9000004774_33240cztM0_level2.evt | modeM0/AS1A10_067T01_9000004774_33240cztM0_level2_quad_clean.evt |
| Size (bytes) | 743,757,120 | 79,113,600 |
| Size | 709.3 MB | 75.4 MB |
| Events in quadrant A | 3,004,324 | 565,690 |
| Events in quadrant B | 3,888,095 | 556,337 |
| Events in quadrant C | 3,095,515 | 556,419 |
| Events in quadrant D | 12,128,703 | 294,293 |
| Mode M9 | |||
|---|---|---|---|
| Quadrant | BADHDUFLAG | Total packets | Discarded packets |
| A | 0 | 28 | 0 |
| B | 0 | 28 | 0 |
| C | 0 | 28 | 0 |
| D | 0 | 28 | 0 |
| Mode SS | |||
|---|---|---|---|
| Quadrant | BADHDUFLAG | Total packets | Discarded packets |
| A | 0 | 124 | 0 |
| B | 0 | 124 | 0 |
| C | 0 | 124 | 0 |
| D | 0 | 124 | 0 |
| Mode M0 | |||
|---|---|---|---|
| Quadrant | BADHDUFLAG | Total packets | Discarded packets |
| A | 0 | 12815 | 3 |
| B | 0 | 15511 | 2 |
| C | 0 | 13127 | 2 |
| D | 0 | 40252 | 2 |
| Quadrant | Total seconds | Saturated seconds | Saturation percentage |
|---|---|---|---|
| A | 6037 | 69 | 1.142952% |
| B | 6037 | 189 | 3.130694% |
| C | 6037 | 79 | 1.308597% |
| D | 6037 | 3600 | 59.632268% |
Noise dominated data is calculated using 1-second bins in cleaned event files. If a bin has >2000 counts, and if more than 50% of those come from <1% of pixels, then it is considered to be noise-dominated and hence unusable.
| Quadrant | # 1 sec bins | Bins with >0 counts | Bins with >2000 counts | High rate bins dominated by noise | Noise dominated (total time) | Noise dominated (detector-on time) | Marked lightcurve |
|---|---|---|---|---|---|---|---|
| A | 8812 | 6039 | 49 | 49 | 0.56% | 0.81% | 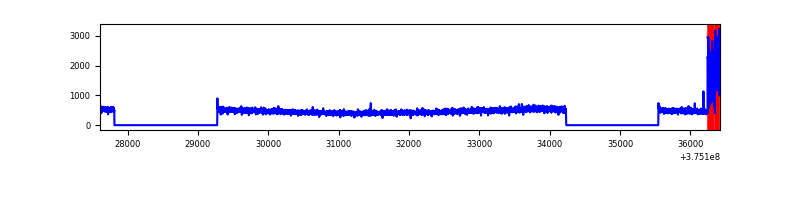 |
| B | 8812 | 6039 | 111 | 111 | 1.26% | 1.84% | 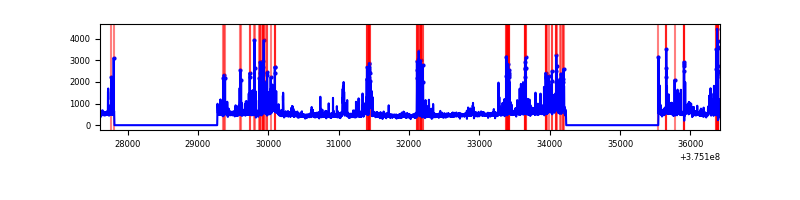 |
| C | 8812 | 6039 | 65 | 65 | 0.74% | 1.08% | 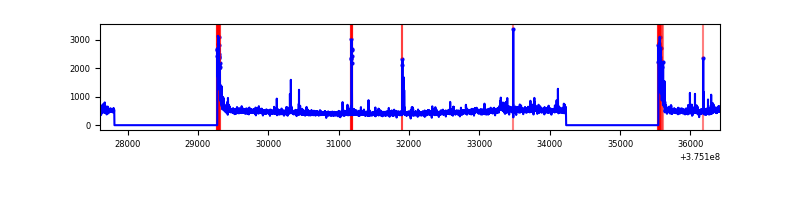 |
| D | 8812 | 6039 | 3139 | 3139 | 35.62% | 51.98% | 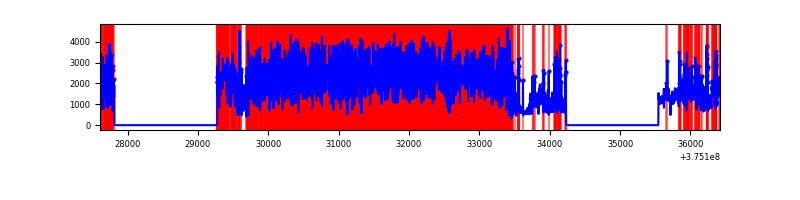 |
Top three noisy pixels from each quadrant. If the there are fewer than three noisy pixels in the level2.evt file, extra rows are filled as -1
| Pixel properties | Quadrant properties | ||||||
|---|---|---|---|---|---|---|---|
| Quadrant | DetID | PixID | Counts | Sigma | Mean | Median | Sigma |
| A | 15 | 169 | 217940 | 1511.09 | 715 | 700 | 143.8 |
| A | 13 | 6 | 16066 | 106.88 | 715 | 700 | 143.8 |
| A | 13 | 254 | 10841 | 70.54 | 715 | 700 | 143.8 |
| B | 5 | 172 | 433339 | 3161.07 | 703 | 683 | 136.9 |
| B | 4 | 170 | 356320 | 2598.35 | 703 | 683 | 136.9 |
| B | 5 | 200 | 91307 | 662.12 | 703 | 683 | 136.9 |
| C | 0 | 10 | 240684 | 1495.28 | 689 | 694 | 160.5 |
| C | 9 | 187 | 86602 | 535.26 | 689 | 694 | 160.5 |
| C | 10 | 49 | 23421 | 141.6 | 689 | 694 | 160.5 |
| D | 12 | 3 | 5742423 | 43083.73 | 484 | 473 | 133.3 |
| D | 8 | 195 | 2434299 | 18261.79 | 484 | 473 | 133.3 |
| D | 7 | 80 | 934621 | 7009.22 | 484 | 473 | 133.3 |
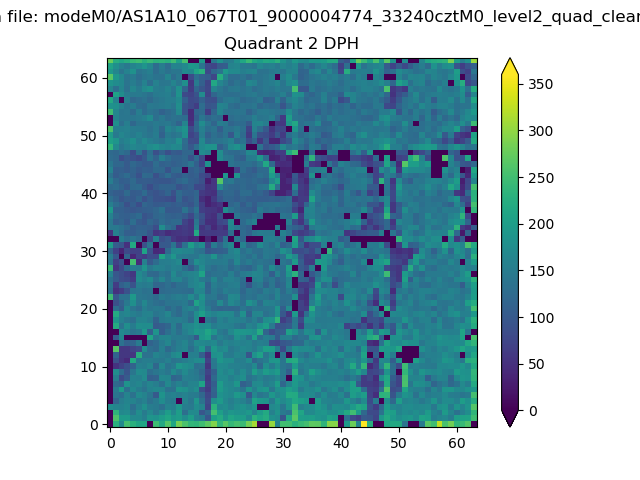
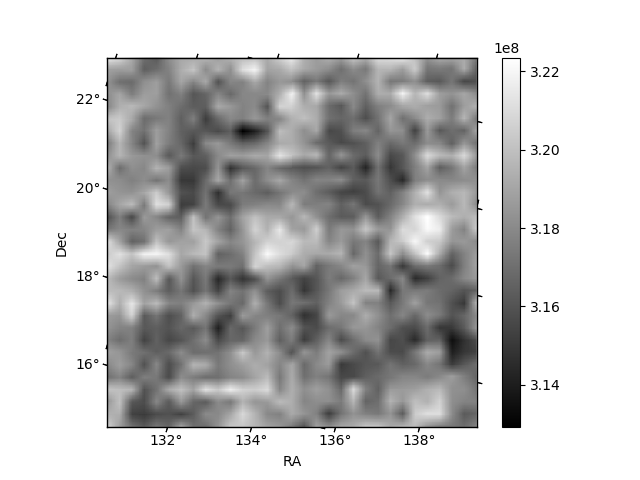
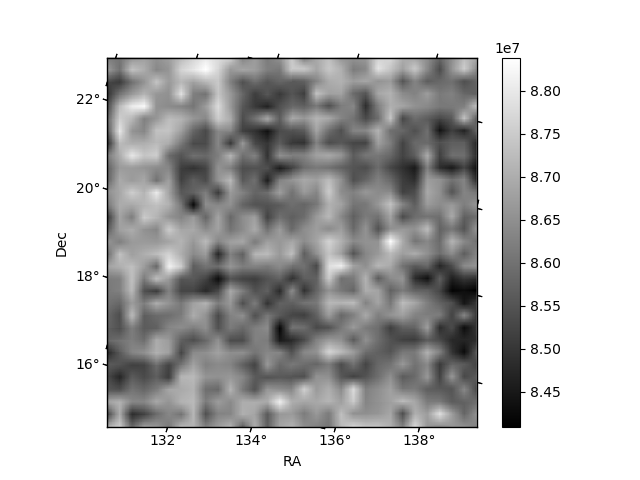
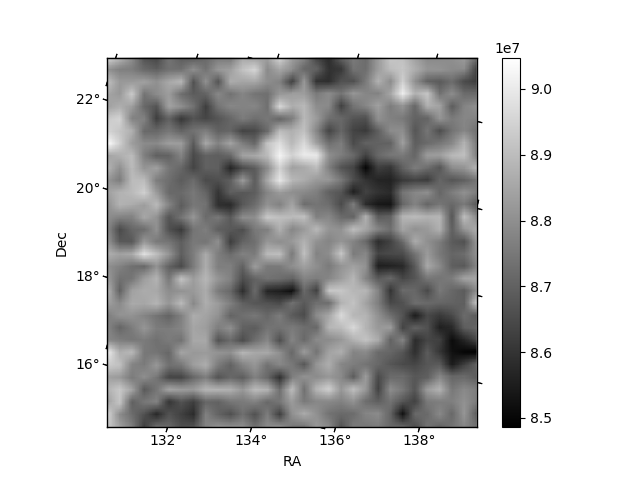
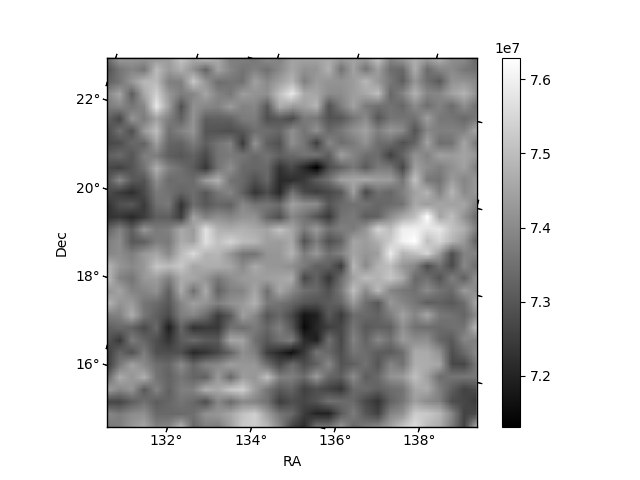
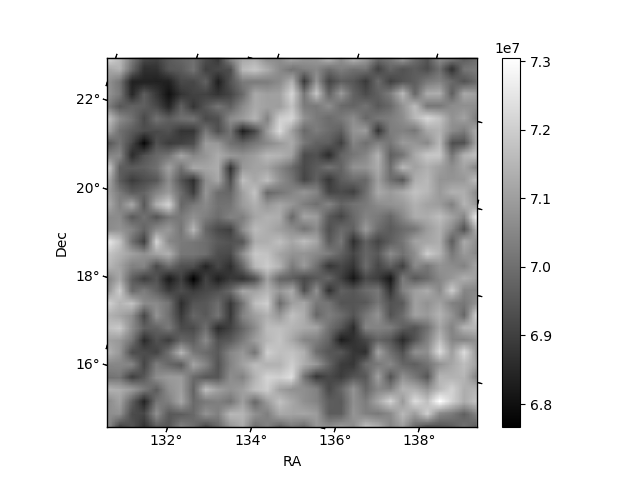
Histogram calculated using DETX and DETY for each event in the final _common_clean file
| Quadrant A | 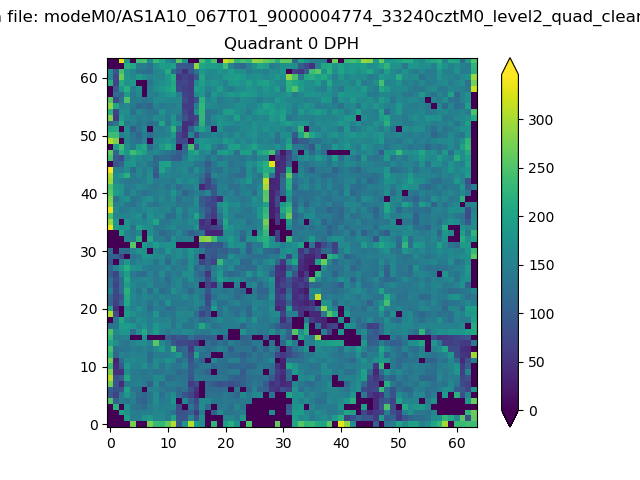 |
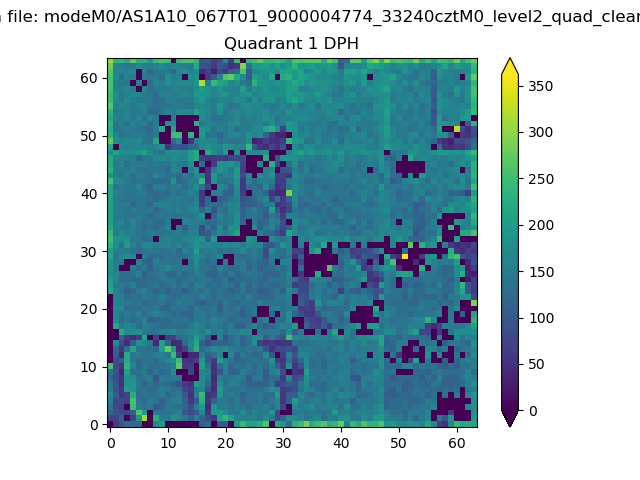 |
Quadrant B |
|---|---|---|---|
| Quadrant D | 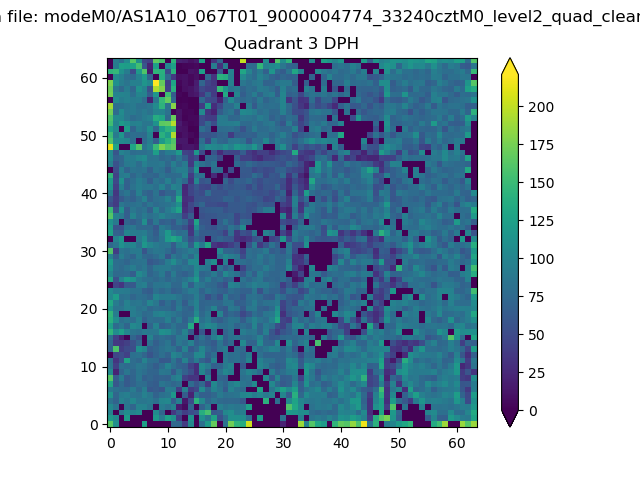 |
 |
Quadrant C |
| Plot type | Count rate plots | Images |
|---|---|---|
| Comparison with Poisson distribution Blue bars denote a histogram of data divided into 1 sec bins. Red curve is a Poisson curve with rate = median count rate of data. |
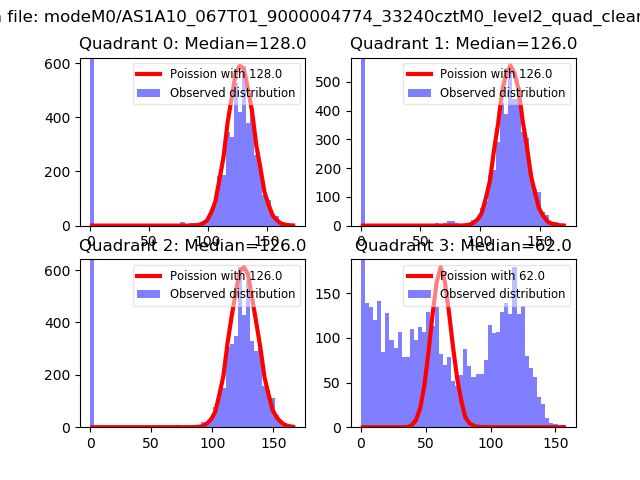 |
 |
| Quadrant-wise count rates Data is divided into 100 sec bins |
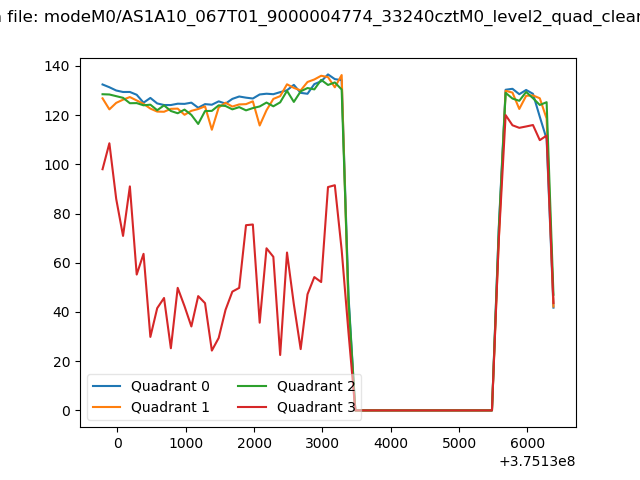 |
|
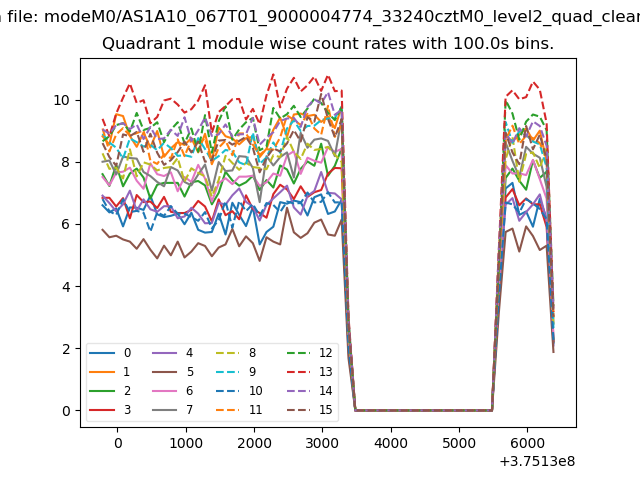
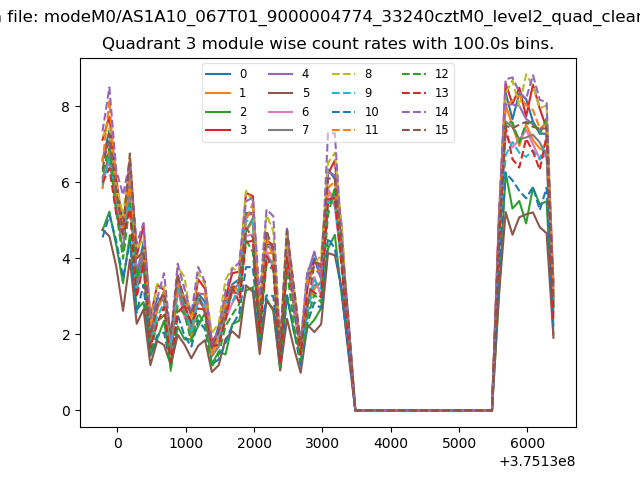
| Module-wise count rates for Quadrant A Data is divided into 100 sec bins |
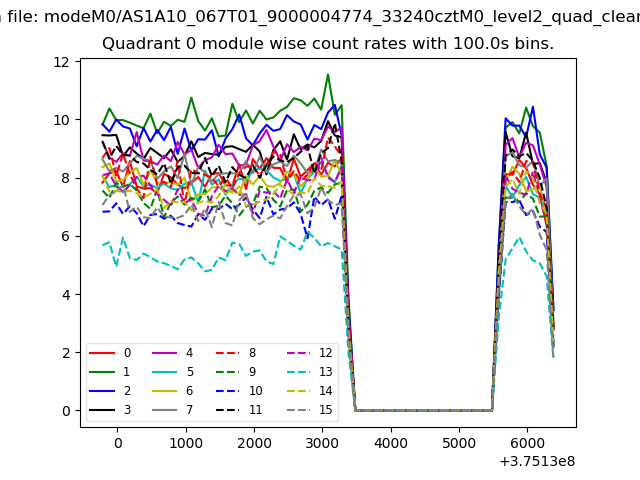 |
 |
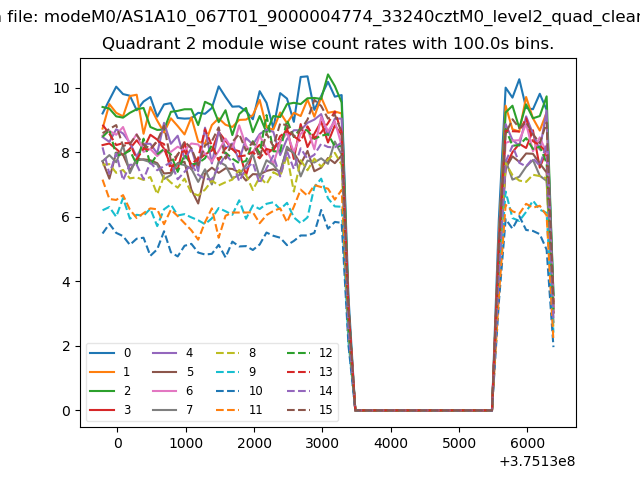
| Module-wise count rates for Quadrant B Data is divided into 100 sec bins |
 |
 |
| Module-wise count rates for Quadrant C Data is divided into 100 sec bins |
 |
 |
| Module-wise count rates for Quadrant D Data is divided into 100 sec bins |
 |
 |
| Parameter | Plot |
|---|---|
| CZT HV Monitor | 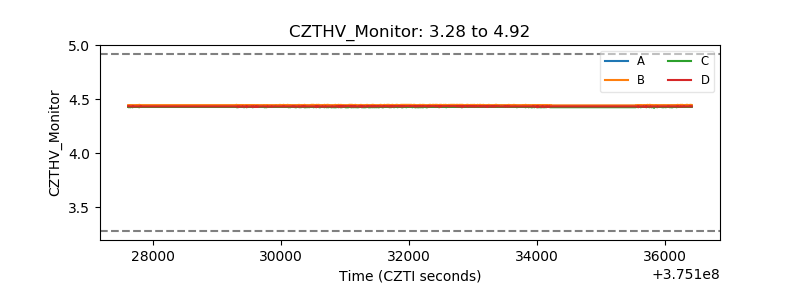 |
| D_VDD | 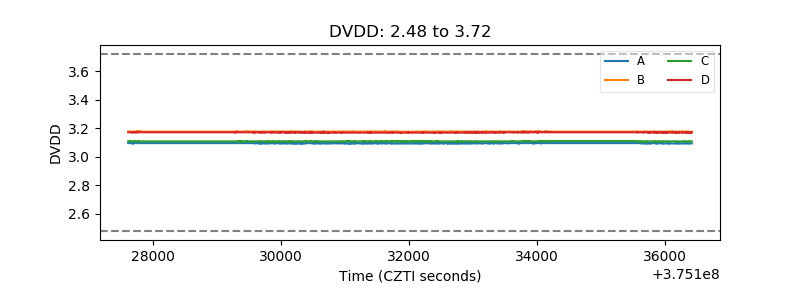 |
| Temperature 1 | 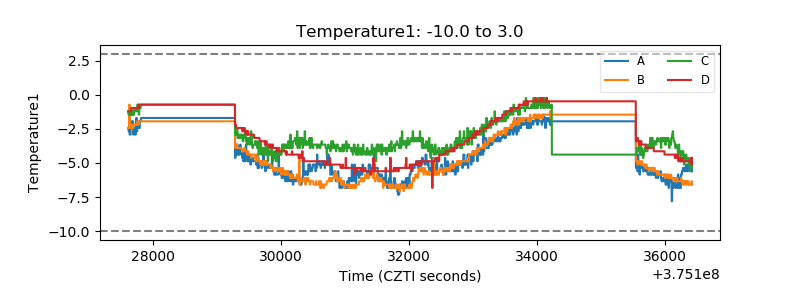 |
| Veto HV Monitor |  |
| Veto LLD |  |
| Alpha Counter | 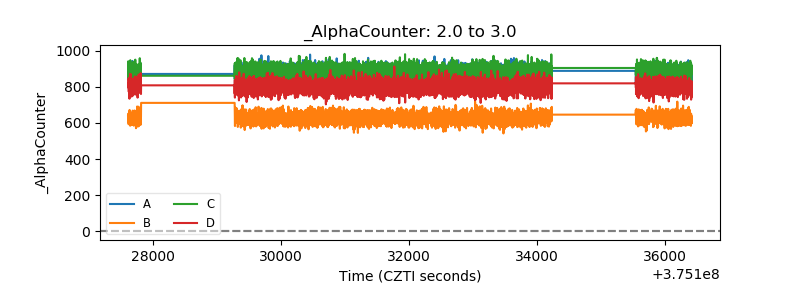 |
| _CPM_Rate | 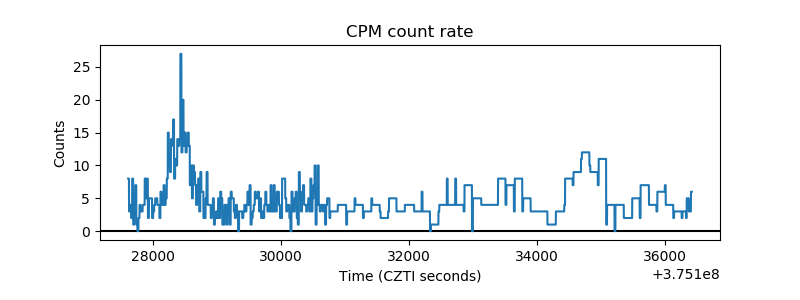 |
| CZT Counter | 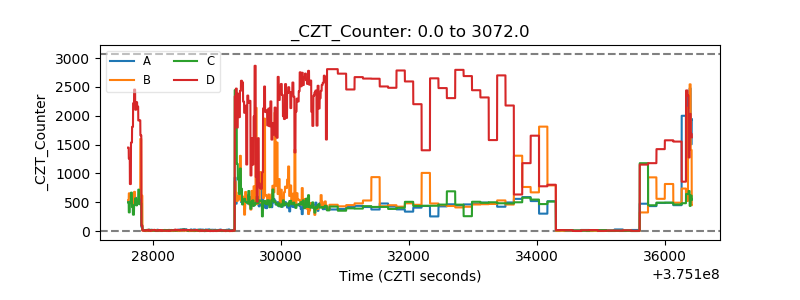 |
| +2.5 Volts monitor |  |
| +5 Volts monitor |  |
| _ROLL_ROT | 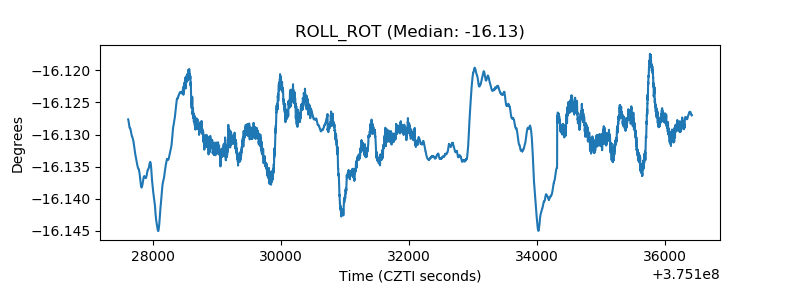 |
| _Roll_DEC | 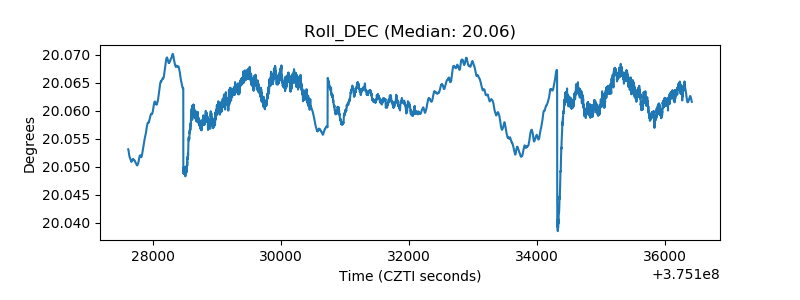 |
| _Roll_RA | 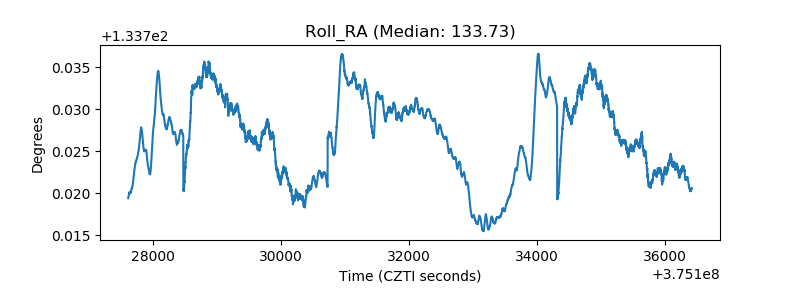 |
| Veto Counter | 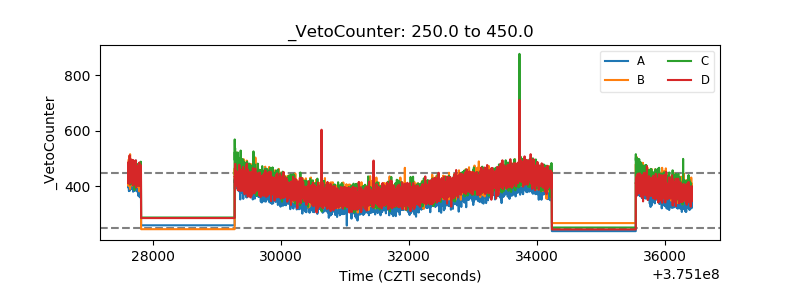 |