| Param | Original file | Final file |
|---|---|---|
| Filename | modeM0/AS1A10_067T01_9000004774_33244cztM0_level2.evt | modeM0/AS1A10_067T01_9000004774_33244cztM0_level2_quad_clean.evt |
| Size (bytes) | 2,154,142,080 | 168,854,400 |
| Size | 2.0 GB | 161.0 MB |
| Events in quadrant A | 27,623,511 | 807,350 |
| Events in quadrant B | 8,419,192 | 1,189,521 |
| Events in quadrant C | 7,037,699 | 1,183,664 |
| Events in quadrant D | 21,229,705 | 971,617 |
| Mode M9 | |||
|---|---|---|---|
| Quadrant | BADHDUFLAG | Total packets | Discarded packets |
| A | 0 | 25 | 0 |
| B | 0 | 25 | 0 |
| C | 0 | 25 | 0 |
| D | 0 | 25 | 0 |
| Mode SS | |||
|---|---|---|---|
| Quadrant | BADHDUFLAG | Total packets | Discarded packets |
| A | 0 | 284 | 0 |
| B | 0 | 284 | 0 |
| C | 0 | 284 | 0 |
| D | 0 | 284 | 0 |
| Mode M0 | |||
|---|---|---|---|
| Quadrant | BADHDUFLAG | Total packets | Discarded packets |
| A | 0 | 91453 | 3 |
| B | 0 | 34527 | 3 |
| C | 0 | 30297 | 3 |
| D | 0 | 72934 | 3 |
| Quadrant | Total seconds | Saturated seconds | Saturation percentage |
|---|---|---|---|
| A | 13854 | 9810 | 70.809874% |
| B | 13854 | 546 | 3.941100% |
| C | 13854 | 170 | 1.227082% |
| D | 13854 | 3727 | 26.901978% |
Noise dominated data is calculated using 1-second bins in cleaned event files. If a bin has >2000 counts, and if more than 50% of those come from <1% of pixels, then it is considered to be noise-dominated and hence unusable.
| Quadrant | # 1 sec bins | Bins with >0 counts | Bins with >2000 counts | High rate bins dominated by noise | Noise dominated (total time) | Noise dominated (detector-on time) | Marked lightcurve |
|---|---|---|---|---|---|---|---|
| A | 16480 | 13855 | 7890 | 7890 | 47.88% | 56.95% | 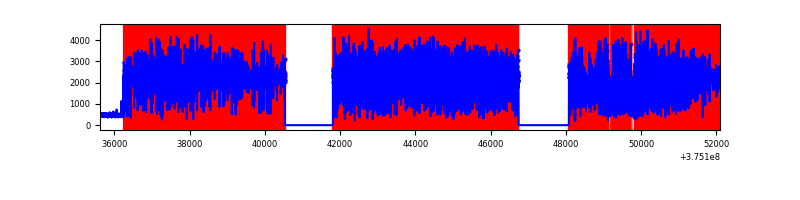 |
| B | 16480 | 13856 | 342 | 342 | 2.08% | 2.47% | 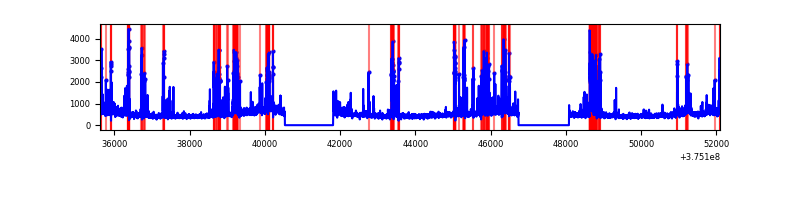 |
| C | 16480 | 13856 | 137 | 137 | 0.83% | 0.99% | 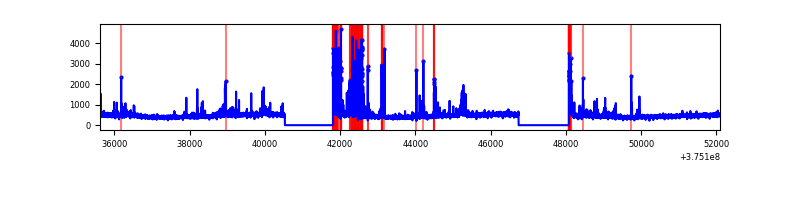 |
| D | 16479 | 13855 | 3106 | 3106 | 18.85% | 22.42% | 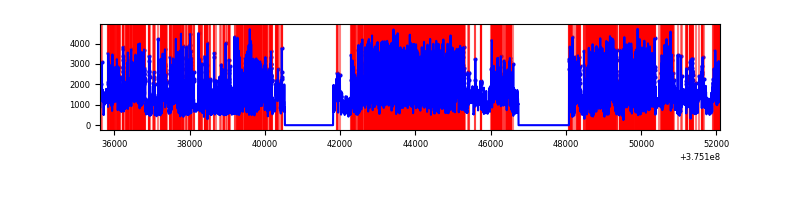 |
Top three noisy pixels from each quadrant. If the there are fewer than three noisy pixels in the level2.evt file, extra rows are filled as -1
| Pixel properties | Quadrant properties | ||||||
|---|---|---|---|---|---|---|---|
| Quadrant | DetID | PixID | Counts | Sigma | Mean | Median | Sigma |
| A | 15 | 169 | 23520801 | 112211.36 | 1054 | 1035 | 209.6 |
| A | 13 | 6 | 22684 | 103.28 | 1054 | 1035 | 209.6 |
| A | 13 | 254 | 16103 | 71.89 | 1054 | 1035 | 209.6 |
| B | 5 | 172 | 1474599 | 4934.08 | 1567 | 1525 | 298.6 |
| B | 4 | 170 | 210273 | 699.2 | 1567 | 1525 | 298.6 |
| B | 5 | 200 | 145276 | 481.5 | 1567 | 1525 | 298.6 |
| C | 1 | 23 | 363721 | 1017.55 | 1544 | 1559 | 355.9 |
| C | 9 | 187 | 189859 | 529.06 | 1544 | 1559 | 355.9 |
| C | 0 | 10 | 185097 | 515.68 | 1544 | 1559 | 355.9 |
| D | 12 | 3 | 6991046 | 20161.41 | 1394 | 1352 | 346.7 |
| D | 8 | 195 | 5313693 | 15323.17 | 1394 | 1352 | 346.7 |
| D | 2 | 250 | 761328 | 2192.11 | 1394 | 1352 | 346.7 |
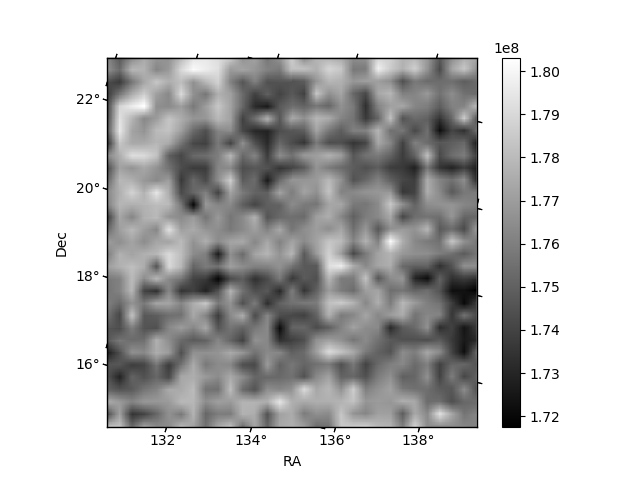
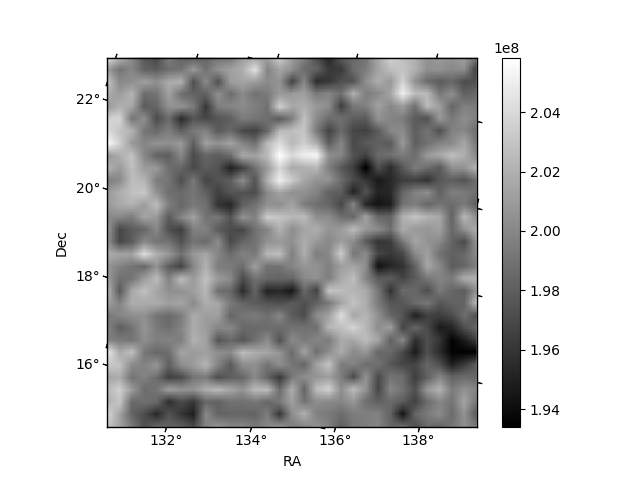
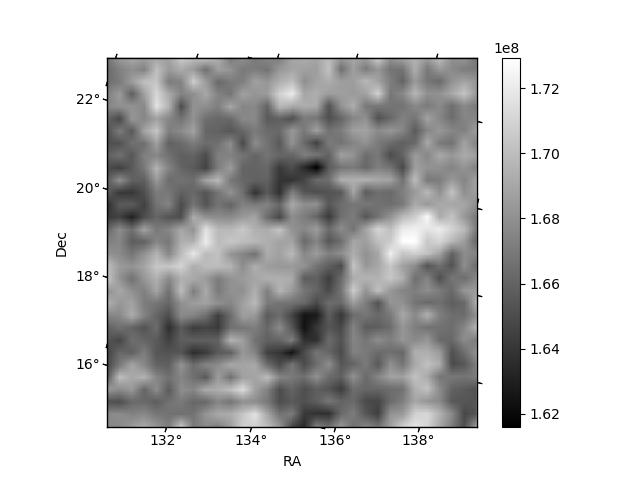
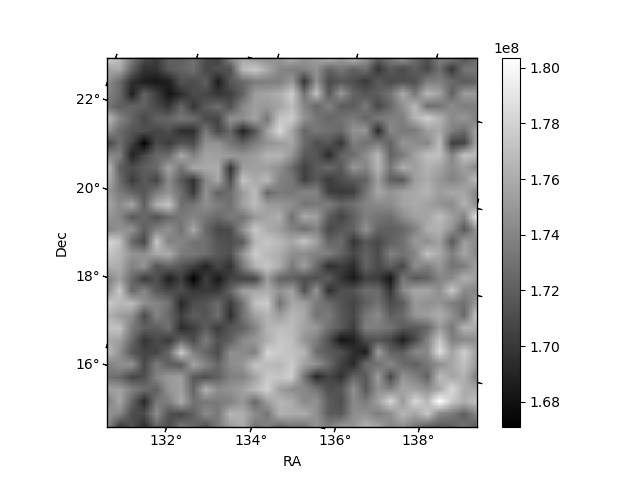
Histogram calculated using DETX and DETY for each event in the final _common_clean file
| Quadrant A |  |
 |
Quadrant B |
|---|---|---|---|
| Quadrant D | 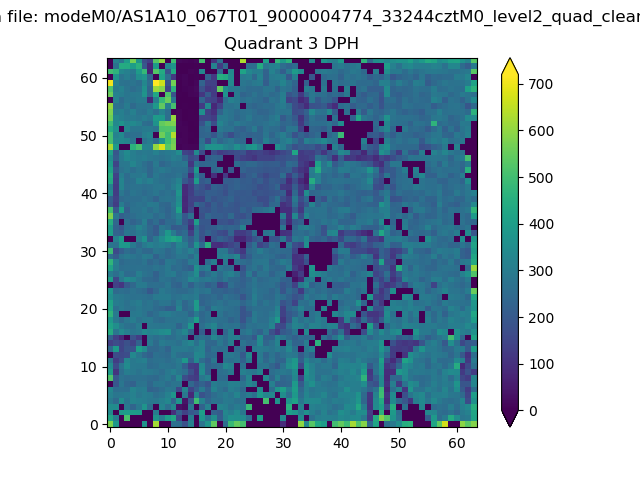 |
 |
Quadrant C |
| Plot type | Count rate plots | Images |
|---|---|---|
| Comparison with Poisson distribution Blue bars denote a histogram of data divided into 1 sec bins. Red curve is a Poisson curve with rate = median count rate of data. |
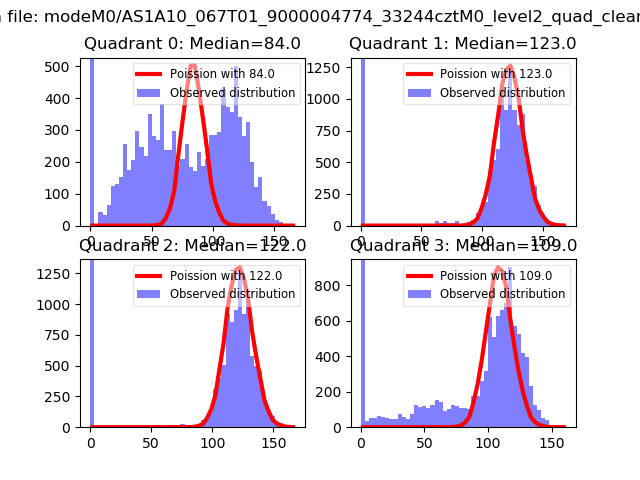 |
 |
| Quadrant-wise count rates Data is divided into 100 sec bins |
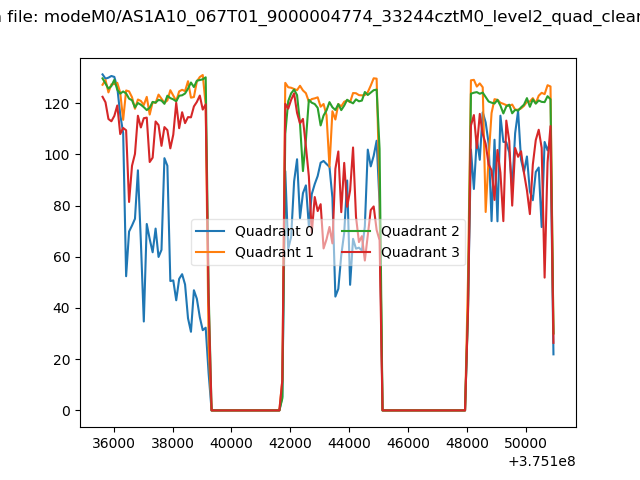 |
|
| Module-wise count rates for Quadrant A Data is divided into 100 sec bins |
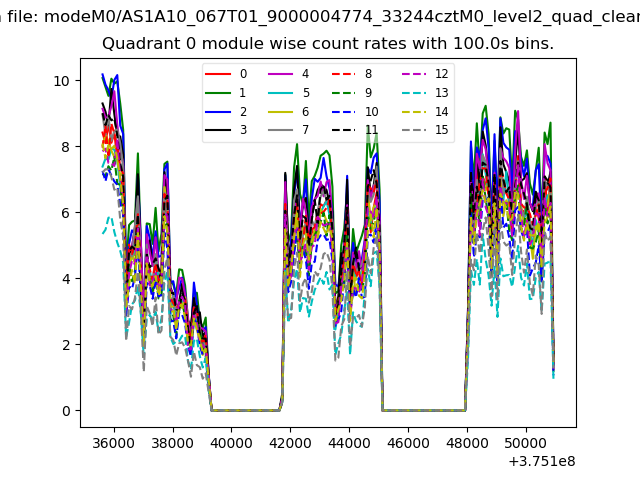 |
 |
| Module-wise count rates for Quadrant B Data is divided into 100 sec bins |
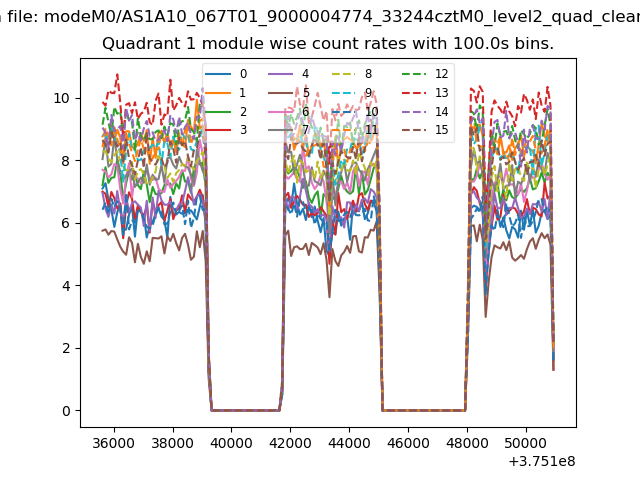 |
 |
| Module-wise count rates for Quadrant C Data is divided into 100 sec bins |
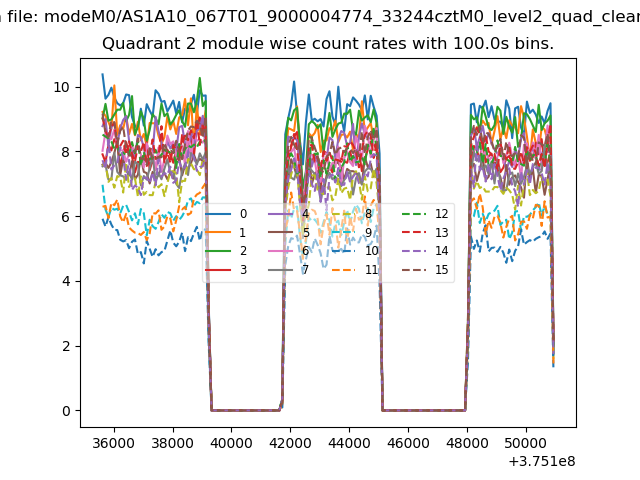 |
 |
| Module-wise count rates for Quadrant D Data is divided into 100 sec bins |
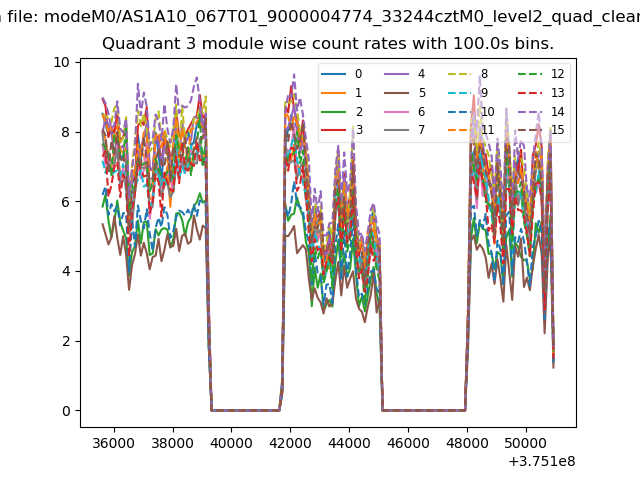 |
 |
| Parameter | Plot |
|---|---|
| CZT HV Monitor |  |
| D_VDD | 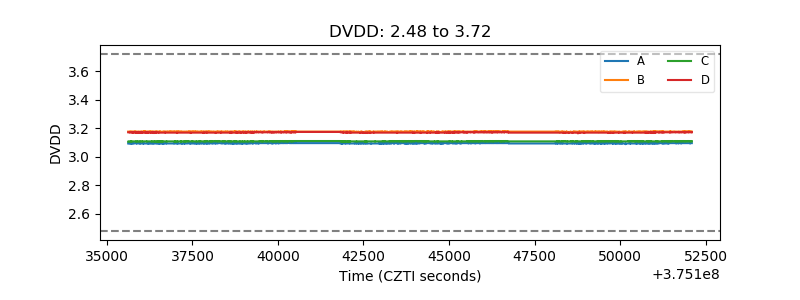 |
| Temperature 1 | 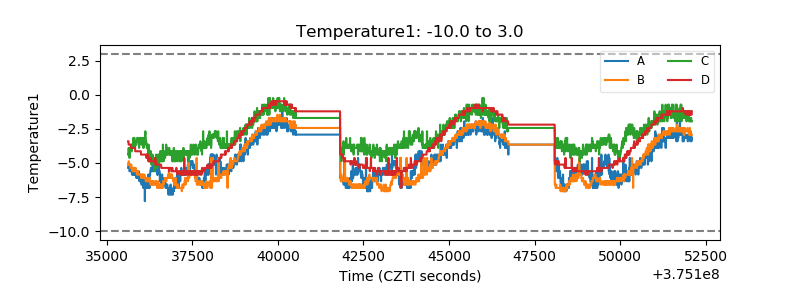 |
| Veto HV Monitor | 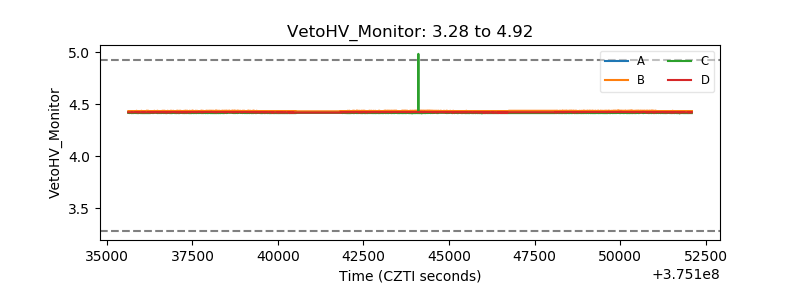 |
| Veto LLD | 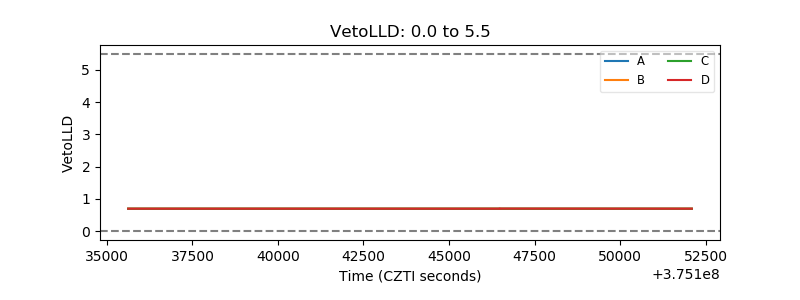 |
| Alpha Counter | 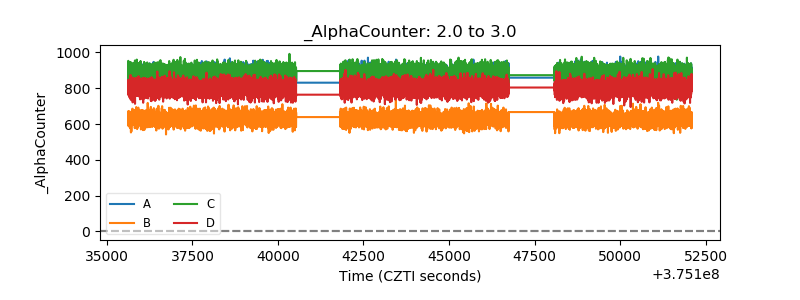 |
| _CPM_Rate | 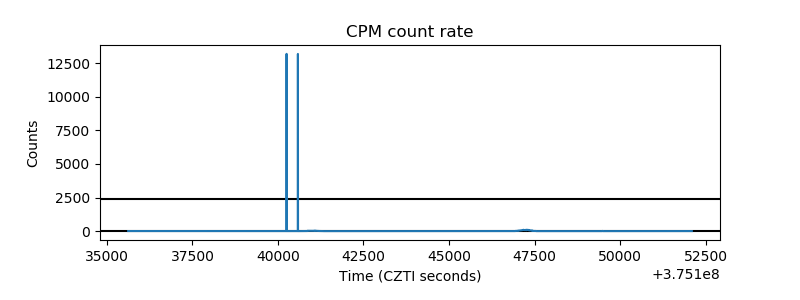 |
| CZT Counter | 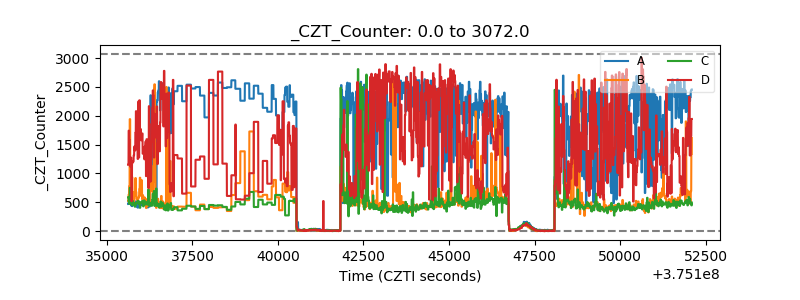 |
| +2.5 Volts monitor |  |
| +5 Volts monitor |  |
| _ROLL_ROT | 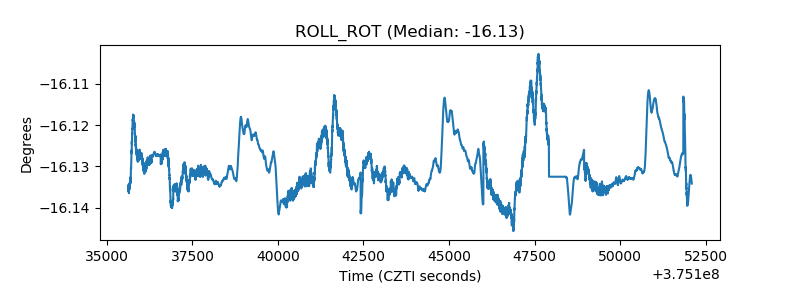 |
| _Roll_DEC | 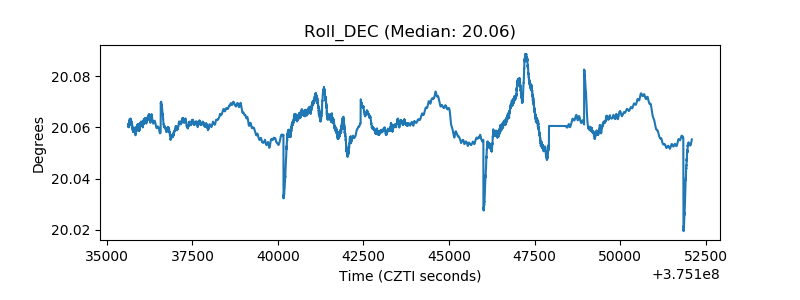 |
| _Roll_RA | 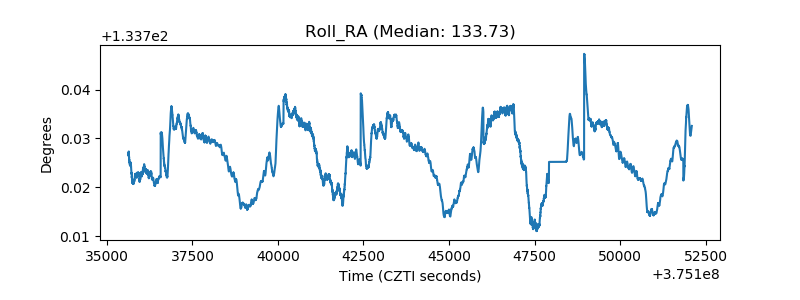 |
| Veto Counter | 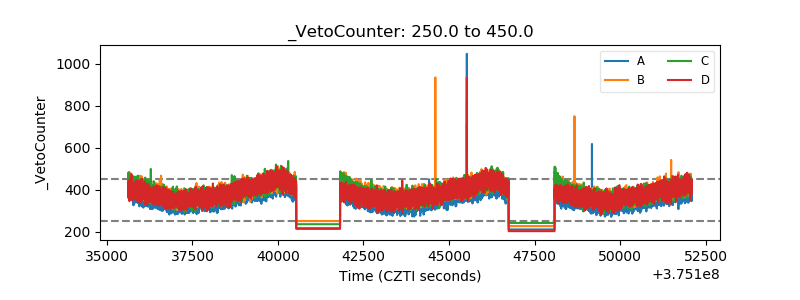 |