| Param | Original file | Final file |
|---|---|---|
| Filename | modeM0/AS1A11_046T01_9000004776cztM0_level2.fits | modeM0/AS1A11_046T01_9000004776cztM0_level2_quad_clean.evt |
| Size (bytes) | 326,905,920 | 296,159,040 |
| Size | 311.8 MB | 282.4 MB |
| Events in quadrant A | 1,931,942 | 1,525,062 |
| Events in quadrant B | 1,920,746 | 1,796,135 |
| Events in quadrant C | 2,024,748 | 1,804,622 |
| Events in quadrant D | 1,723,160 | 1,545,920 |
| Mode SS | |||
|---|---|---|---|
| Quadrant | BADHDUFLAG | Total packets | Discarded packets |
| A | 0 | 684 | 0 |
| B | 0 | 684 | 0 |
| C | 0 | 684 | 0 |
| D | 0 | 684 | 0 |
| Mode M0 | |||
|---|---|---|---|
| Quadrant | BADHDUFLAG | Total packets | Discarded packets |
| A | 0 | 133880 | 0 |
| B | 0 | 94710 | 0 |
| C | 0 | 70361 | 0 |
| D | 0 | 117197 | 0 |
| Mode M9 | |||
|---|---|---|---|
| Quadrant | BADHDUFLAG | Total packets | Discarded packets |
| A | 0 | 149 | 0 |
| B | 0 | 149 | 0 |
| C | 0 | 149 | 0 |
| D | 0 | 149 | 0 |
| Quadrant | Total seconds | Saturated seconds | Saturation percentage |
|---|---|---|---|
| A | 33407 | 7575 | 22.674888% |
| B | 33407 | 2301 | 6.887778% |
| C | 33407 | 198 | 0.592690% |
| D | 33407 | 1856 | 5.555722% |
Noise dominated data is calculated using 1-second bins in cleaned event files. If a bin has >2000 counts, and if more than 50% of those come from <1% of pixels, then it is considered to be noise-dominated and hence unusable.
| Quadrant | # 1 sec bins | Bins with >0 counts | Bins with >2000 counts | High rate bins dominated by noise | Noise dominated (total time) | Noise dominated (detector-on time) | Marked lightcurve |
|---|---|---|---|---|---|---|---|
| A | 48261 | 33395 | 0 | 0 | 0.00% | 0.00% |  |
| B | 48261 | 33371 | 0 | 0 | 0.00% | 0.00% | 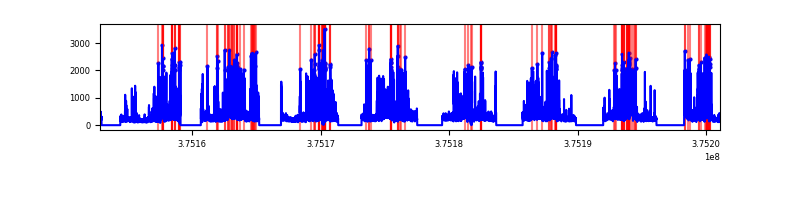 |
| C | 48261 | 33406 | 0 | 0 | 0.00% | 0.00% |  |
| D | 48261 | 33369 | 0 | 0 | 0.00% | 0.00% |  |
Top three noisy pixels from each quadrant. If the there are fewer than three noisy pixels in the level2.evt file, extra rows are filled as -1
| Pixel properties | Quadrant properties | ||||||
|---|---|---|---|---|---|---|---|
| Quadrant | DetID | PixID | Counts | Sigma | Mean | Median | Sigma |
| A | 7 | 110 | 1550 | 8.64 | 505 | 481 | 123.7 |
| A | 9 | 19 | 1536 | 8.53 | 505 | 481 | 123.7 |
| A | 0 | 29 | 1531 | 8.49 | 505 | 481 | 123.7 |
| B | 2 | 9 | 1650 | 11.4 | 510 | 491 | 101.6 |
| B | 3 | 80 | 1535 | 10.27 | 510 | 491 | 101.6 |
| B | 2 | 8 | 1352 | 8.47 | 510 | 491 | 101.6 |
| C | 1 | 81 | 1838 | 9.79 | 535 | 509 | 135.7 |
| C | 1 | 80 | 1663 | 8.5 | 535 | 509 | 135.7 |
| C | 1 | 65 | 1466 | 7.05 | 535 | 509 | 135.7 |
| D | 10 | 113 | 1285 | 6.38 | 493 | 455 | 130.0 |
| D | 4 | 160 | 1283 | 6.37 | 493 | 455 | 130.0 |
| D | 10 | 189 | 1282 | 6.36 | 493 | 455 | 130.0 |
Histogram calculated using DETX and DETY for each event in the final _common_clean file
| Quadrant A | 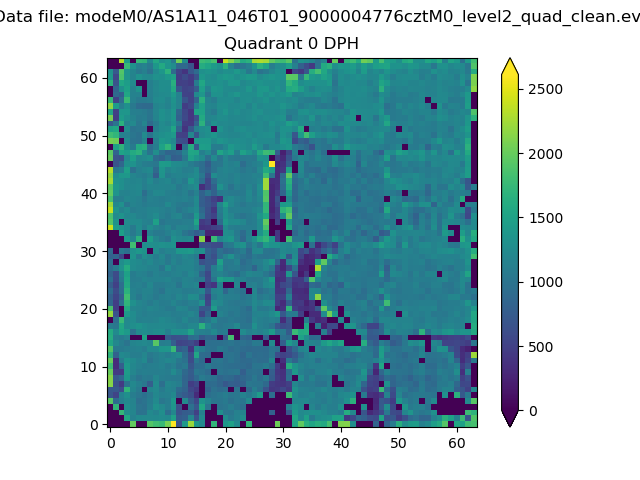 |
 |
Quadrant B |
|---|---|---|---|
| Quadrant D |  |
 |
Quadrant C |
| Plot type | Count rate plots | Images |
|---|---|---|
| Comparison with Poisson distribution Blue bars denote a histogram of data divided into 1 sec bins. Red curve is a Poisson curve with rate = median count rate of data. |
 |
 |
| Quadrant-wise count rates Data is divided into 100 sec bins |
 |
|
| Module-wise count rates for Quadrant A Data is divided into 100 sec bins |
 |
 |
| Module-wise count rates for Quadrant B Data is divided into 100 sec bins |
 |
 |
| Module-wise count rates for Quadrant C Data is divided into 100 sec bins |
 |
 |
| Module-wise count rates for Quadrant D Data is divided into 100 sec bins |
 |
 |
| Parameter | Plot |
|---|---|
| CZT HV Monitor |  |
| D_VDD |  |
| Temperature 1 |  |
| Veto HV Monitor |  |
| Veto LLD |  |
| Alpha Counter |  |
| _CPM_Rate |  |
| CZT Counter |  |
| +2.5 Volts monitor |  |
| +5 Volts monitor |  |
| _ROLL_ROT |  |
| _Roll_DEC |  |
| _Roll_RA |  |
| Veto Counter |  |