| Param | Original file | Final file |
|---|---|---|
| Filename | modeM0/AS1A11_046T01_9000004776_33243cztM0_level2.evt | modeM0/AS1A11_046T01_9000004776_33243cztM0_level2_quad_clean.evt |
| Size (bytes) | 111,283,200 | 21,677,760 |
| Size | 106.1 MB | 20.7 MB |
| Events in quadrant A | 974,122 | 135,998 |
| Events in quadrant B | 562,631 | 148,375 |
| Events in quadrant C | 543,201 | 148,080 |
| Events in quadrant D | 1,206,905 | 133,784 |
| Mode SS | |||
|---|---|---|---|
| Quadrant | BADHDUFLAG | Total packets | Discarded packets |
| A | 0 | 26 | 0 |
| B | 0 | 26 | 0 |
| C | 0 | 26 | 0 |
| D | 0 | 26 | 0 |
| Mode M0 | |||
|---|---|---|---|
| Quadrant | BADHDUFLAG | Total packets | Discarded packets |
| A | 0 | 3702 | 2 |
| B | 0 | 2434 | 1 |
| C | 0 | 2462 | 1 |
| D | 0 | 4398 | 1 |
| Mode M9 | |||
|---|---|---|---|
| Quadrant | BADHDUFLAG | Total packets | Discarded packets |
| A | 0 | 15 | 0 |
| B | 0 | 15 | 0 |
| C | 0 | 15 | 0 |
| D | 0 | 15 | 0 |
| Quadrant | Total seconds | Saturated seconds | Saturation percentage |
|---|---|---|---|
| A | 1184 | 196 | 16.554054% |
| B | 1184 | 5 | 0.422297% |
| C | 1184 | 7 | 0.591216% |
| D | 1184 | 131 | 11.064189% |
Noise dominated data is calculated using 1-second bins in cleaned event files. If a bin has >2000 counts, and if more than 50% of those come from <1% of pixels, then it is considered to be noise-dominated and hence unusable.
| Quadrant | # 1 sec bins | Bins with >0 counts | Bins with >2000 counts | High rate bins dominated by noise | Noise dominated (total time) | Noise dominated (detector-on time) | Marked lightcurve |
|---|---|---|---|---|---|---|---|
| A | 2648 | 1185 | 150 | 150 | 5.66% | 12.66% | 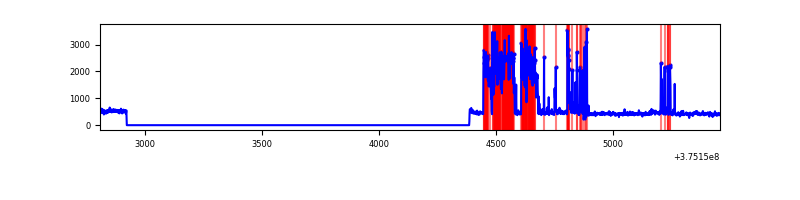 |
| B | 2648 | 1185 | 1 | 1 | 0.04% | 0.08% | 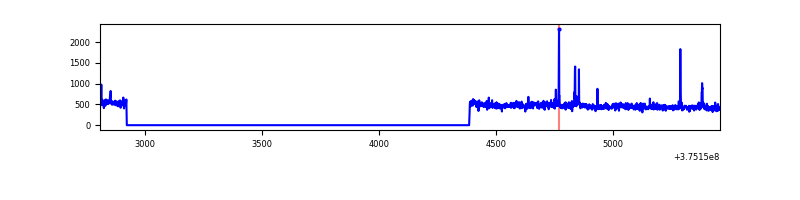 |
| C | 2648 | 1185 | 4 | 4 | 0.15% | 0.34% | 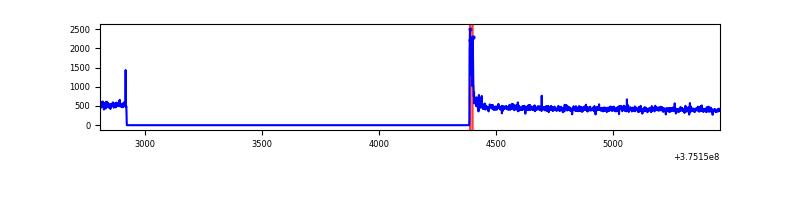 |
| D | 2648 | 1184 | 94 | 94 | 3.55% | 7.94% | 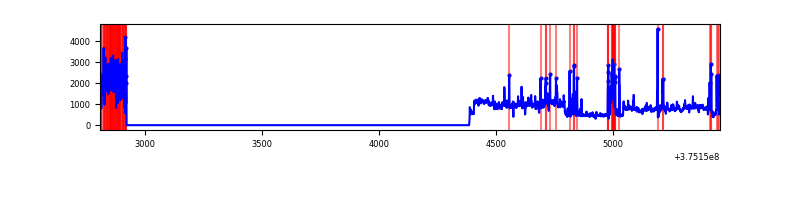 |
Top three noisy pixels from each quadrant. If the there are fewer than three noisy pixels in the level2.evt file, extra rows are filled as -1
| Pixel properties | Quadrant properties | ||||||
|---|---|---|---|---|---|---|---|
| Quadrant | DetID | PixID | Counts | Sigma | Mean | Median | Sigma |
| A | 15 | 169 | 496638 | 18608.63 | 122 | 120 | 26.7 |
| A | 13 | 6 | 2496 | 89.05 | 122 | 120 | 26.7 |
| A | 13 | 254 | 1853 | 64.95 | 122 | 120 | 26.7 |
| B | 5 | 172 | 15147 | 544.76 | 134 | 130 | 27.6 |
| B | 4 | 170 | 4943 | 174.6 | 134 | 130 | 27.6 |
| B | 0 | 183 | 4339 | 152.69 | 134 | 130 | 27.6 |
| C | 0 | 10 | 29244 | 904.71 | 130 | 131 | 32.2 |
| C | 14 | 254 | 3244 | 96.74 | 130 | 131 | 32.2 |
| C | 14 | 67 | 1289 | 35.99 | 130 | 131 | 32.2 |
| D | 8 | 195 | 424170 | 13024.62 | 121 | 117 | 32.6 |
| D | 12 | 3 | 137198 | 4210.39 | 121 | 117 | 32.6 |
| D | 13 | 249 | 105716 | 3243.43 | 121 | 117 | 32.6 |
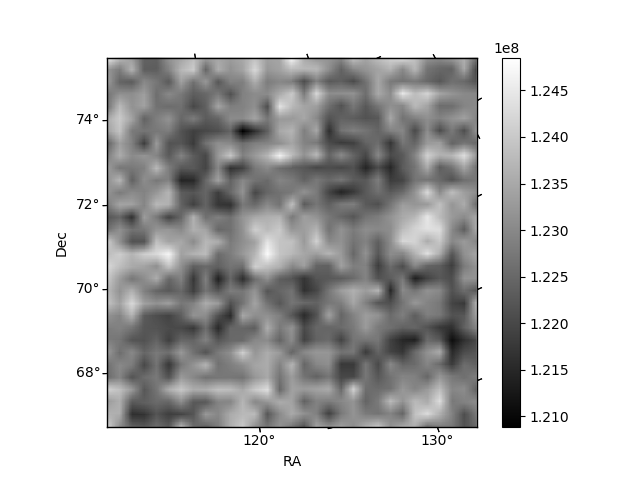
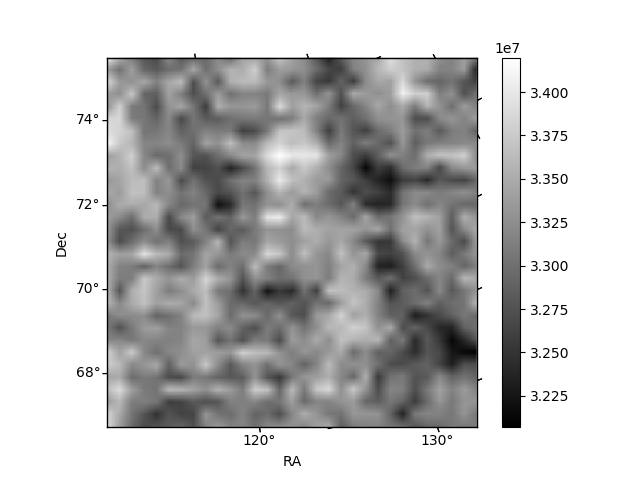
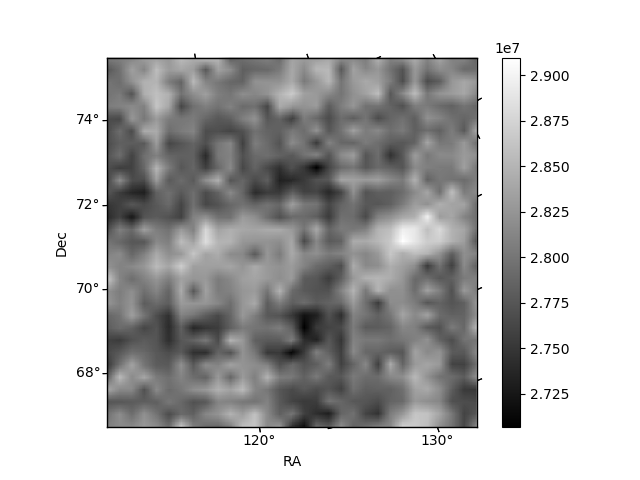
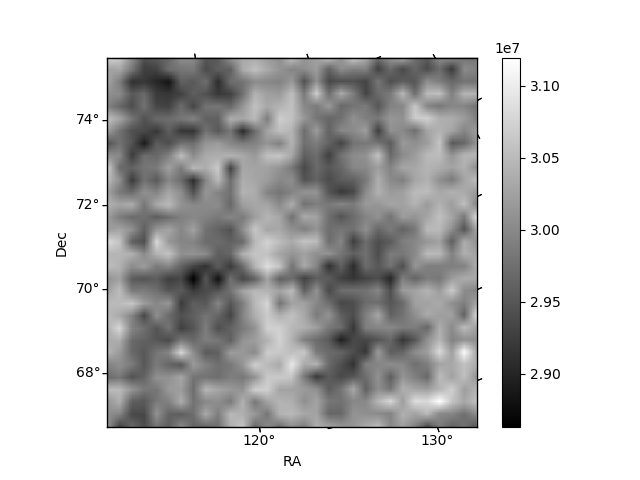
Histogram calculated using DETX and DETY for each event in the final _common_clean file
| Quadrant A | 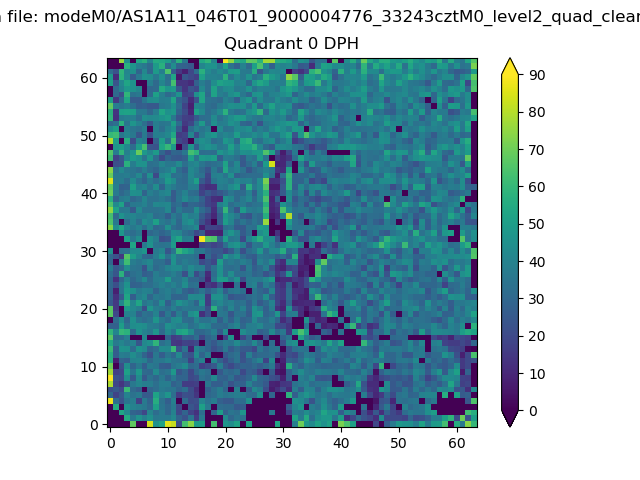 |
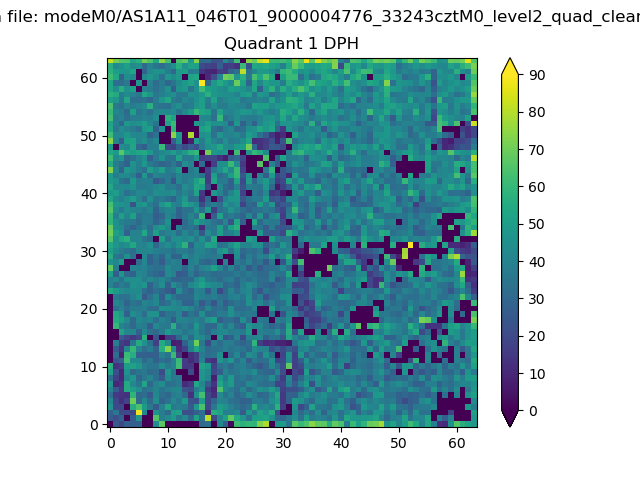 |
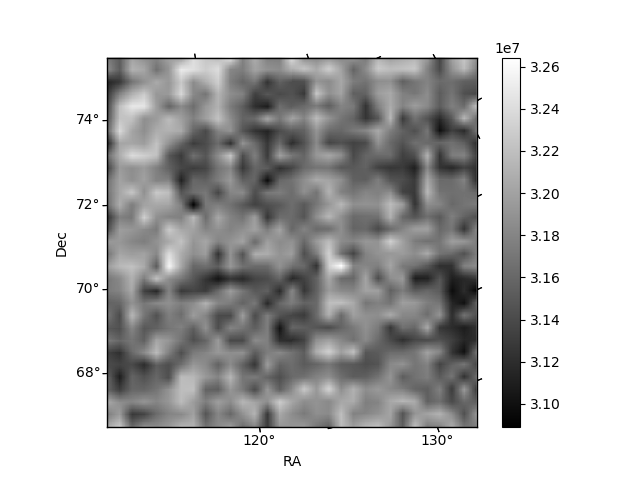
Quadrant B |
|---|---|---|---|
| Quadrant D | 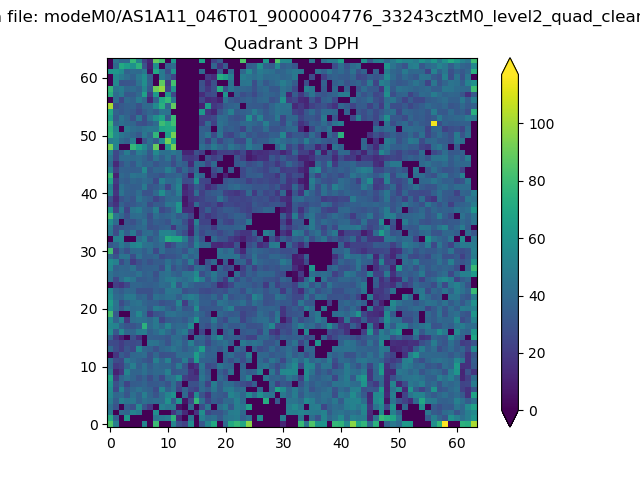 |
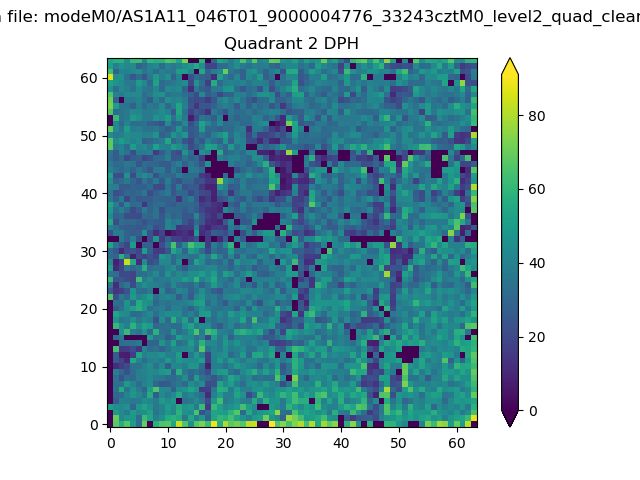 |
Quadrant C |
| Plot type | Count rate plots | Images |
|---|---|---|
| Comparison with Poisson distribution Blue bars denote a histogram of data divided into 1 sec bins. Red curve is a Poisson curve with rate = median count rate of data. |
 |
 |
| Quadrant-wise count rates Data is divided into 100 sec bins |
 |
|
| Module-wise count rates for Quadrant A Data is divided into 100 sec bins |
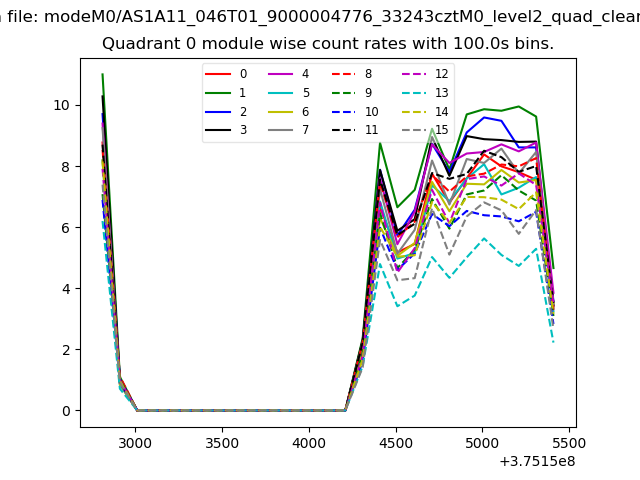 |
 |
| Module-wise count rates for Quadrant B Data is divided into 100 sec bins |
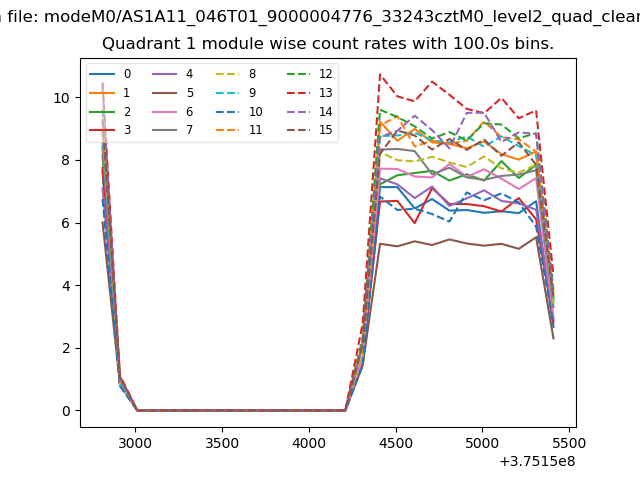 |
 |
| Module-wise count rates for Quadrant C Data is divided into 100 sec bins |
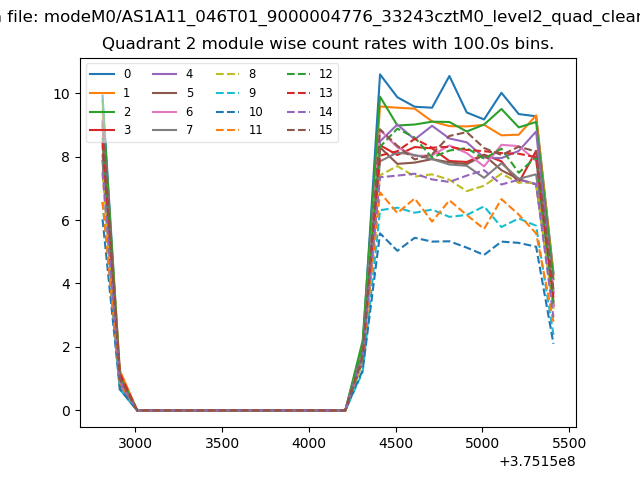 |
 |
| Module-wise count rates for Quadrant D Data is divided into 100 sec bins |
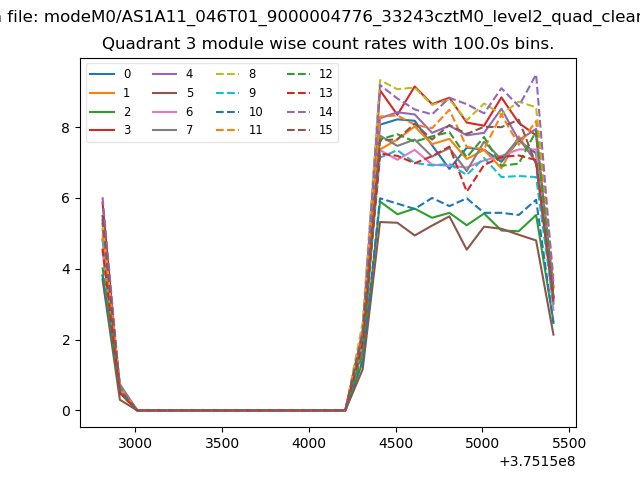 |
 |
| Parameter | Plot |
|---|---|
| CZT HV Monitor | 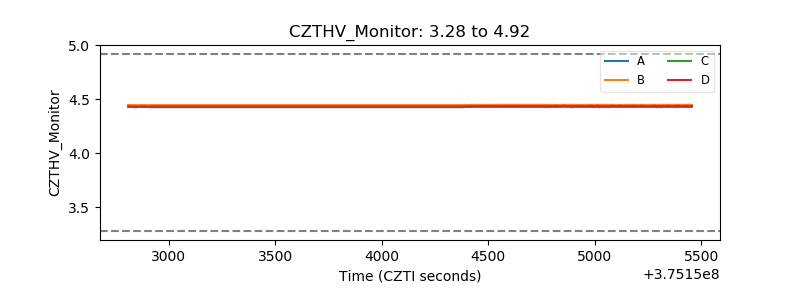 |
| D_VDD | 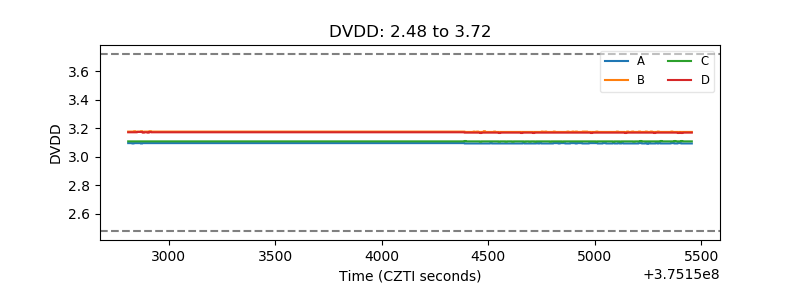 |
| Temperature 1 | 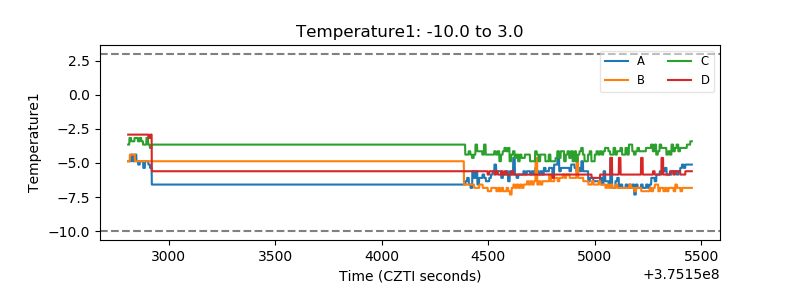 |
| Veto HV Monitor | 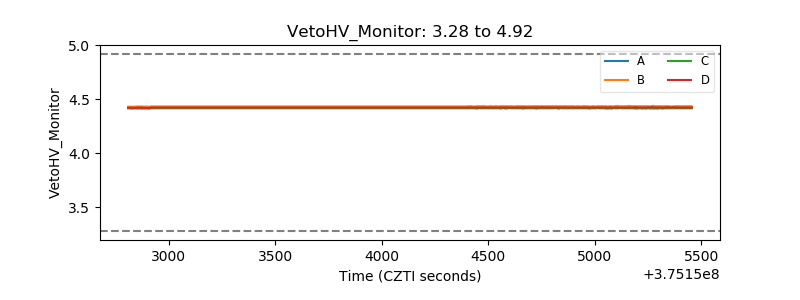 |
| Veto LLD | 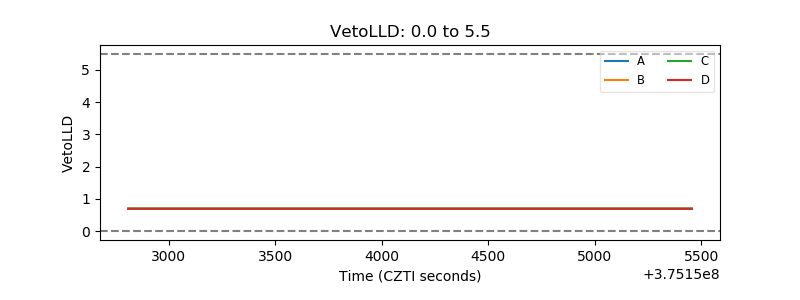 |
| Alpha Counter |  |
| _CPM_Rate |  |
| CZT Counter | 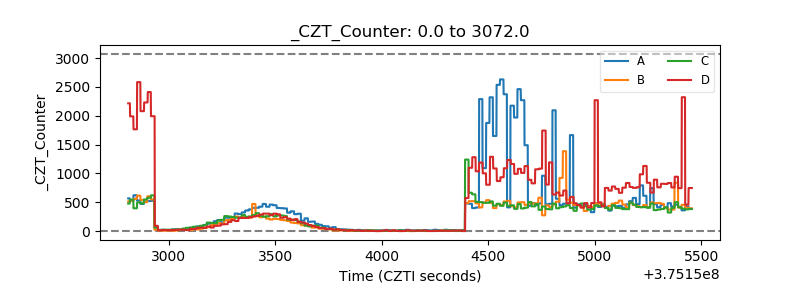 |
| +2.5 Volts monitor |  |
| +5 Volts monitor |  |
| _ROLL_ROT | 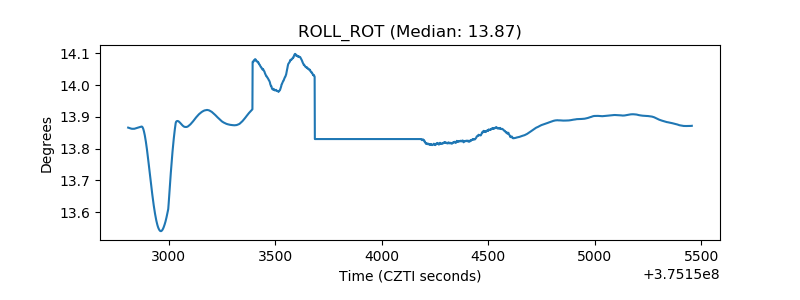 |
| _Roll_DEC | 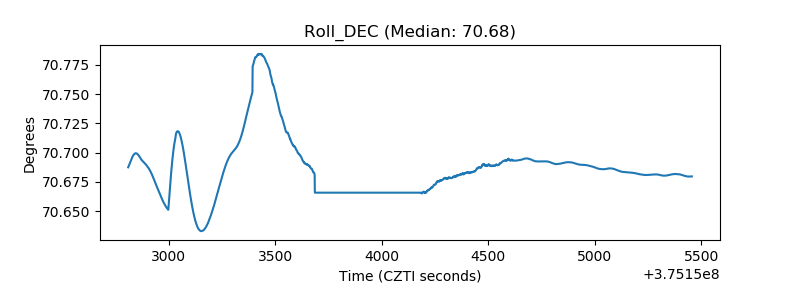 |
| _Roll_RA | 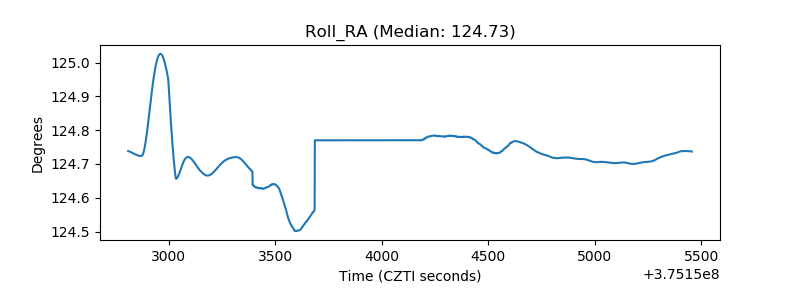 |
| Veto Counter | 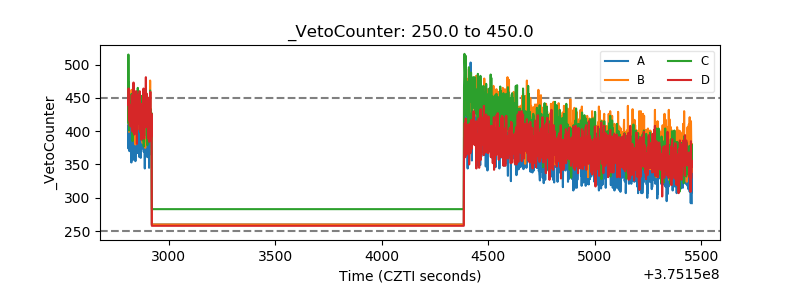 |