| Param | Original file | Final file |
|---|---|---|
| Filename | modeM0/AS1A11_046T01_9000004776_33244cztM0_level2.evt | modeM0/AS1A11_046T01_9000004776_33244cztM0_level2_quad_clean.evt |
| Size (bytes) | 664,073,280 | 102,487,680 |
| Size | 633.3 MB | 97.7 MB |
| Events in quadrant A | 7,237,618 | 593,773 |
| Events in quadrant B | 3,692,200 | 714,368 |
| Events in quadrant C | 2,676,500 | 726,591 |
| Events in quadrant D | 6,111,936 | 661,691 |
| Mode SS | |||
|---|---|---|---|
| Quadrant | BADHDUFLAG | Total packets | Discarded packets |
| A | 0 | 120 | 0 |
| B | 0 | 120 | 0 |
| C | 0 | 120 | 0 |
| D | 0 | 120 | 0 |
| Mode M0 | |||
|---|---|---|---|
| Quadrant | BADHDUFLAG | Total packets | Discarded packets |
| A | 0 | 25677 | 3 |
| B | 0 | 14859 | 2 |
| C | 0 | 12090 | 2 |
| D | 0 | 22310 | 2 |
| Mode M9 | |||
|---|---|---|---|
| Quadrant | BADHDUFLAG | Total packets | Discarded packets |
| A | 0 | 31 | 0 |
| B | 0 | 31 | 0 |
| C | 0 | 31 | 0 |
| D | 0 | 31 | 0 |
| Quadrant | Total seconds | Saturated seconds | Saturation percentage |
|---|---|---|---|
| A | 5814 | 2070 | 35.603715% |
| B | 5814 | 305 | 5.245958% |
| C | 5814 | 23 | 0.395597% |
| D | 5814 | 391 | 6.725146% |
Noise dominated data is calculated using 1-second bins in cleaned event files. If a bin has >2000 counts, and if more than 50% of those come from <1% of pixels, then it is considered to be noise-dominated and hence unusable.
| Quadrant | # 1 sec bins | Bins with >0 counts | Bins with >2000 counts | High rate bins dominated by noise | Noise dominated (total time) | Noise dominated (detector-on time) | Marked lightcurve |
|---|---|---|---|---|---|---|---|
| A | 8861 | 5816 | 1501 | 1501 | 16.94% | 25.81% | 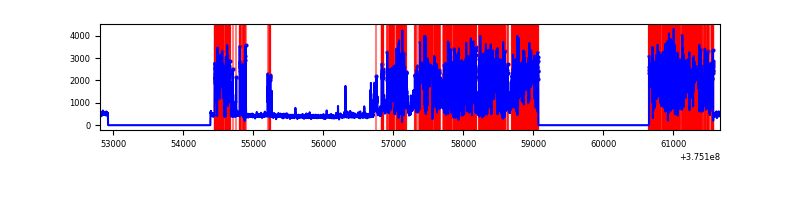 |
| B | 8861 | 5815 | 191 | 191 | 2.16% | 3.28% | 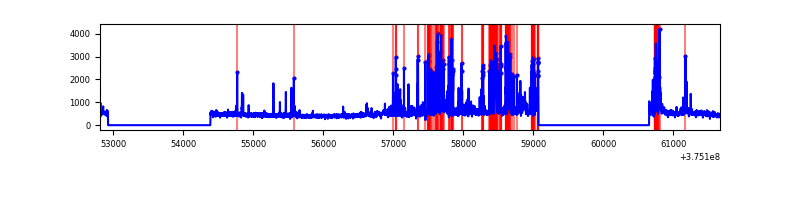 |
| C | 8861 | 5816 | 13 | 13 | 0.15% | 0.22% | 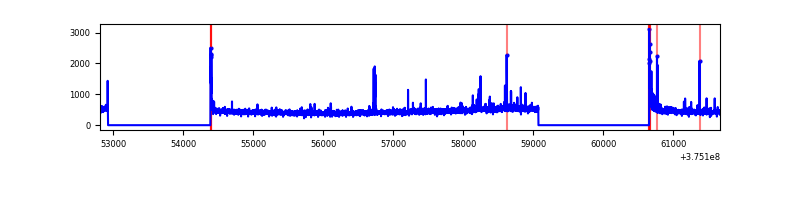 |
| D | 8861 | 5815 | 327 | 327 | 3.69% | 5.62% | 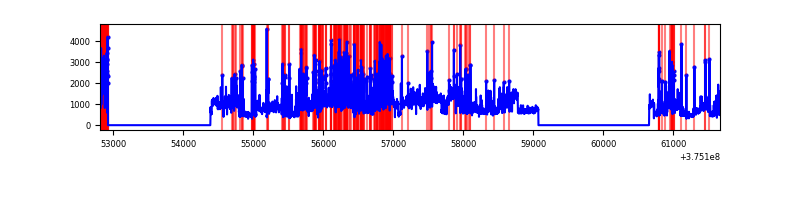 |
Top three noisy pixels from each quadrant. If the there are fewer than three noisy pixels in the level2.evt file, extra rows are filled as -1
| Pixel properties | Quadrant properties | ||||||
|---|---|---|---|---|---|---|---|
| Quadrant | DetID | PixID | Counts | Sigma | Mean | Median | Sigma |
| A | 15 | 169 | 5080868 | 45950.2 | 554 | 545 | 110.6 |
| A | 13 | 6 | 12202 | 105.43 | 554 | 545 | 110.6 |
| A | 13 | 254 | 8163 | 68.9 | 554 | 545 | 110.6 |
| B | 5 | 172 | 796858 | 6527.79 | 646 | 629 | 122.0 |
| B | 4 | 170 | 213870 | 1748.23 | 646 | 629 | 122.0 |
| B | 15 | 85 | 26557 | 212.57 | 646 | 629 | 122.0 |
| C | 0 | 10 | 70450 | 473.15 | 642 | 646 | 147.5 |
| C | 14 | 254 | 54012 | 361.73 | 642 | 646 | 147.5 |
| C | 15 | 208 | 12371 | 79.47 | 642 | 646 | 147.5 |
| D | 8 | 195 | 2135941 | 13844.78 | 627 | 609 | 154.2 |
| D | 12 | 218 | 558709 | 3618.53 | 627 | 609 | 154.2 |
| D | 12 | 3 | 279355 | 1807.3 | 627 | 609 | 154.2 |
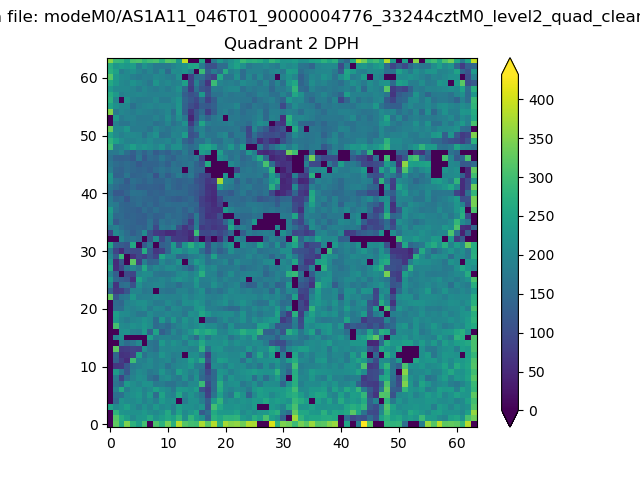
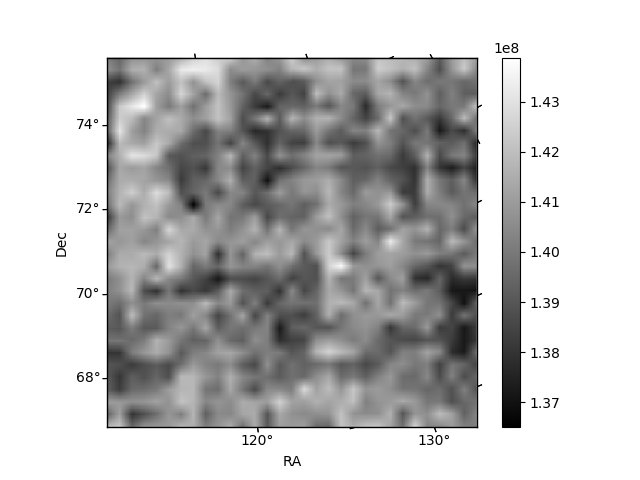
Histogram calculated using DETX and DETY for each event in the final _common_clean file
| Quadrant A | 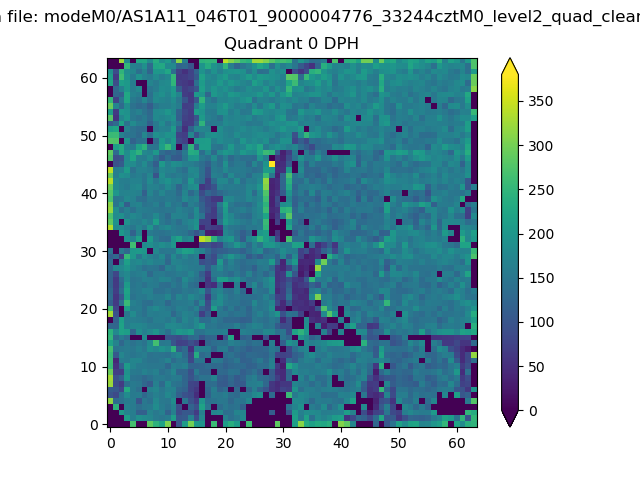 |
 |
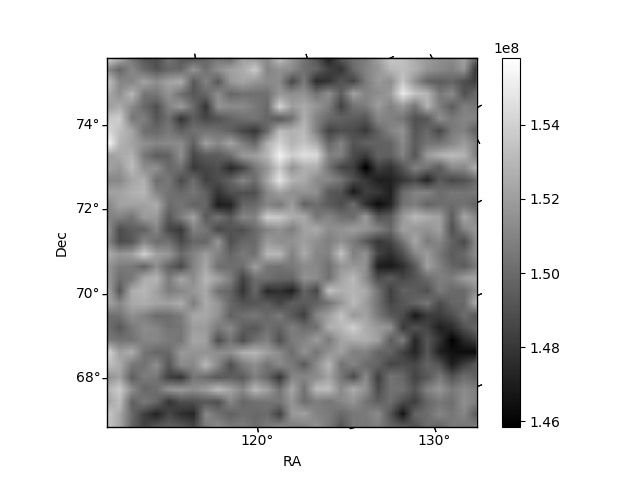
Quadrant B |
|---|---|---|---|
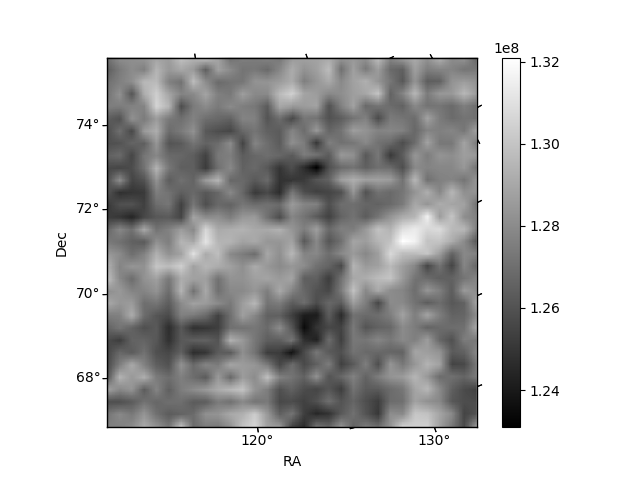
| Quadrant D |  |
 |
Quadrant C |
| Plot type | Count rate plots | Images |
|---|---|---|
| Comparison with Poisson distribution Blue bars denote a histogram of data divided into 1 sec bins. Red curve is a Poisson curve with rate = median count rate of data. |
 |
 |
| Quadrant-wise count rates Data is divided into 100 sec bins |
 |
|
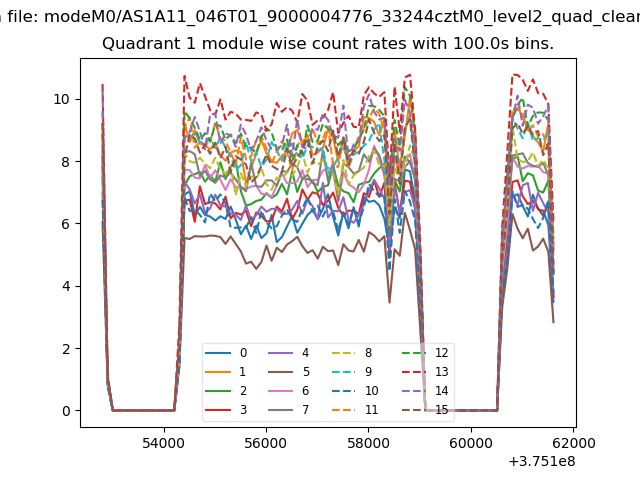
| Module-wise count rates for Quadrant A Data is divided into 100 sec bins |
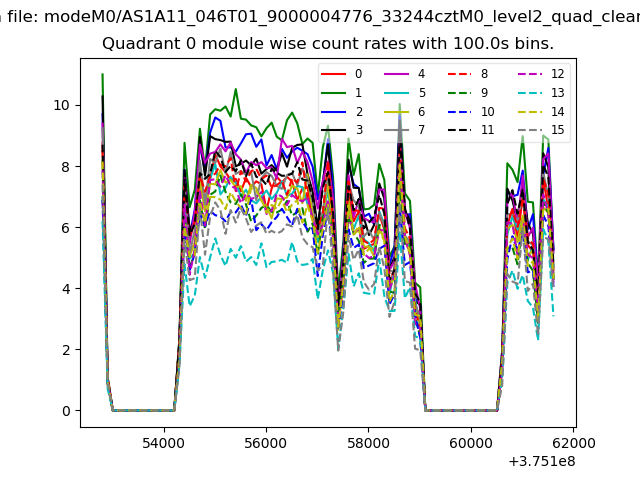 |
 |
| Module-wise count rates for Quadrant B Data is divided into 100 sec bins |
 |
 |
| Module-wise count rates for Quadrant C Data is divided into 100 sec bins |
 |
 |
| Module-wise count rates for Quadrant D Data is divided into 100 sec bins |
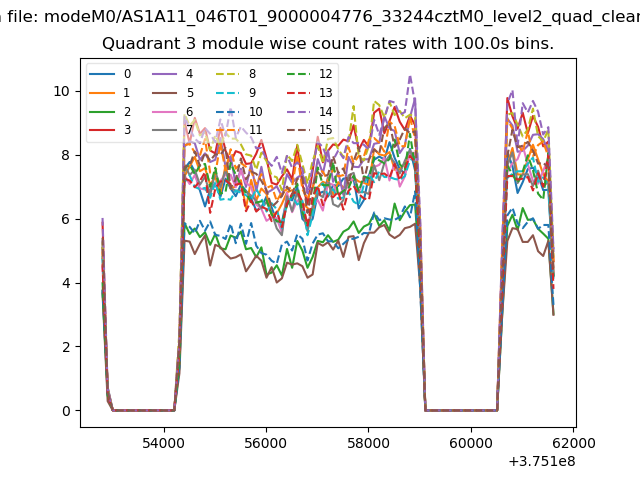 |
 |
| Parameter | Plot |
|---|---|
| CZT HV Monitor | 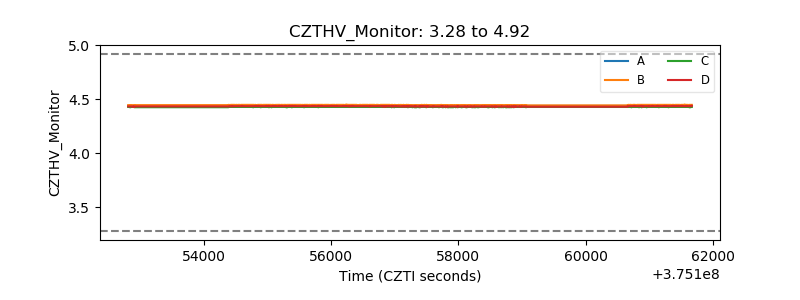 |
| D_VDD | 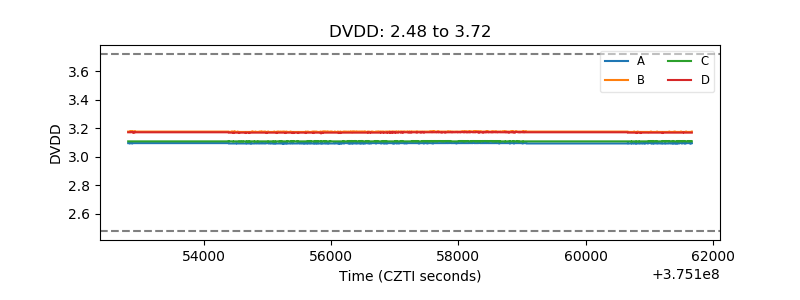 |
| Temperature 1 | 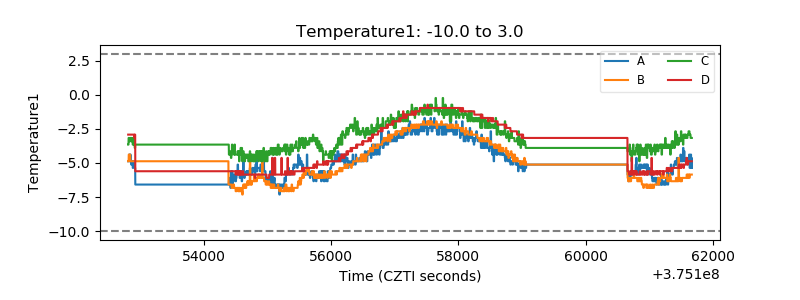 |
| Veto HV Monitor | 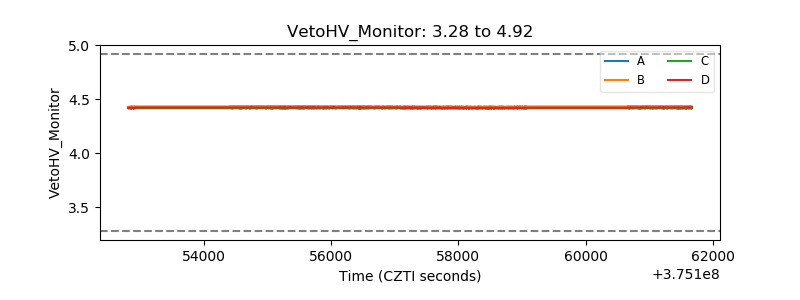 |
| Veto LLD | 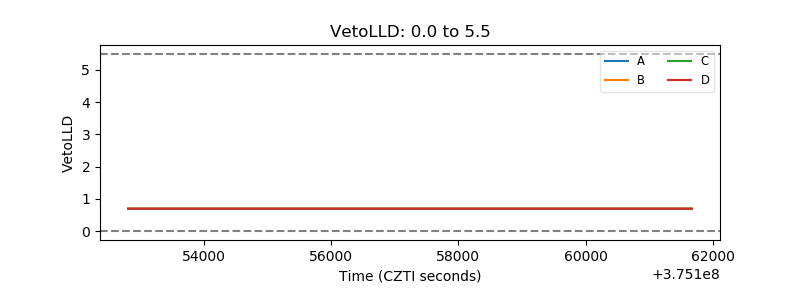 |
| Alpha Counter |  |
| _CPM_Rate | 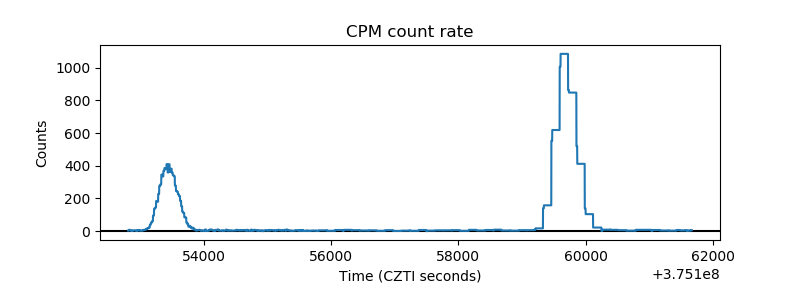 |
| CZT Counter |  |
| +2.5 Volts monitor |  |
| +5 Volts monitor |  |
| _ROLL_ROT | 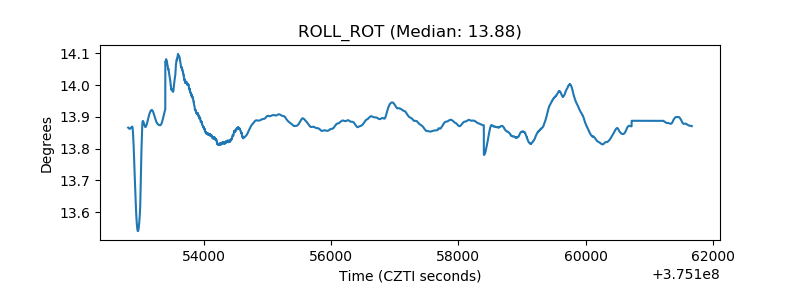 |
| _Roll_DEC | 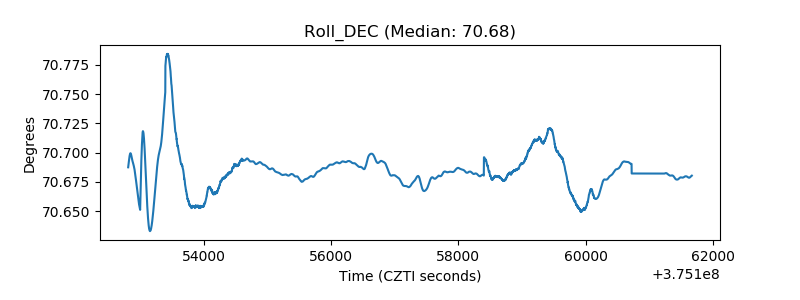 |
| _Roll_RA | 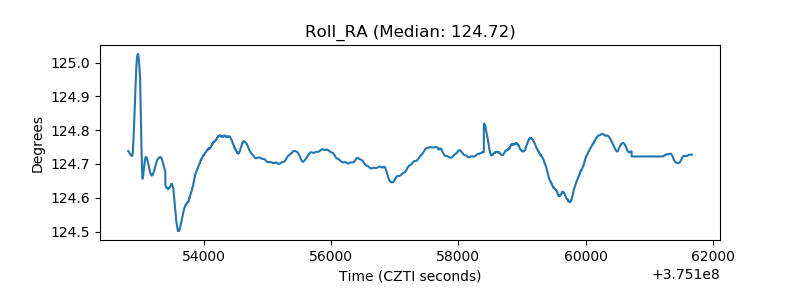 |
| Veto Counter | 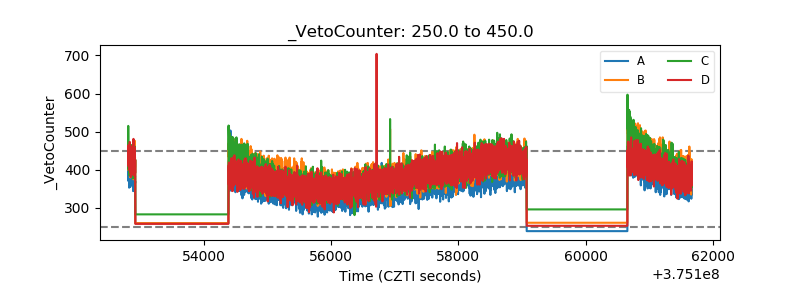 |