| Param | Original file | Final file |
|---|---|---|
| Filename | modeM0/AS1A11_046T01_9000004776_33245cztM0_level2.evt | modeM0/AS1A11_046T01_9000004776_33245cztM0_level2_quad_clean.evt |
| Size (bytes) | 706,547,520 | 97,986,240 |
| Size | 673.8 MB | 93.4 MB |
| Events in quadrant A | 8,743,306 | 566,132 |
| Events in quadrant B | 4,242,774 | 683,891 |
| Events in quadrant C | 2,636,395 | 699,317 |
| Events in quadrant D | 5,405,243 | 633,221 |
| Mode SS | |||
|---|---|---|---|
| Quadrant | BADHDUFLAG | Total packets | Discarded packets |
| A | 0 | 112 | 0 |
| B | 0 | 112 | 0 |
| C | 0 | 112 | 0 |
| D | 0 | 112 | 0 |
| Mode M0 | |||
|---|---|---|---|
| Quadrant | BADHDUFLAG | Total packets | Discarded packets |
| A | 0 | 29719 | 3 |
| B | 0 | 16132 | 2 |
| C | 0 | 11523 | 2 |
| D | 0 | 19910 | 2 |
| Mode M9 | |||
|---|---|---|---|
| Quadrant | BADHDUFLAG | Total packets | Discarded packets |
| A | 0 | 19 | 0 |
| B | 0 | 19 | 0 |
| C | 0 | 19 | 0 |
| D | 0 | 20 | 0 |
| Quadrant | Total seconds | Saturated seconds | Saturation percentage |
|---|---|---|---|
| A | 5473 | 2707 | 49.460990% |
| B | 5473 | 523 | 9.556002% |
| C | 5473 | 38 | 0.694318% |
| D | 5473 | 535 | 9.775260% |
Noise dominated data is calculated using 1-second bins in cleaned event files. If a bin has >2000 counts, and if more than 50% of those come from <1% of pixels, then it is considered to be noise-dominated and hence unusable.
| Quadrant | # 1 sec bins | Bins with >0 counts | Bins with >2000 counts | High rate bins dominated by noise | Noise dominated (total time) | Noise dominated (detector-on time) | Marked lightcurve |
|---|---|---|---|---|---|---|---|
| A | 7176 | 5474 | 2224 | 2224 | 30.99% | 40.63% | 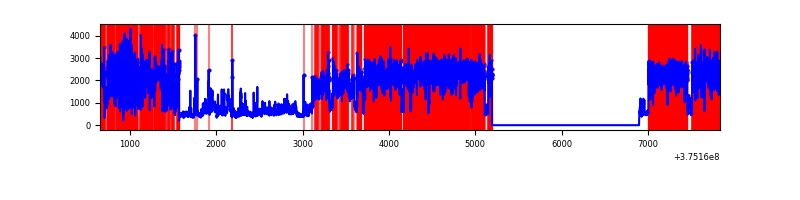 |
| B | 7176 | 5474 | 365 | 365 | 5.09% | 6.67% | 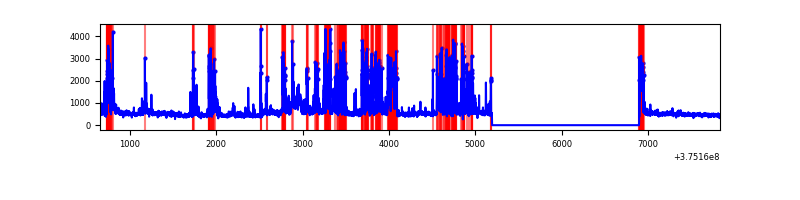 |
| C | 7176 | 5474 | 29 | 29 | 0.40% | 0.53% | 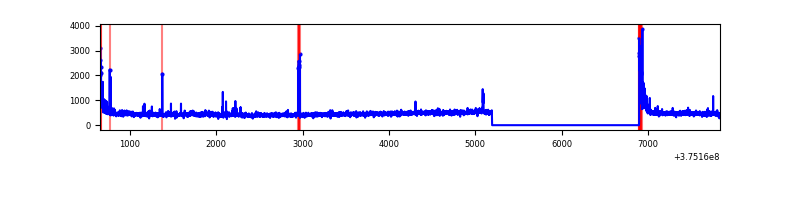 |
| D | 7176 | 5474 | 412 | 412 | 5.74% | 7.53% | 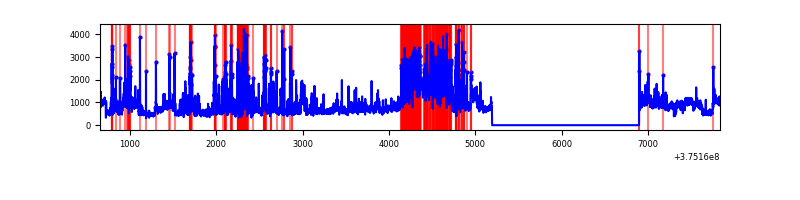 |
Top three noisy pixels from each quadrant. If the there are fewer than three noisy pixels in the level2.evt file, extra rows are filled as -1
| Pixel properties | Quadrant properties | ||||||
|---|---|---|---|---|---|---|---|
| Quadrant | DetID | PixID | Counts | Sigma | Mean | Median | Sigma |
| A | 15 | 169 | 6674019 | 62983.88 | 530 | 520 | 106.0 |
| A | 13 | 6 | 12567 | 113.7 | 530 | 520 | 106.0 |
| A | 13 | 254 | 7855 | 69.23 | 530 | 520 | 106.0 |
| B | 5 | 172 | 1348507 | 11657.81 | 610 | 596 | 115.6 |
| B | 4 | 170 | 308835 | 2665.9 | 610 | 596 | 115.6 |
| B | 15 | 85 | 46651 | 398.32 | 610 | 596 | 115.6 |
| C | 0 | 10 | 139478 | 996.16 | 608 | 611 | 139.4 |
| C | 3 | 233 | 42127 | 297.81 | 608 | 611 | 139.4 |
| C | 14 | 254 | 22029 | 153.64 | 608 | 611 | 139.4 |
| D | 8 | 195 | 1620313 | 11260.0 | 589 | 572 | 143.8 |
| D | 12 | 3 | 580706 | 4032.93 | 589 | 572 | 143.8 |
| D | 12 | 218 | 358703 | 2489.63 | 589 | 572 | 143.8 |
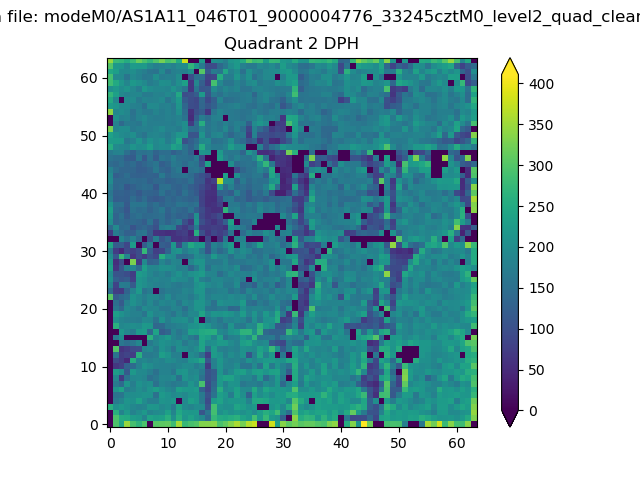
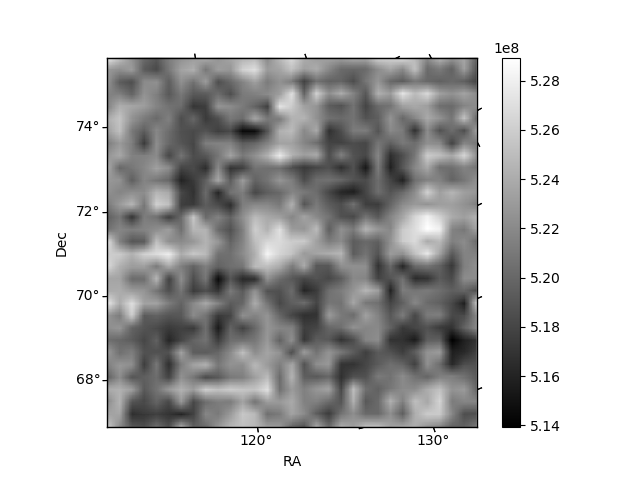
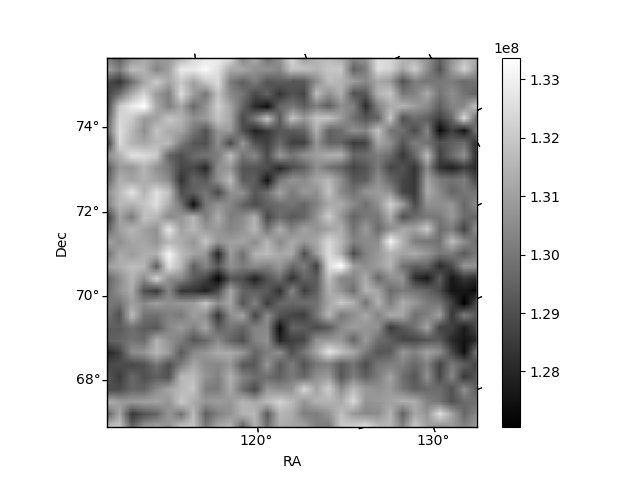
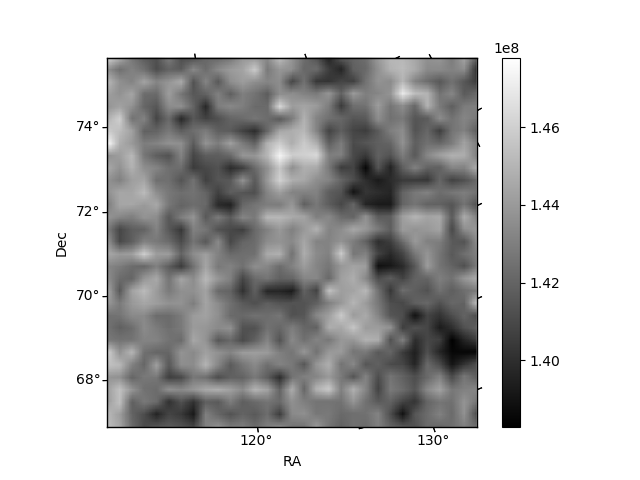
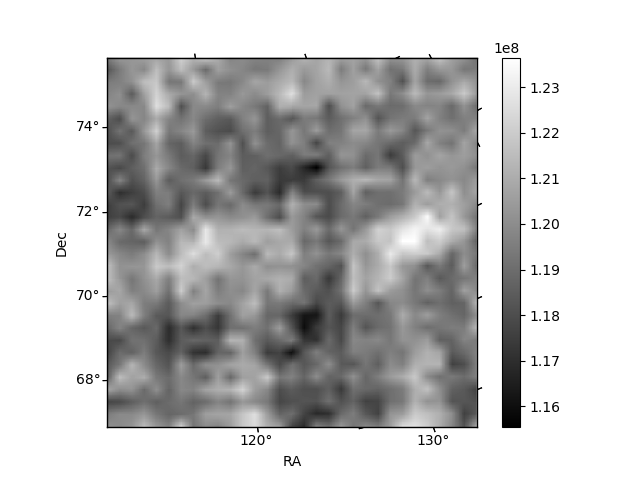
Histogram calculated using DETX and DETY for each event in the final _common_clean file
| Quadrant A | 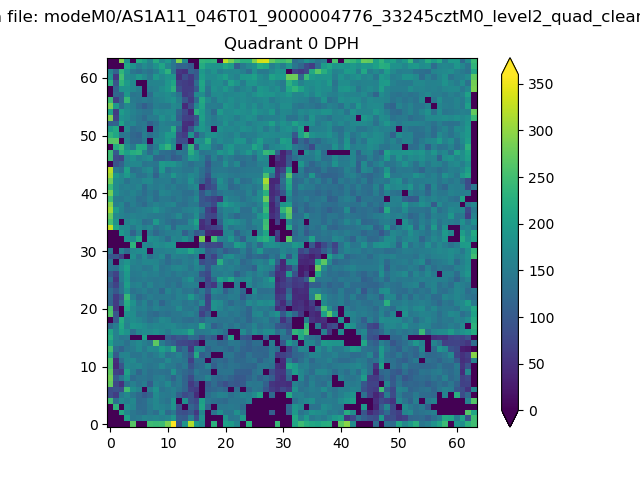 |
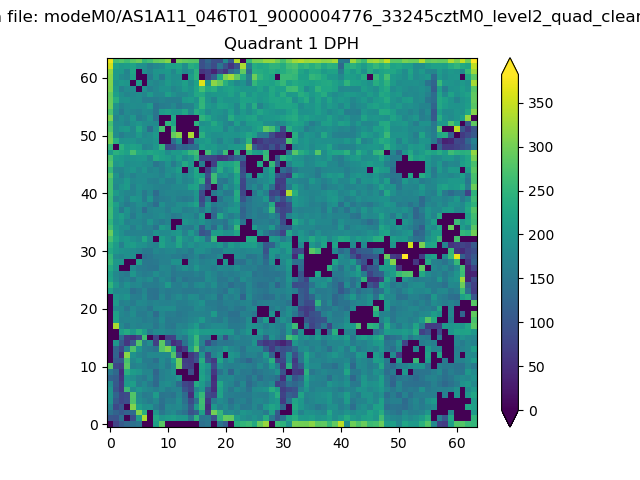 |
Quadrant B |
|---|---|---|---|
| Quadrant D | 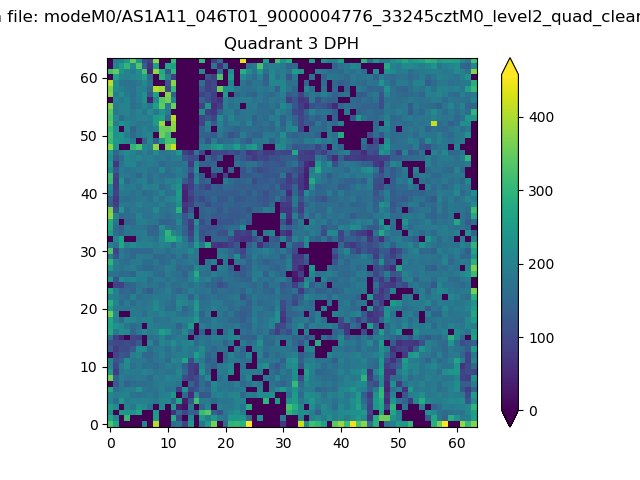 |
 |
Quadrant C |
| Plot type | Count rate plots | Images |
|---|---|---|
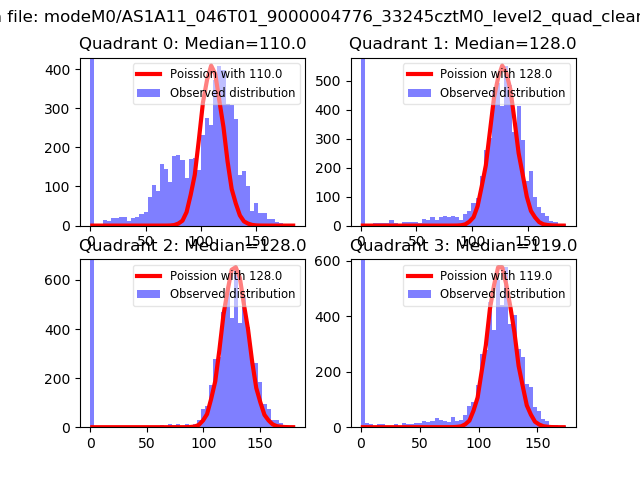
| Comparison with Poisson distribution Blue bars denote a histogram of data divided into 1 sec bins. Red curve is a Poisson curve with rate = median count rate of data. |
 |
 |
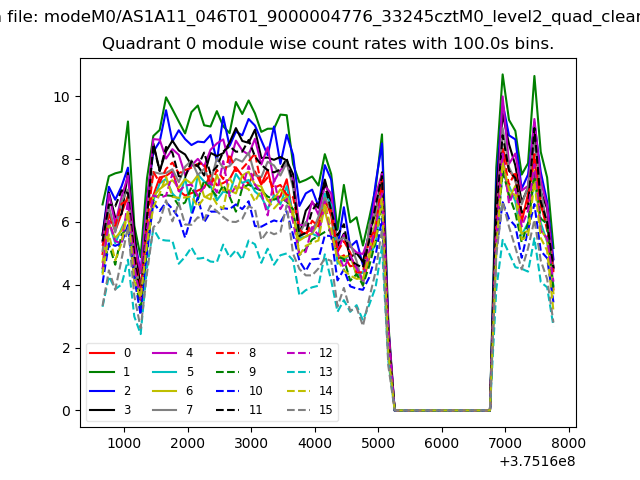
| Quadrant-wise count rates Data is divided into 100 sec bins |
 |
|
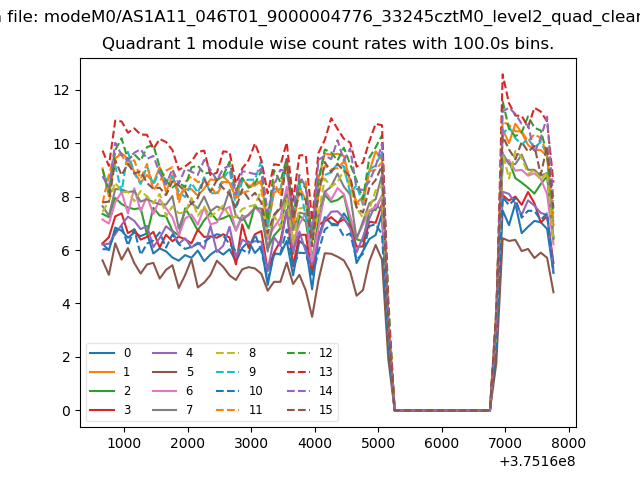
| Module-wise count rates for Quadrant A Data is divided into 100 sec bins |
 |
 |
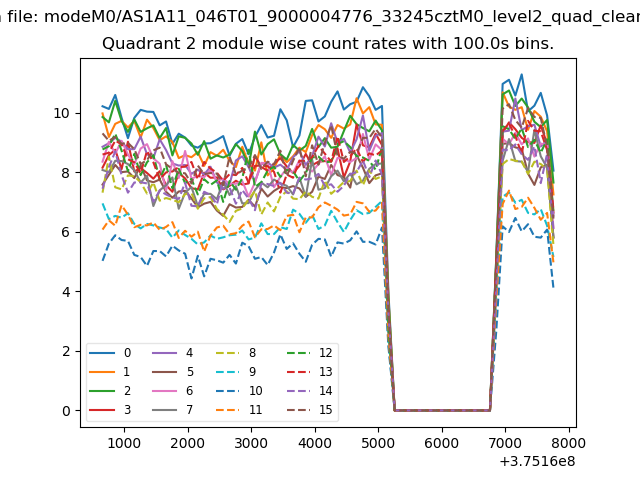
| Module-wise count rates for Quadrant B Data is divided into 100 sec bins |
 |
 |
| Module-wise count rates for Quadrant C Data is divided into 100 sec bins |
 |
 |
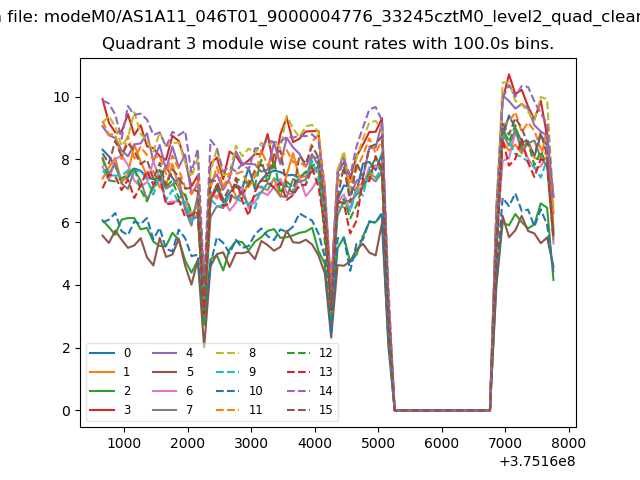
| Module-wise count rates for Quadrant D Data is divided into 100 sec bins |
 |
 |
| Parameter | Plot |
|---|---|
| CZT HV Monitor | 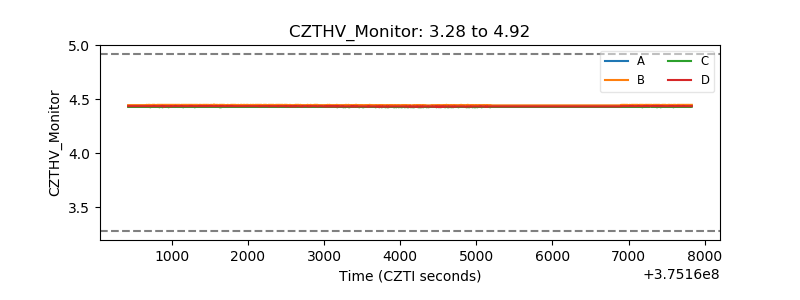 |
| D_VDD | 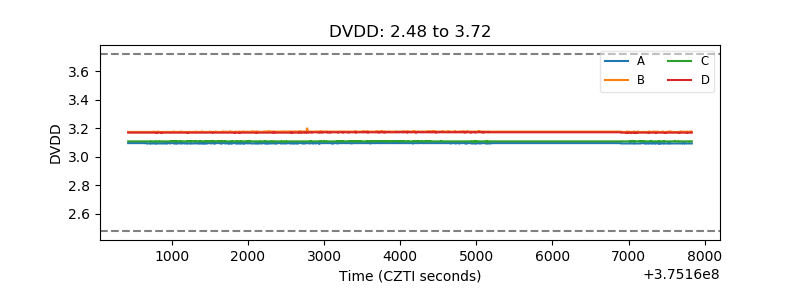 |
| Temperature 1 | 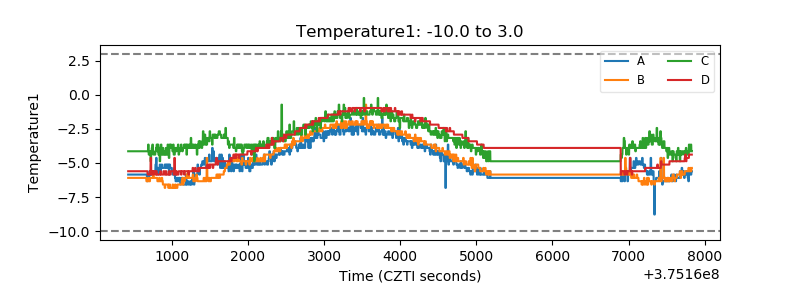 |
| Veto HV Monitor | 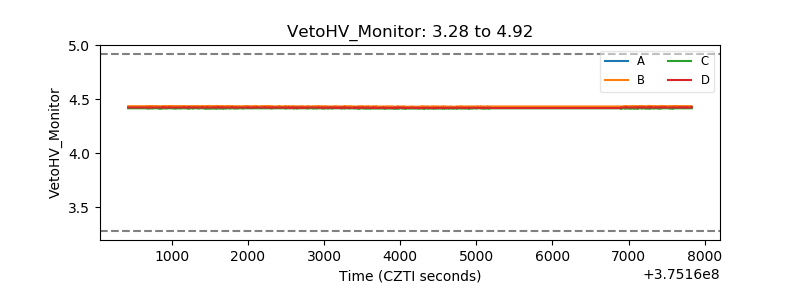 |
| Veto LLD | 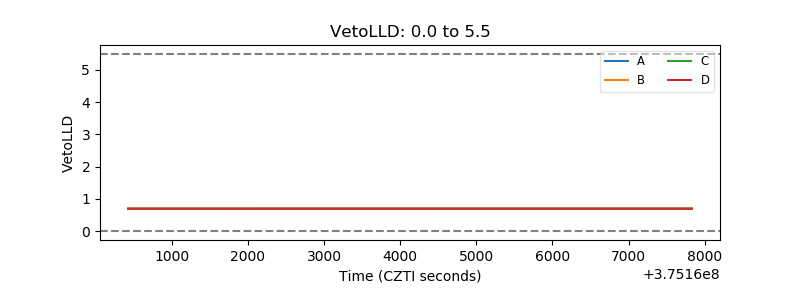 |
| Alpha Counter |  |
| _CPM_Rate | 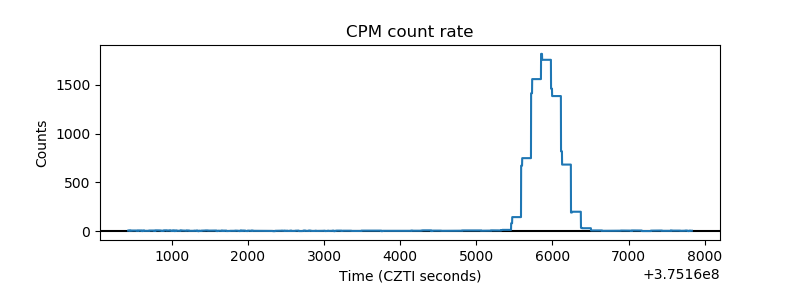 |
| CZT Counter | 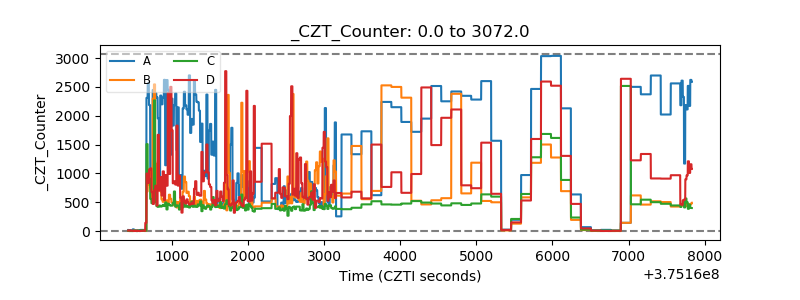 |
| +2.5 Volts monitor |  |
| +5 Volts monitor |  |
| _ROLL_ROT | 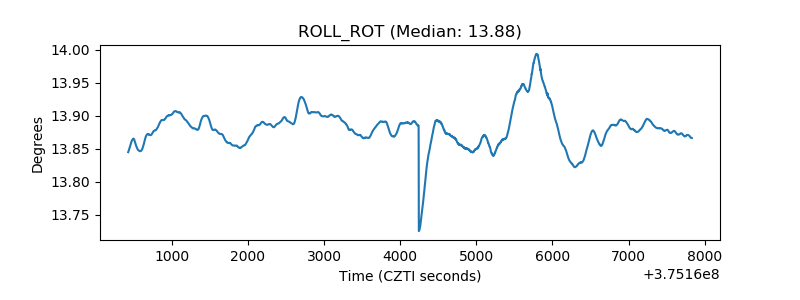 |
| _Roll_DEC | 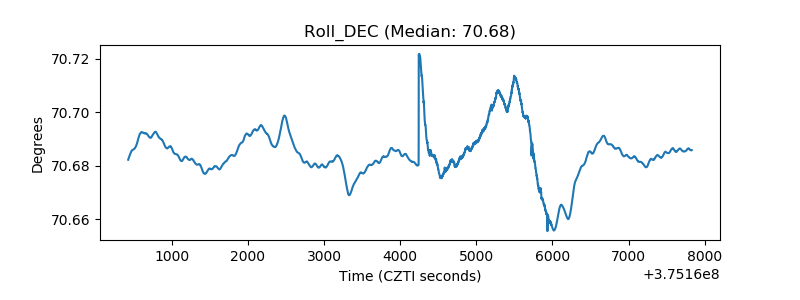 |
| _Roll_RA | 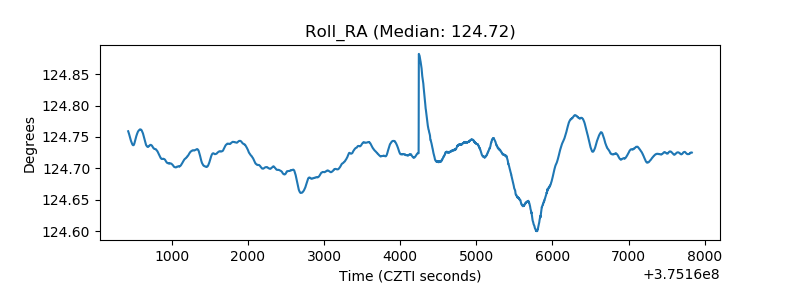 |
| Veto Counter | 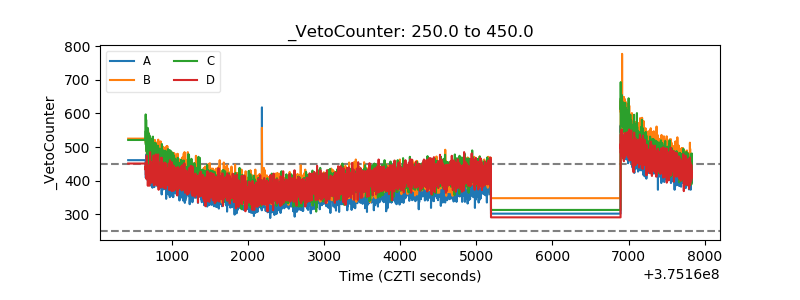 |