| Param | Original file | Final file |
|---|---|---|
| Filename | modeM0/AS1A11_046T01_9000004776_33248cztM0_level2.evt | modeM0/AS1A11_046T01_9000004776_33248cztM0_level2_quad_clean.evt |
| Size (bytes) | 601,741,440 | 107,743,680 |
| Size | 573.9 MB | 102.8 MB |
| Events in quadrant A | 6,325,627 | 719,702 |
| Events in quadrant B | 3,631,955 | 755,495 |
| Events in quadrant C | 2,670,249 | 736,377 |
| Events in quadrant D | 5,247,243 | 689,137 |
| Mode SS | |||
|---|---|---|---|
| Quadrant | BADHDUFLAG | Total packets | Discarded packets |
| A | 0 | 104 | 0 |
| B | 0 | 104 | 0 |
| C | 0 | 104 | 0 |
| D | 0 | 104 | 0 |
| Mode M0 | |||
|---|---|---|---|
| Quadrant | BADHDUFLAG | Total packets | Discarded packets |
| A | 0 | 22416 | 3 |
| B | 0 | 13951 | 2 |
| C | 0 | 11028 | 2 |
| D | 0 | 19381 | 2 |
| Mode M9 | |||
|---|---|---|---|
| Quadrant | BADHDUFLAG | Total packets | Discarded packets |
| A | 0 | 22 | 0 |
| B | 0 | 22 | 0 |
| C | 0 | 22 | 0 |
| D | 0 | 23 | 0 |
| Quadrant | Total seconds | Saturated seconds | Saturation percentage |
|---|---|---|---|
| A | 5172 | 900 | 17.401392% |
| B | 5172 | 216 | 4.176334% |
| C | 5172 | 39 | 0.754060% |
| D | 5172 | 285 | 5.510441% |
Noise dominated data is calculated using 1-second bins in cleaned event files. If a bin has >2000 counts, and if more than 50% of those come from <1% of pixels, then it is considered to be noise-dominated and hence unusable.
| Quadrant | # 1 sec bins | Bins with >0 counts | Bins with >2000 counts | High rate bins dominated by noise | Noise dominated (total time) | Noise dominated (detector-on time) | Marked lightcurve |
|---|---|---|---|---|---|---|---|
| A | 7115 | 5173 | 700 | 700 | 9.84% | 13.53% | 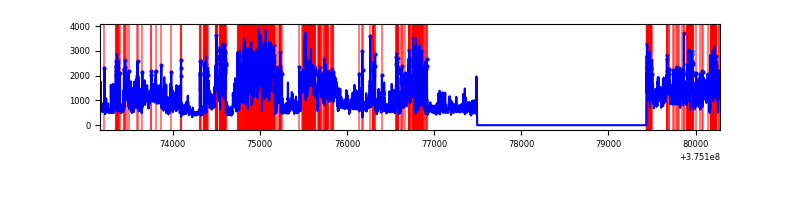 |
| B | 7115 | 5173 | 157 | 157 | 2.21% | 3.03% | 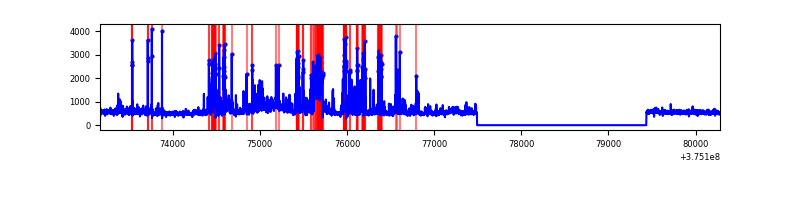 |
| C | 7115 | 5173 | 28 | 28 | 0.39% | 0.54% | 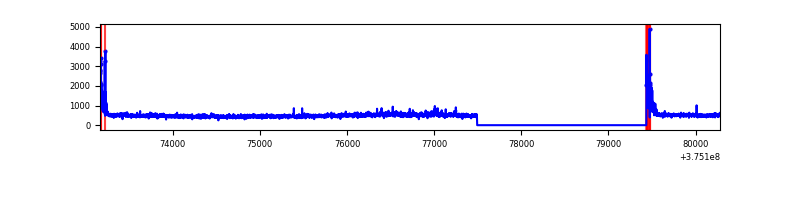 |
| D | 7115 | 5173 | 249 | 249 | 3.50% | 4.81% | 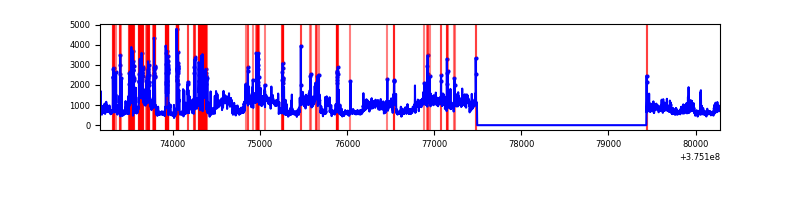 |
Top three noisy pixels from each quadrant. If the there are fewer than three noisy pixels in the level2.evt file, extra rows are filled as -1
| Pixel properties | Quadrant properties | ||||||
|---|---|---|---|---|---|---|---|
| Quadrant | DetID | PixID | Counts | Sigma | Mean | Median | Sigma |
| A | 15 | 169 | 3885924 | 31653.71 | 627 | 618 | 122.7 |
| A | 13 | 6 | 11376 | 87.65 | 627 | 618 | 122.7 |
| A | 13 | 254 | 8780 | 66.5 | 627 | 618 | 122.7 |
| B | 5 | 172 | 567489 | 4792.7 | 632 | 618 | 118.3 |
| B | 0 | 219 | 146537 | 1233.7 | 632 | 618 | 118.3 |
| B | 4 | 170 | 140327 | 1181.19 | 632 | 618 | 118.3 |
| C | 0 | 10 | 150225 | 1064.74 | 615 | 621 | 140.5 |
| C | 10 | 49 | 79623 | 562.26 | 615 | 621 | 140.5 |
| C | 3 | 233 | 16661 | 114.16 | 615 | 621 | 140.5 |
| D | 8 | 195 | 1828385 | 11940.13 | 621 | 606 | 153.1 |
| D | 12 | 3 | 474934 | 3098.59 | 621 | 606 | 153.1 |
| D | 13 | 249 | 118982 | 773.3 | 621 | 606 | 153.1 |
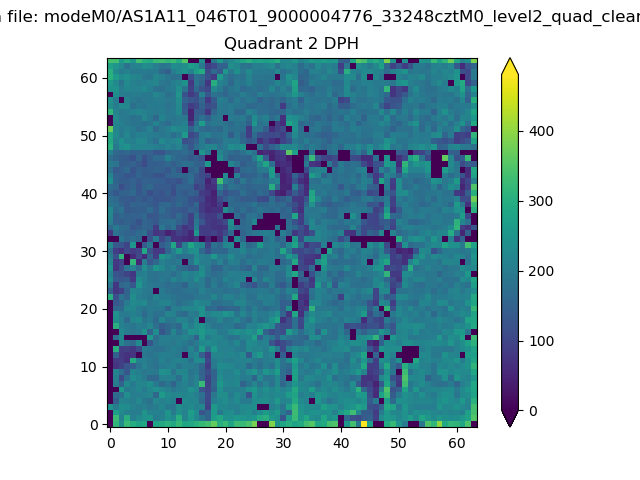
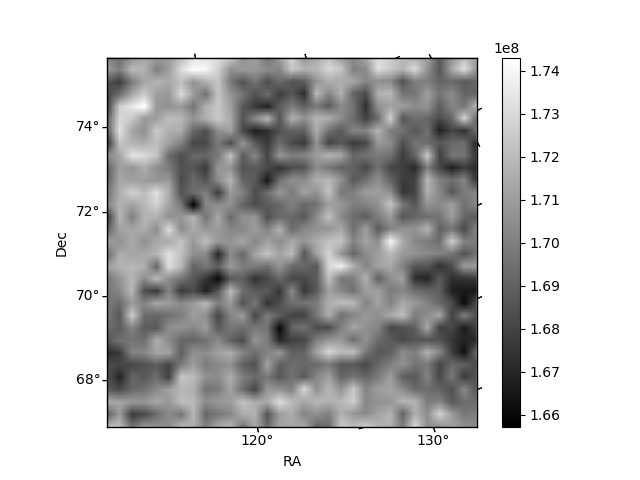
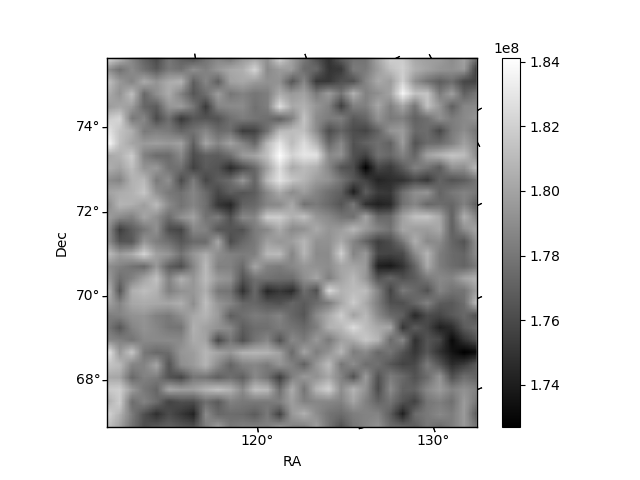
Histogram calculated using DETX and DETY for each event in the final _common_clean file
| Quadrant A |  |
 |
Quadrant B |
|---|---|---|---|
| Quadrant D |  |
 |
Quadrant C |
| Plot type | Count rate plots | Images |
|---|---|---|
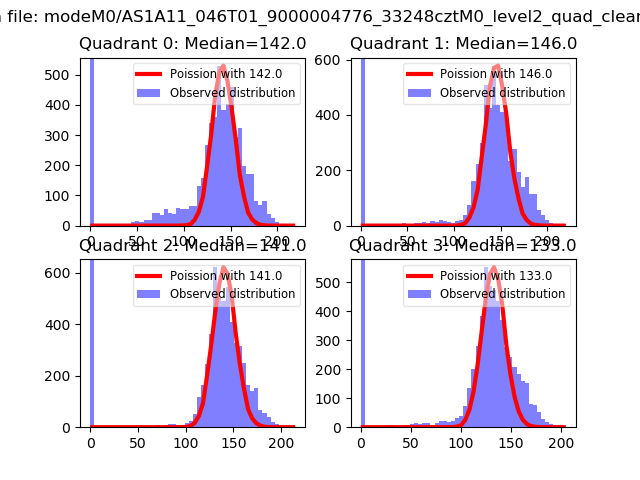
| Comparison with Poisson distribution Blue bars denote a histogram of data divided into 1 sec bins. Red curve is a Poisson curve with rate = median count rate of data. |
 |
 |
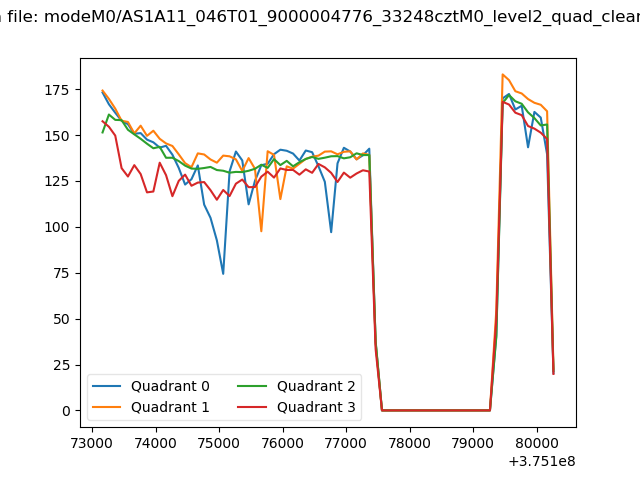
| Quadrant-wise count rates Data is divided into 100 sec bins |
 |
|
| Module-wise count rates for Quadrant A Data is divided into 100 sec bins |
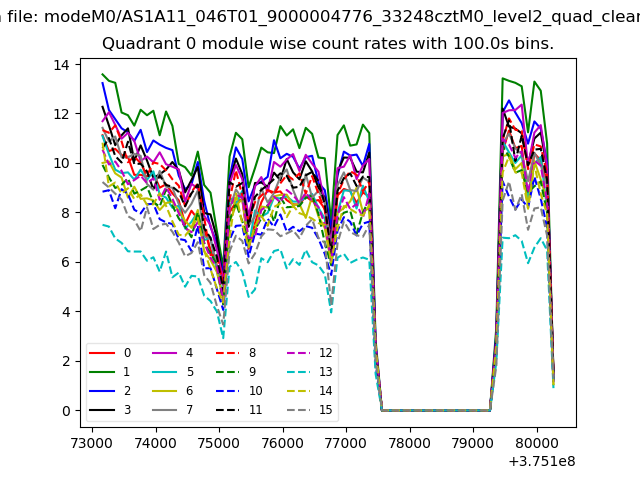 |
 |
| Module-wise count rates for Quadrant B Data is divided into 100 sec bins |
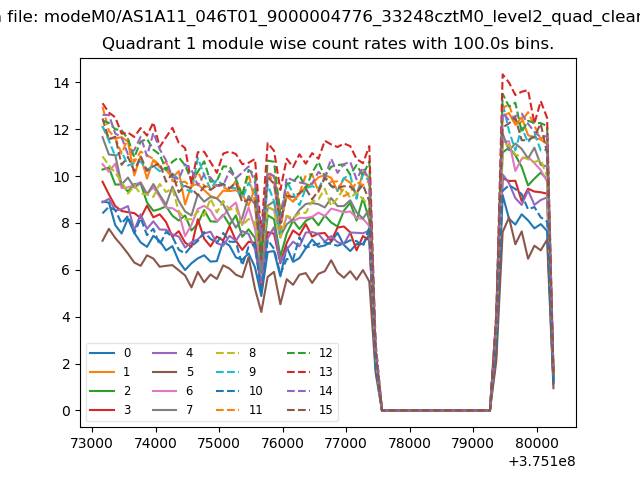 |
 |
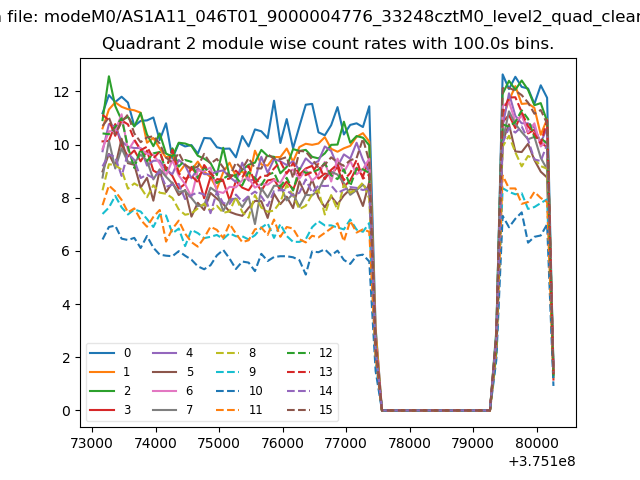
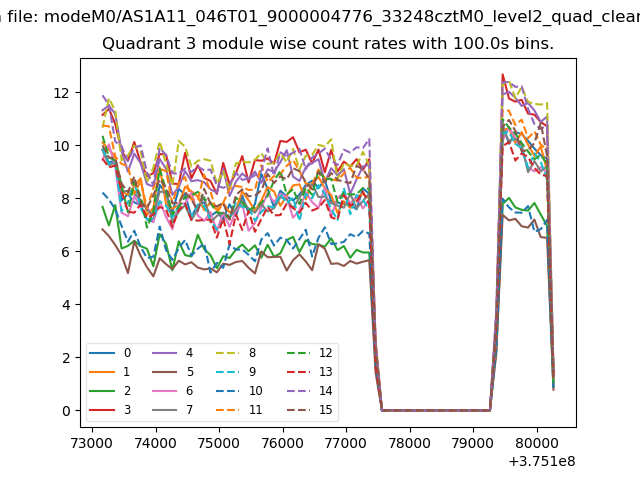
| Module-wise count rates for Quadrant C Data is divided into 100 sec bins |
 |
 |
| Module-wise count rates for Quadrant D Data is divided into 100 sec bins |
 |
 |
| Parameter | Plot |
|---|---|
| CZT HV Monitor | 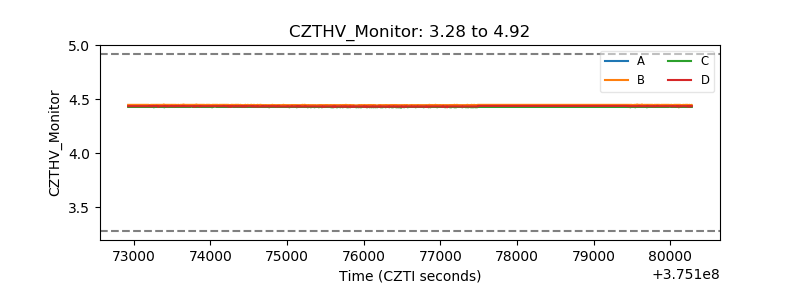 |
| D_VDD |  |
| Temperature 1 | 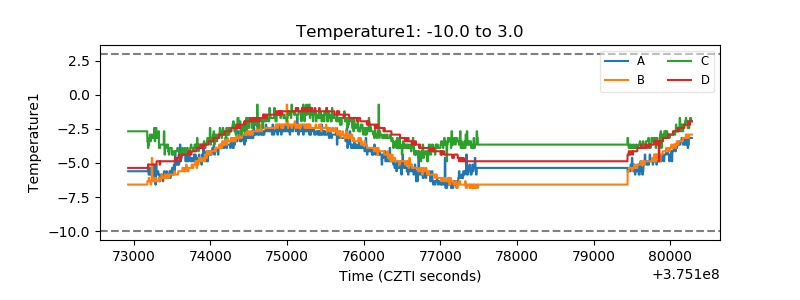 |
| Veto HV Monitor |  |
| Veto LLD | 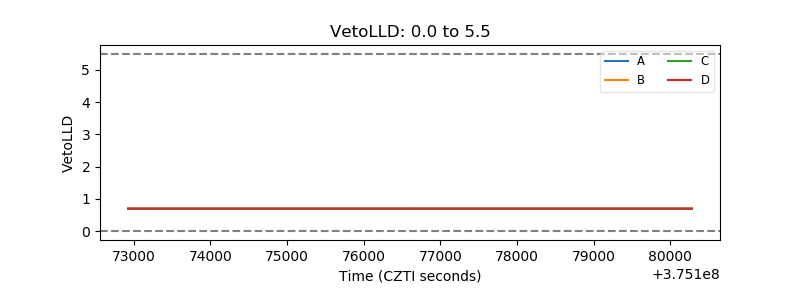 |
| Alpha Counter | 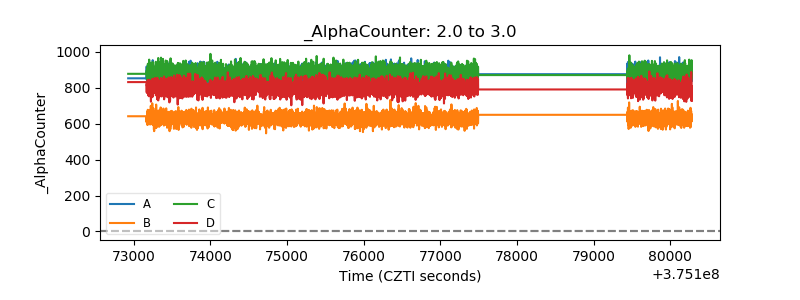 |
| _CPM_Rate | 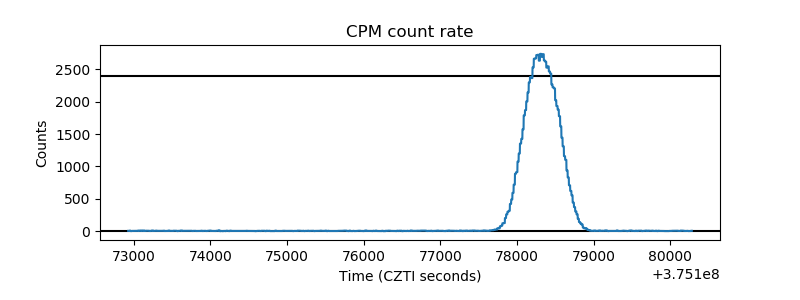 |
| CZT Counter | 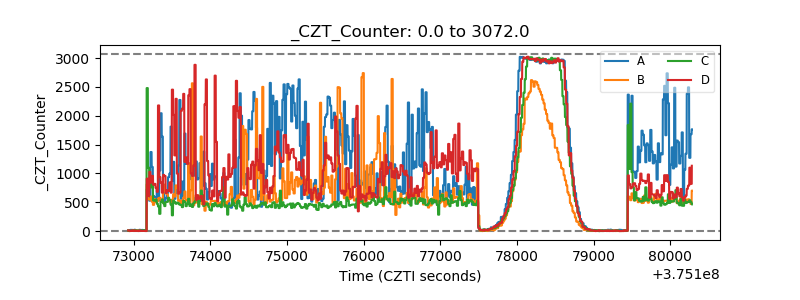 |
| +2.5 Volts monitor |  |
| +5 Volts monitor |  |
| _ROLL_ROT | 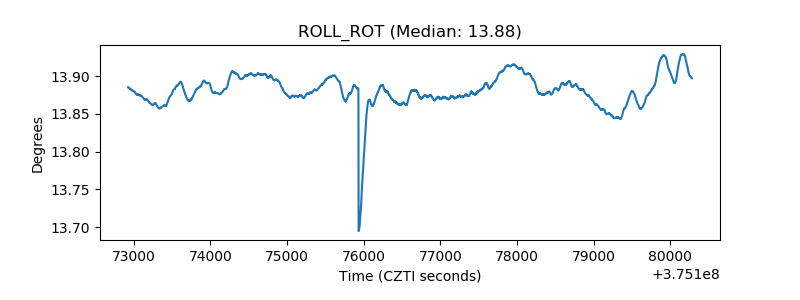 |
| _Roll_DEC | 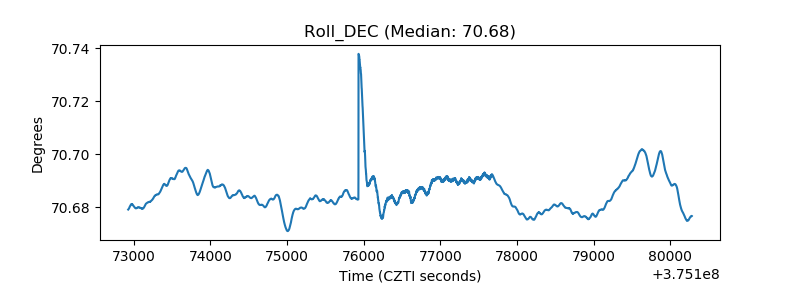 |
| _Roll_RA | 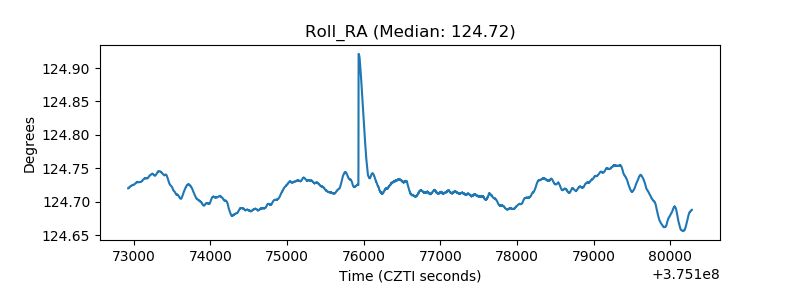 |
| Veto Counter | 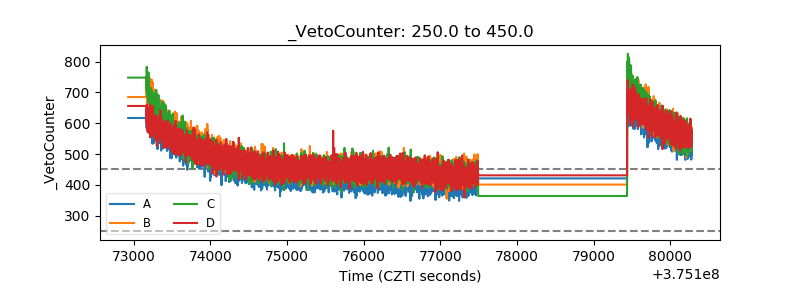 |