| Param | Original file | Final file |
|---|---|---|
| Filename | modeM0/AS1A11_046T01_9000004776_33250cztM0_level2.evt | modeM0/AS1A11_046T01_9000004776_33250cztM0_level2_quad_clean.evt |
| Size (bytes) | 505,059,840 | 114,266,880 |
| Size | 481.7 MB | 109.0 MB |
| Events in quadrant A | 3,806,210 | 791,760 |
| Events in quadrant B | 4,025,052 | 776,968 |
| Events in quadrant C | 2,871,514 | 774,995 |
| Events in quadrant D | 4,236,589 | 748,329 |
| Mode SS | |||
|---|---|---|---|
| Quadrant | BADHDUFLAG | Total packets | Discarded packets |
| A | 0 | 108 | 0 |
| B | 0 | 108 | 0 |
| C | 0 | 108 | 0 |
| D | 0 | 108 | 0 |
| Mode M0 | |||
|---|---|---|---|
| Quadrant | BADHDUFLAG | Total packets | Discarded packets |
| A | 0 | 14822 | 3 |
| B | 0 | 15369 | 2 |
| C | 0 | 11551 | 2 |
| D | 0 | 16319 | 2 |
| Mode M9 | |||
|---|---|---|---|
| Quadrant | BADHDUFLAG | Total packets | Discarded packets |
| A | 0 | 22 | 0 |
| B | 0 | 22 | 0 |
| C | 0 | 22 | 0 |
| D | 0 | 23 | 0 |
| Quadrant | Total seconds | Saturated seconds | Saturation percentage |
|---|---|---|---|
| A | 5261 | 307 | 5.835393% |
| B | 5261 | 385 | 7.318000% |
| C | 5261 | 64 | 1.216499% |
| D | 5261 | 65 | 1.235507% |
Noise dominated data is calculated using 1-second bins in cleaned event files. If a bin has >2000 counts, and if more than 50% of those come from <1% of pixels, then it is considered to be noise-dominated and hence unusable.
| Quadrant | # 1 sec bins | Bins with >0 counts | Bins with >2000 counts | High rate bins dominated by noise | Noise dominated (total time) | Noise dominated (detector-on time) | Marked lightcurve |
|---|---|---|---|---|---|---|---|
| A | 7384 | 5262 | 205 | 205 | 2.78% | 3.90% | 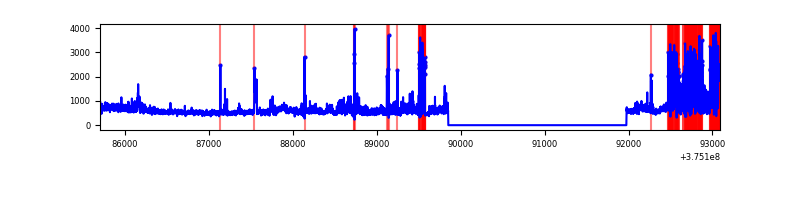 |
| B | 7384 | 5262 | 274 | 274 | 3.71% | 5.21% |  |
| C | 7384 | 5262 | 55 | 55 | 0.74% | 1.05% | 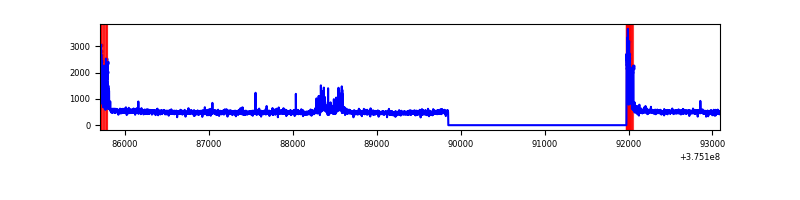 |
| D | 7384 | 5262 | 48 | 48 | 0.65% | 0.91% | 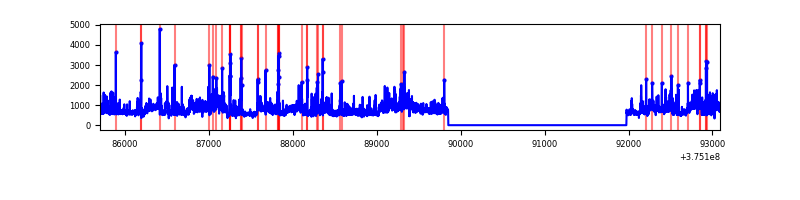 |
Top three noisy pixels from each quadrant. If the there are fewer than three noisy pixels in the level2.evt file, extra rows are filled as -1
| Pixel properties | Quadrant properties | ||||||
|---|---|---|---|---|---|---|---|
| Quadrant | DetID | PixID | Counts | Sigma | Mean | Median | Sigma |
| A | 15 | 169 | 1214210 | 9266.8 | 665 | 655 | 131.0 |
| A | 13 | 6 | 15064 | 110.03 | 665 | 655 | 131.0 |
| A | 13 | 254 | 9236 | 65.53 | 665 | 655 | 131.0 |
| B | 5 | 172 | 1066515 | 8931.04 | 646 | 633 | 119.3 |
| B | 4 | 170 | 154161 | 1286.41 | 646 | 633 | 119.3 |
| B | 0 | 219 | 96524 | 803.47 | 646 | 633 | 119.3 |
| C | 0 | 10 | 230985 | 1579.22 | 644 | 649 | 145.9 |
| C | 10 | 49 | 82090 | 558.37 | 644 | 649 | 145.9 |
| C | 3 | 233 | 13581 | 88.66 | 644 | 649 | 145.9 |
| D | 8 | 195 | 1052108 | 6535.18 | 659 | 642 | 160.9 |
| D | 2 | 250 | 236101 | 1463.45 | 659 | 642 | 160.9 |
| D | 2 | 249 | 95476 | 589.42 | 659 | 642 | 160.9 |
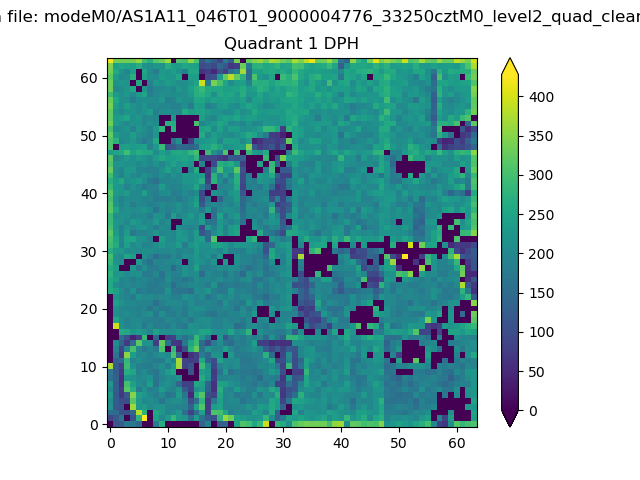
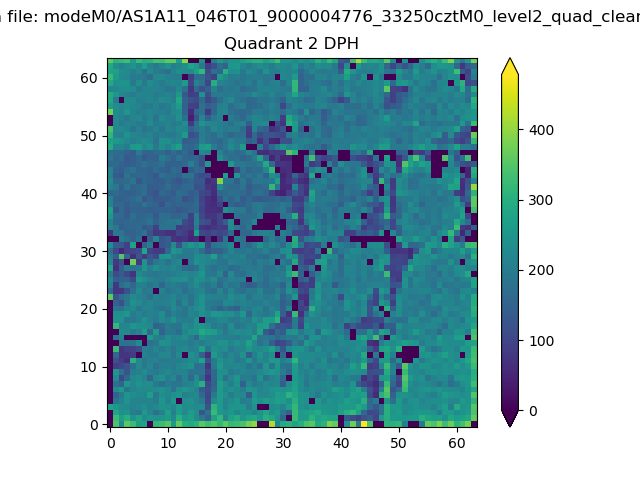
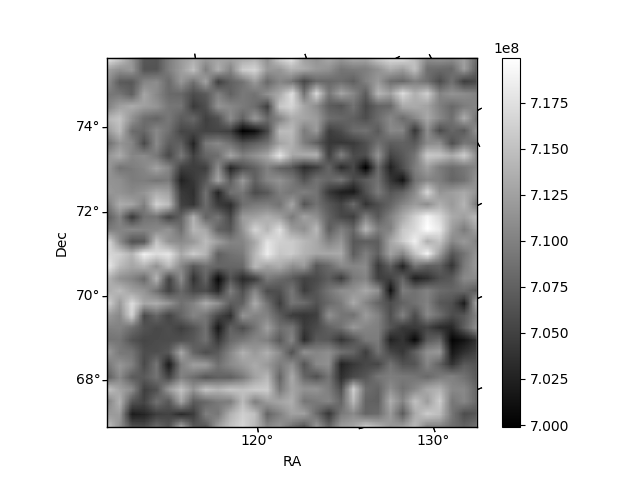
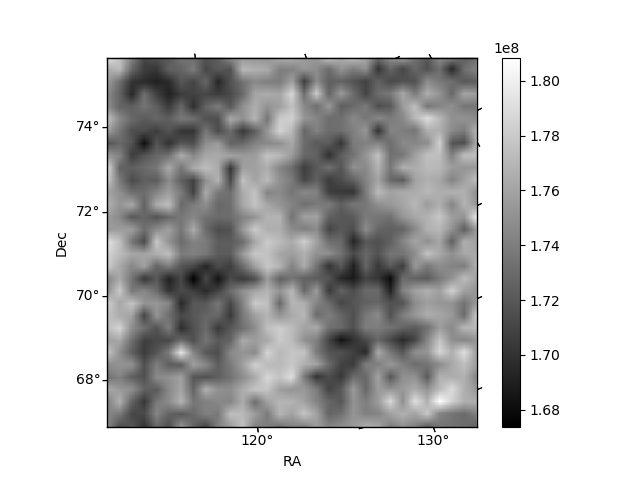
Histogram calculated using DETX and DETY for each event in the final _common_clean file
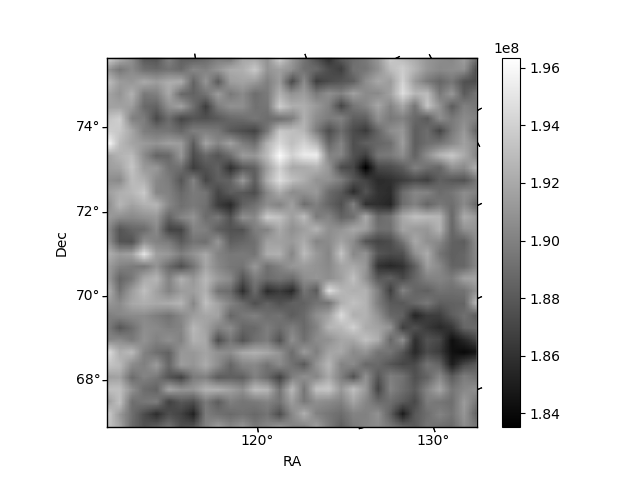
| Quadrant A | 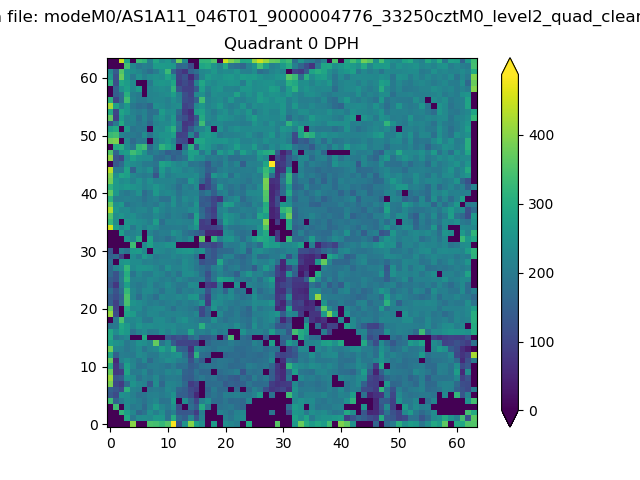 |
 |
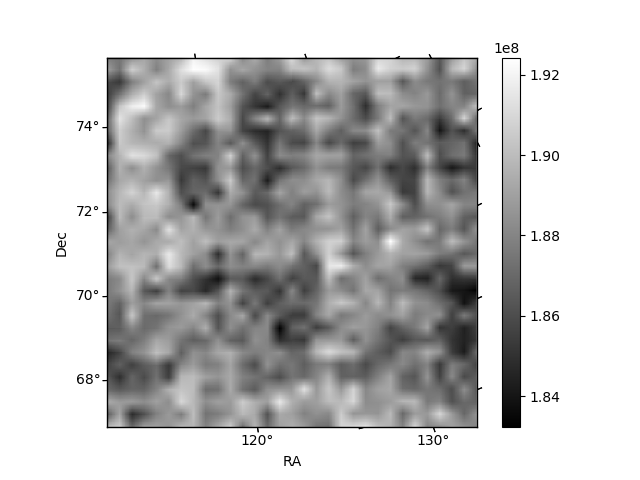
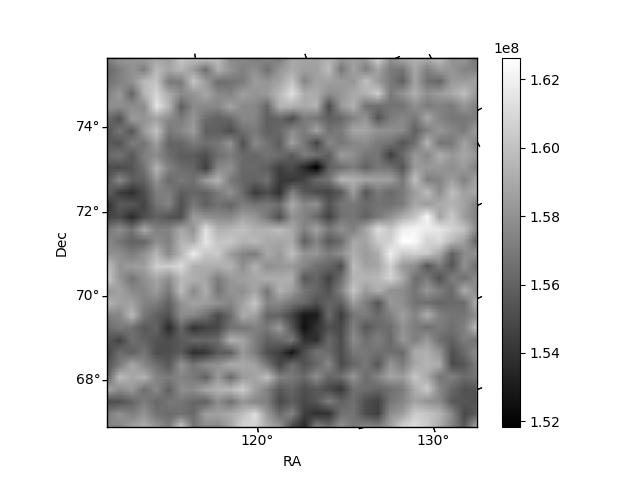
Quadrant B |
|---|---|---|---|
| Quadrant D | 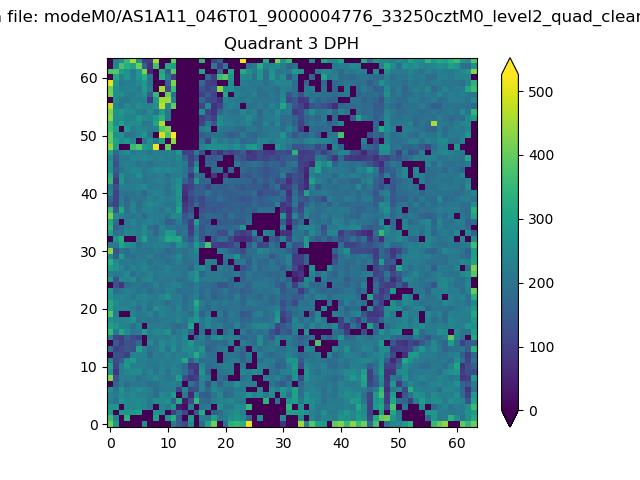 |
 |
Quadrant C |
| Plot type | Count rate plots | Images |
|---|---|---|
| Comparison with Poisson distribution Blue bars denote a histogram of data divided into 1 sec bins. Red curve is a Poisson curve with rate = median count rate of data. |
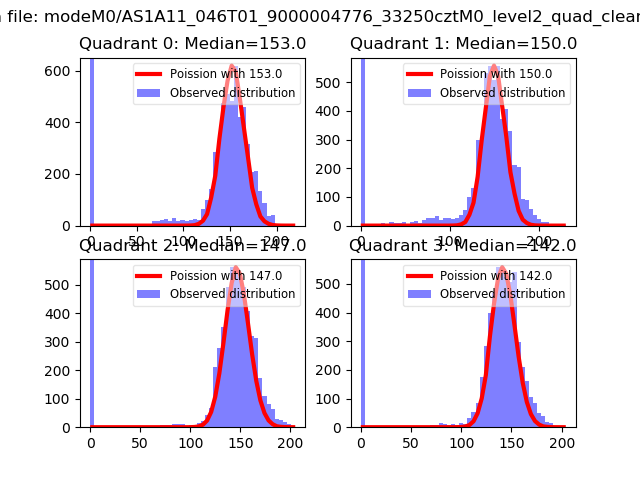 |
 |
| Quadrant-wise count rates Data is divided into 100 sec bins |
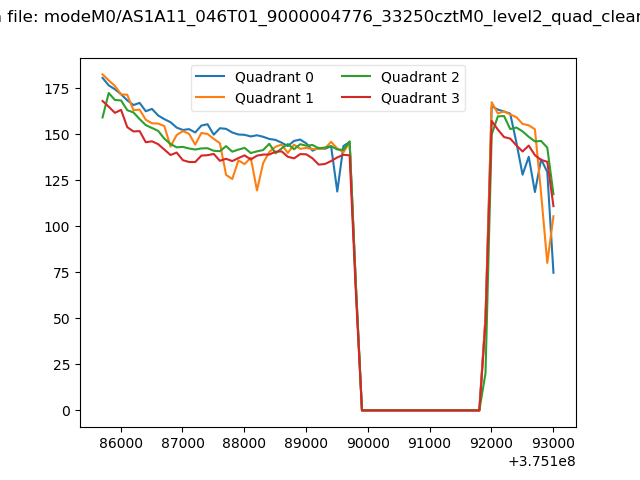 |
|
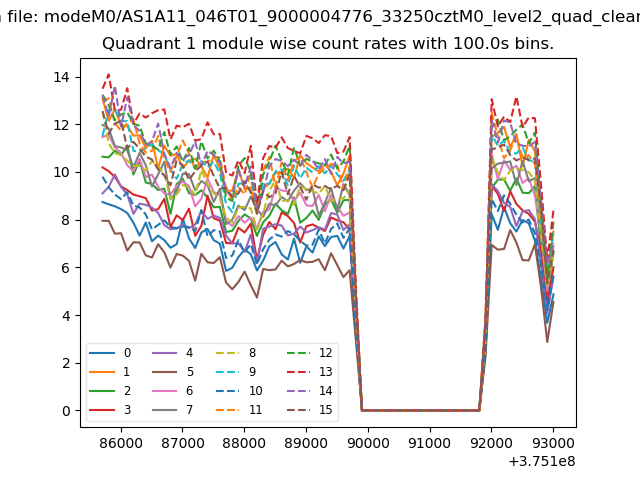
| Module-wise count rates for Quadrant A Data is divided into 100 sec bins |
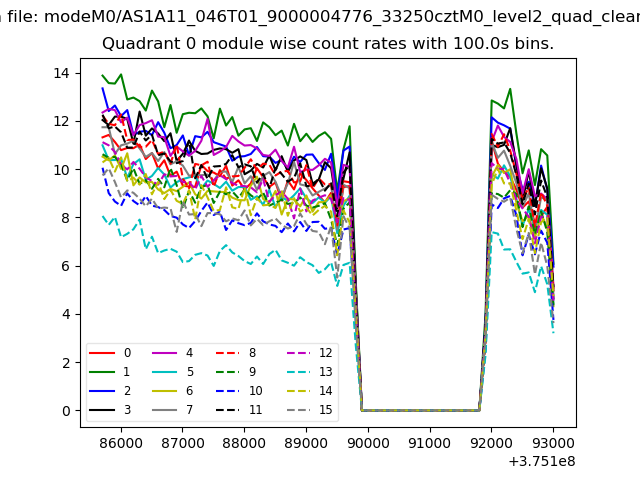 |
 |
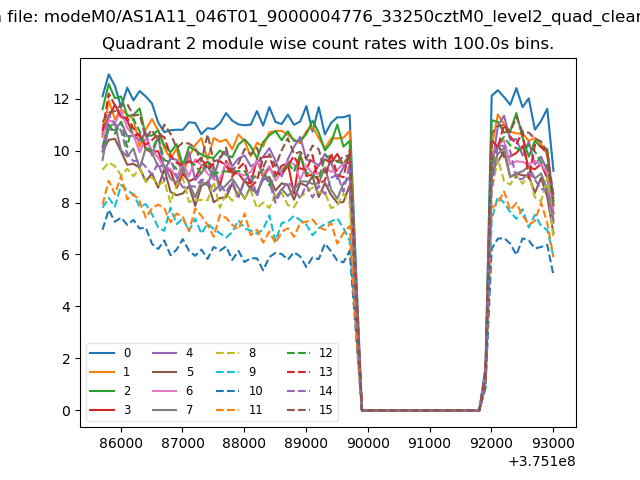
| Module-wise count rates for Quadrant B Data is divided into 100 sec bins |
 |
 |
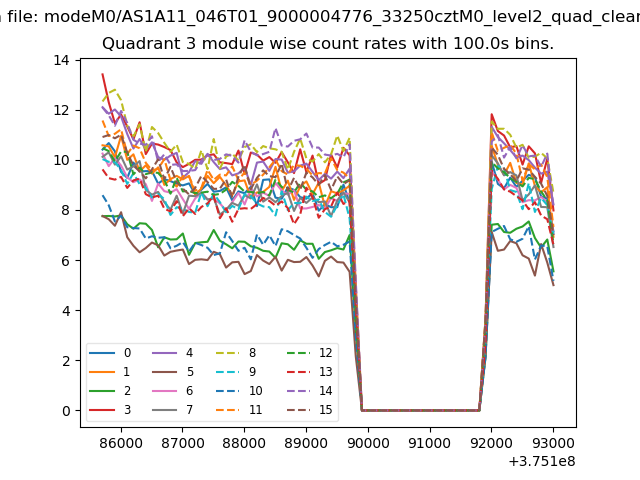
| Module-wise count rates for Quadrant C Data is divided into 100 sec bins |
 |
 |
| Module-wise count rates for Quadrant D Data is divided into 100 sec bins |
 |
 |
| Parameter | Plot |
|---|---|
| CZT HV Monitor |  |
| D_VDD | 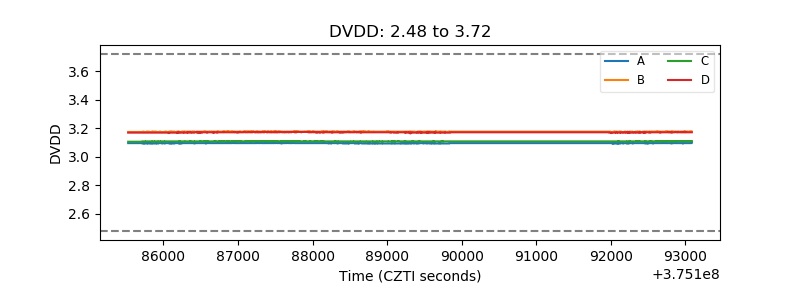 |
| Temperature 1 |  |
| Veto HV Monitor | 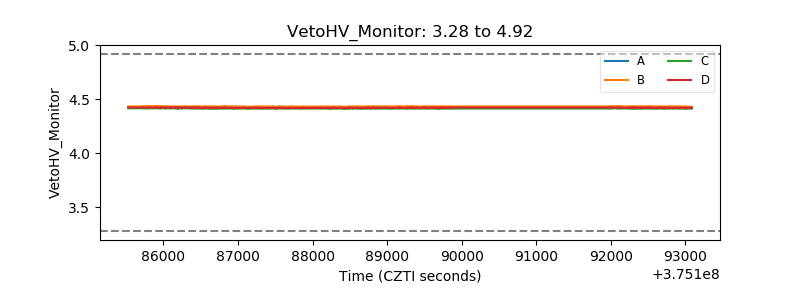 |
| Veto LLD | 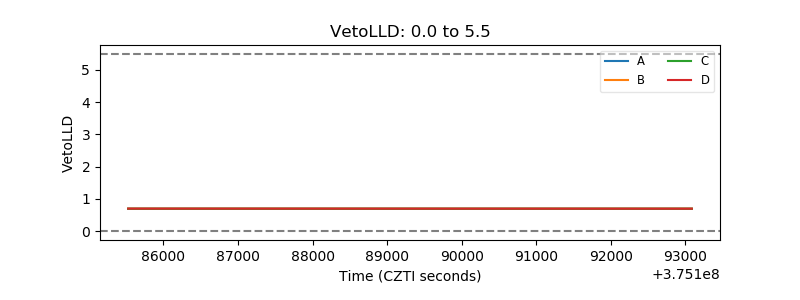 |
| Alpha Counter | 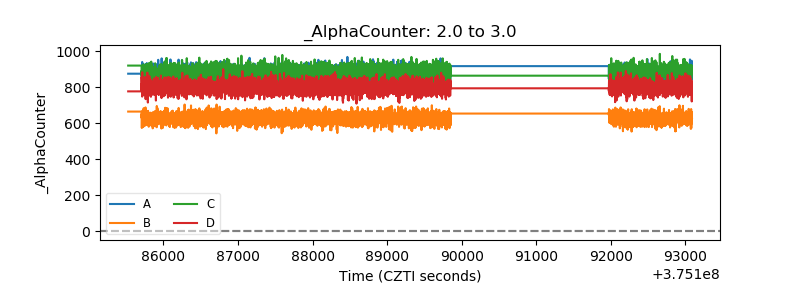 |
| _CPM_Rate | 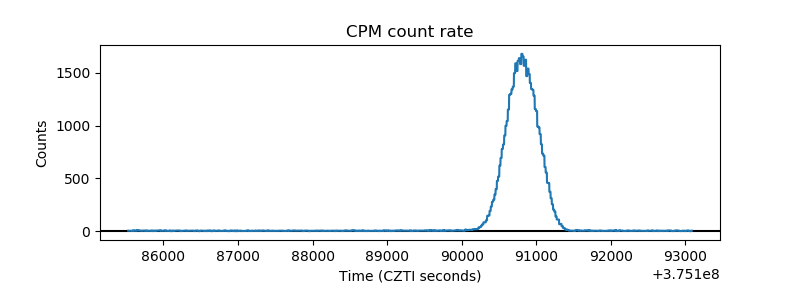 |
| CZT Counter |  |
| +2.5 Volts monitor |  |
| +5 Volts monitor |  |
| _ROLL_ROT | 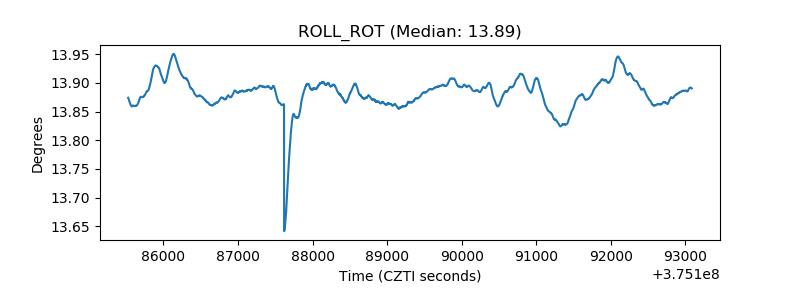 |
| _Roll_DEC | 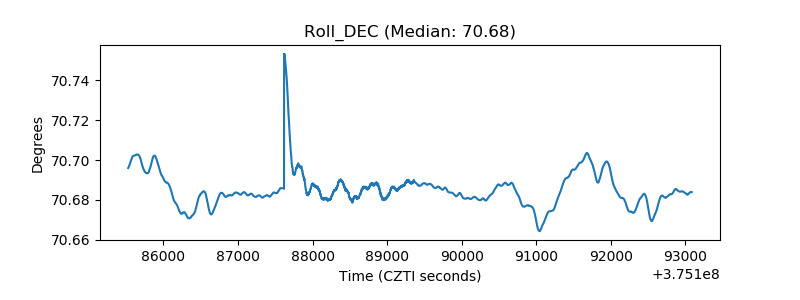 |
| _Roll_RA | 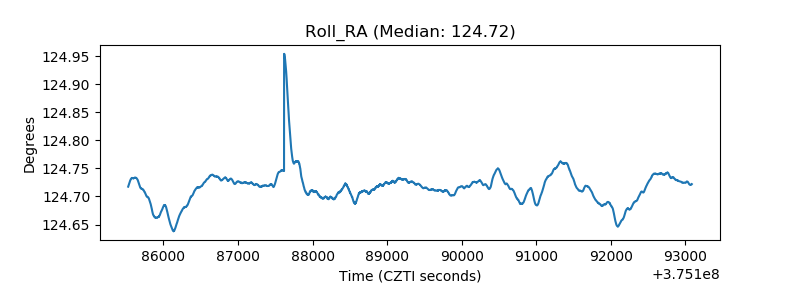 |
| Veto Counter | 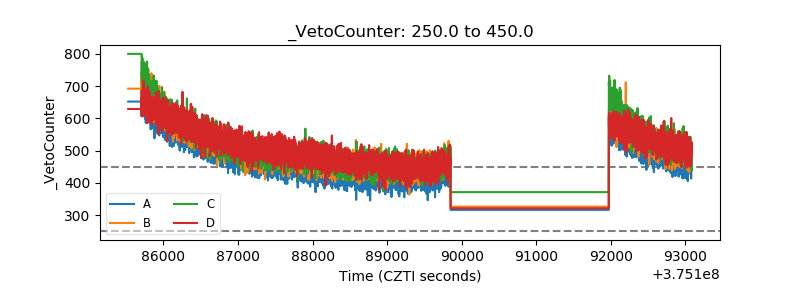 |