| Param | Original file | Final file |
|---|---|---|
| Filename | modeM0/AS1A11_046T01_9000004776_33251cztM0_level2.evt | modeM0/AS1A11_046T01_9000004776_33251cztM0_level2_quad_clean.evt |
| Size (bytes) | 532,828,800 | 103,331,520 |
| Size | 508.1 MB | 98.5 MB |
| Events in quadrant A | 4,531,236 | 686,815 |
| Events in quadrant B | 4,242,676 | 699,708 |
| Events in quadrant C | 2,661,105 | 707,176 |
| Events in quadrant D | 4,361,708 | 682,919 |
| Mode SS | |||
|---|---|---|---|
| Quadrant | BADHDUFLAG | Total packets | Discarded packets |
| A | 0 | 102 | 0 |
| B | 0 | 102 | 0 |
| C | 0 | 102 | 0 |
| D | 0 | 102 | 0 |
| Mode M0 | |||
|---|---|---|---|
| Quadrant | BADHDUFLAG | Total packets | Discarded packets |
| A | 0 | 17041 | 3 |
| B | 0 | 15919 | 2 |
| C | 0 | 10870 | 2 |
| D | 0 | 16515 | 2 |
| Mode M9 | |||
|---|---|---|---|
| Quadrant | BADHDUFLAG | Total packets | Discarded packets |
| A | 0 | 24 | 0 |
| B | 0 | 24 | 0 |
| C | 0 | 24 | 0 |
| D | 0 | 25 | 0 |
| Quadrant | Total seconds | Saturated seconds | Saturation percentage |
|---|---|---|---|
| A | 5029 | 685 | 13.620998% |
| B | 5029 | 422 | 8.391330% |
| C | 5029 | 81 | 1.610658% |
| D | 5029 | 122 | 2.425930% |
Noise dominated data is calculated using 1-second bins in cleaned event files. If a bin has >2000 counts, and if more than 50% of those come from <1% of pixels, then it is considered to be noise-dominated and hence unusable.
| Quadrant | # 1 sec bins | Bins with >0 counts | Bins with >2000 counts | High rate bins dominated by noise | Noise dominated (total time) | Noise dominated (detector-on time) | Marked lightcurve |
|---|---|---|---|---|---|---|---|
| A | 7181 | 5030 | 449 | 449 | 6.25% | 8.93% | 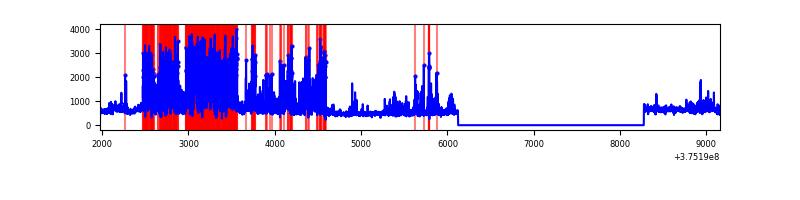 |
| B | 7181 | 5030 | 338 | 338 | 4.71% | 6.72% | 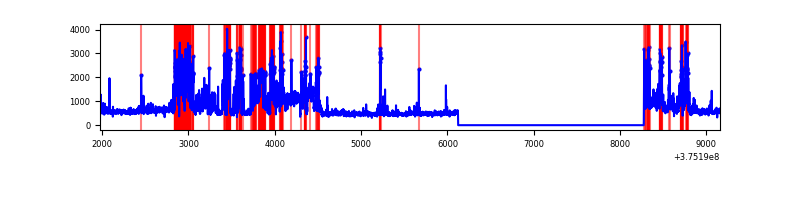 |
| C | 7181 | 5030 | 59 | 59 | 0.82% | 1.17% | 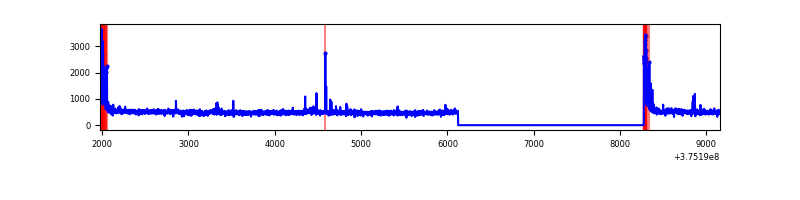 |
| D | 7181 | 5030 | 108 | 108 | 1.50% | 2.15% | 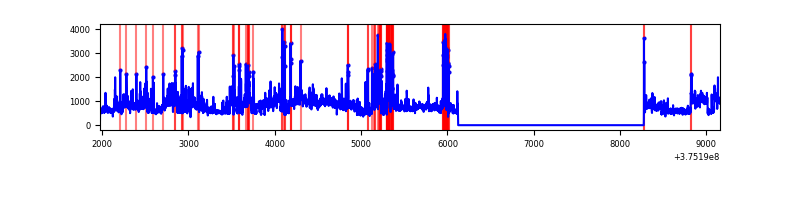 |
Top three noisy pixels from each quadrant. If the there are fewer than three noisy pixels in the level2.evt file, extra rows are filled as -1
| Pixel properties | Quadrant properties | ||||||
|---|---|---|---|---|---|---|---|
| Quadrant | DetID | PixID | Counts | Sigma | Mean | Median | Sigma |
| A | 15 | 169 | 2251257 | 19586.41 | 585 | 576 | 114.9 |
| A | 13 | 6 | 14760 | 123.44 | 585 | 576 | 114.9 |
| A | 13 | 254 | 8549 | 69.38 | 585 | 576 | 114.9 |
| B | 5 | 172 | 938923 | 8492.04 | 594 | 579 | 110.5 |
| B | 5 | 200 | 590220 | 5336.27 | 594 | 579 | 110.5 |
| B | 0 | 219 | 162535 | 1465.71 | 594 | 579 | 110.5 |
| C | 0 | 10 | 251551 | 1834.54 | 598 | 604 | 136.8 |
| C | 3 | 233 | 28800 | 206.13 | 598 | 604 | 136.8 |
| C | 10 | 49 | 12783 | 89.03 | 598 | 604 | 136.8 |
| D | 8 | 195 | 1310753 | 8079.51 | 599 | 588 | 162.2 |
| D | 2 | 250 | 351431 | 2163.57 | 599 | 588 | 162.2 |
| D | 2 | 249 | 88312 | 540.98 | 599 | 588 | 162.2 |
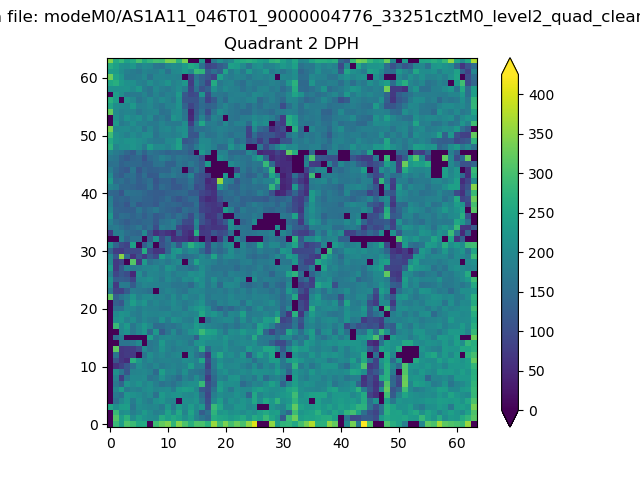
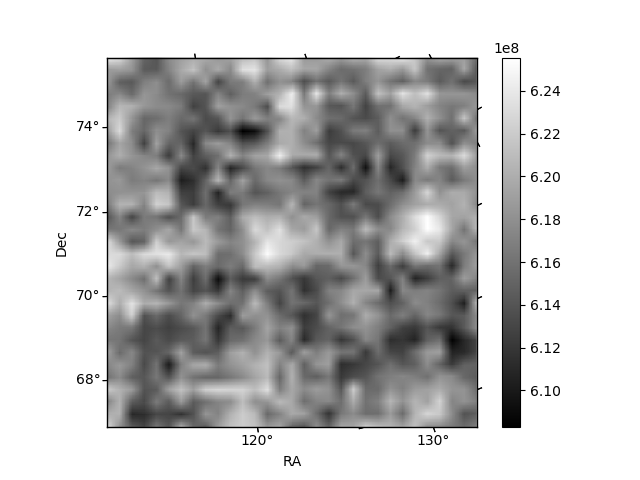
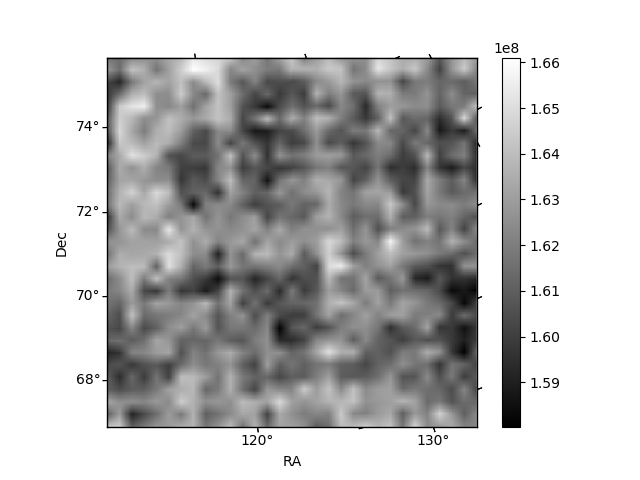
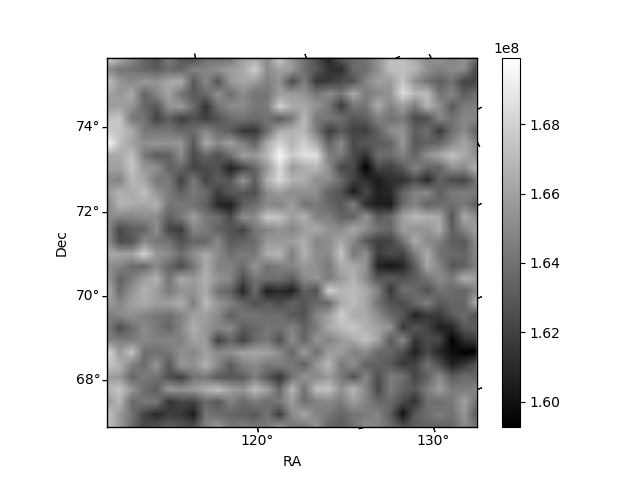
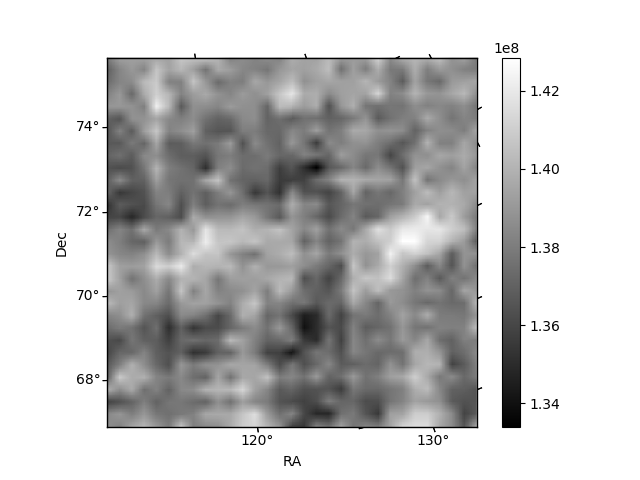
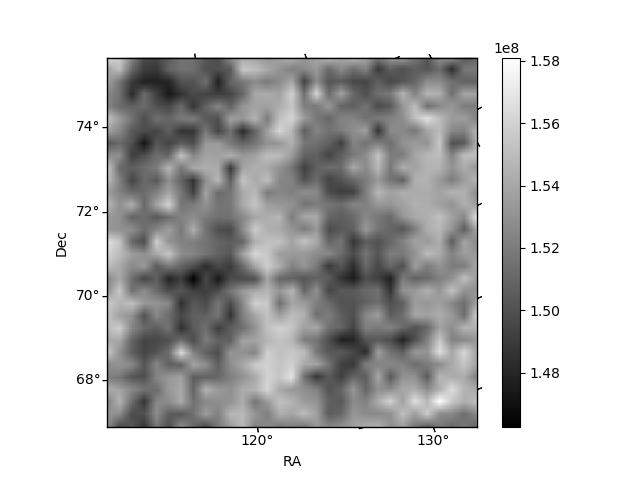
Histogram calculated using DETX and DETY for each event in the final _common_clean file
| Quadrant A | 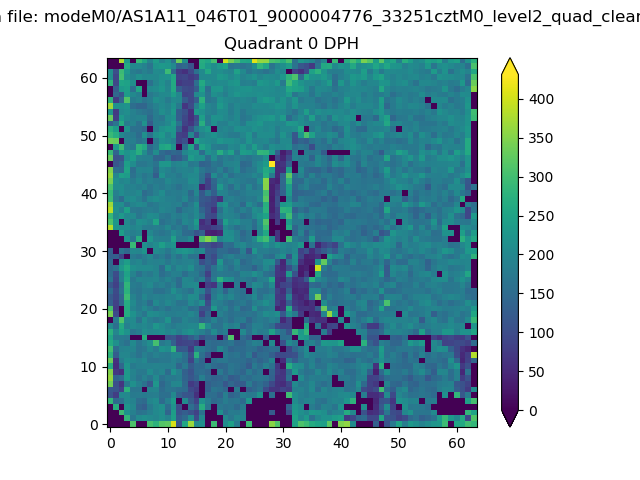 |
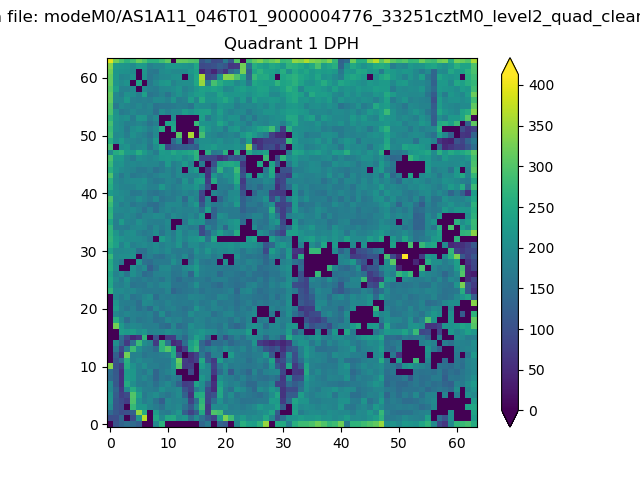 |
Quadrant B |
|---|---|---|---|
| Quadrant D | 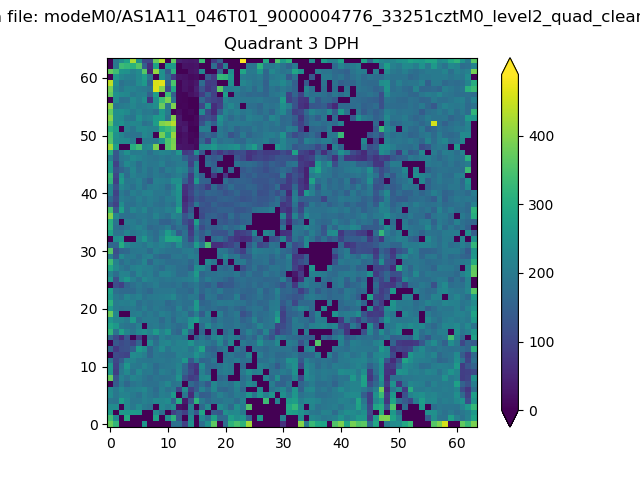 |
 |
Quadrant C |
| Plot type | Count rate plots | Images |
|---|---|---|
| Comparison with Poisson distribution Blue bars denote a histogram of data divided into 1 sec bins. Red curve is a Poisson curve with rate = median count rate of data. |
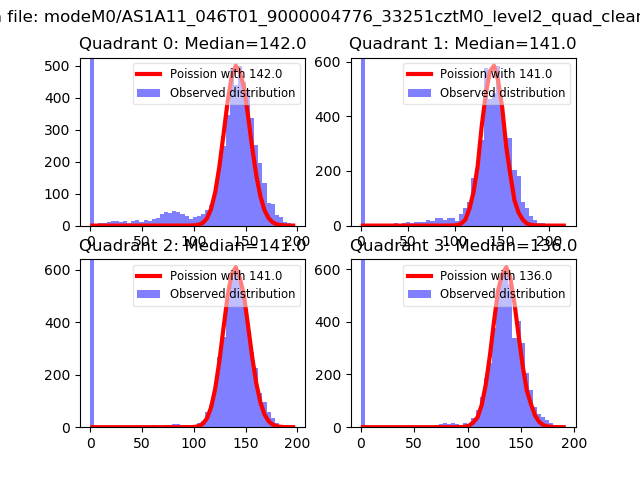 |
 |
| Quadrant-wise count rates Data is divided into 100 sec bins |
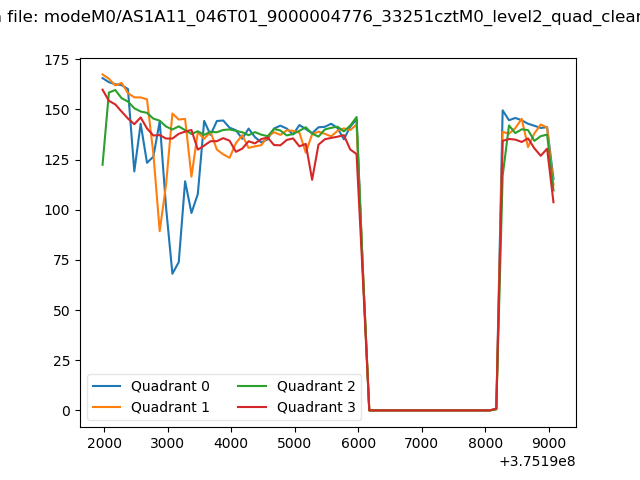 |
|
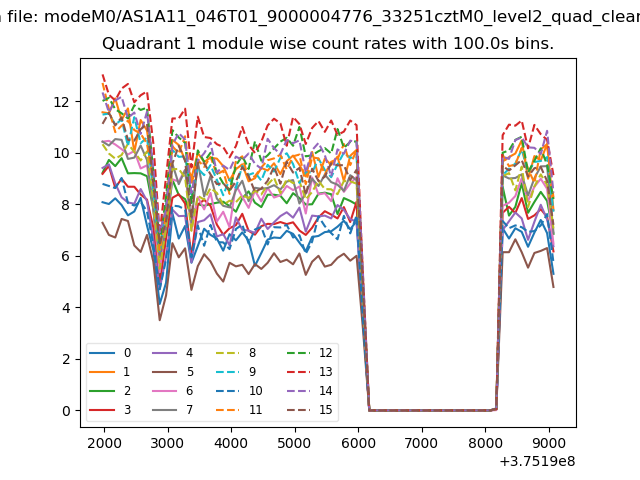
| Module-wise count rates for Quadrant A Data is divided into 100 sec bins |
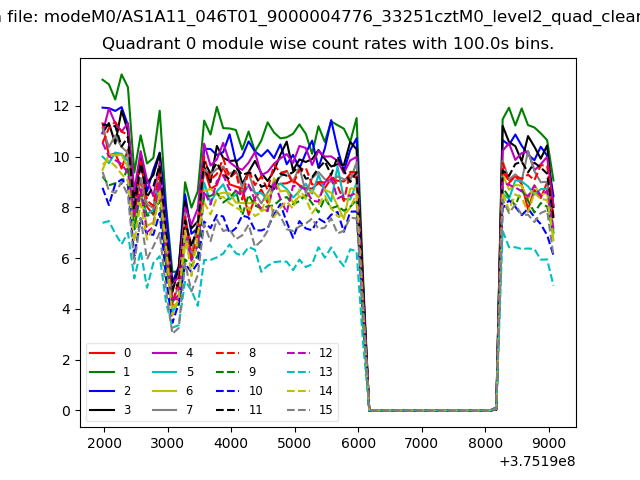 |
 |
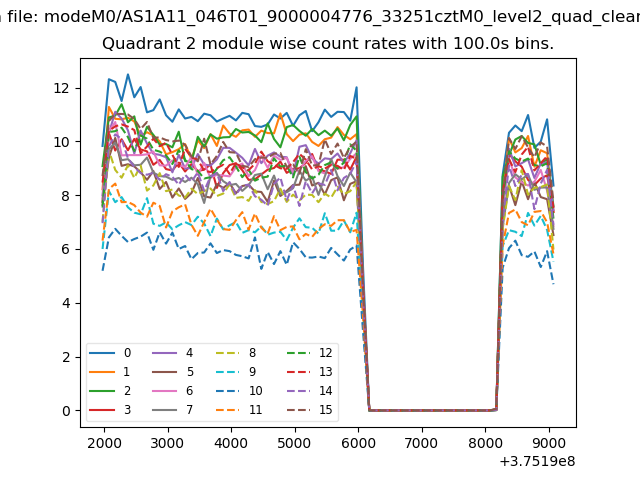
| Module-wise count rates for Quadrant B Data is divided into 100 sec bins |
 |
 |
| Module-wise count rates for Quadrant C Data is divided into 100 sec bins |
 |
 |
| Module-wise count rates for Quadrant D Data is divided into 100 sec bins |
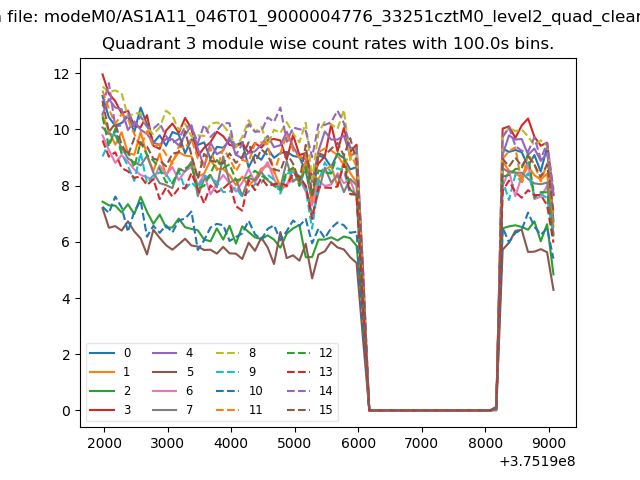 |
 |
| Parameter | Plot |
|---|---|
| CZT HV Monitor | 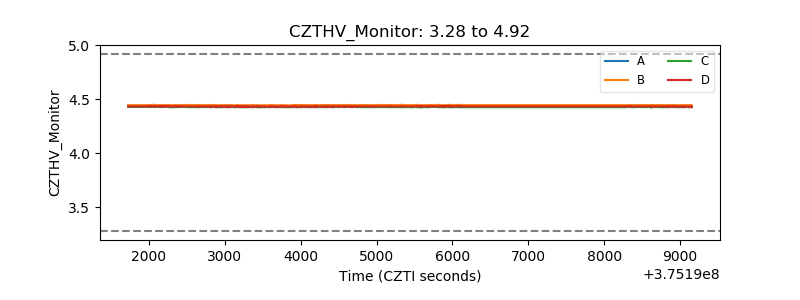 |
| D_VDD |  |
| Temperature 1 | 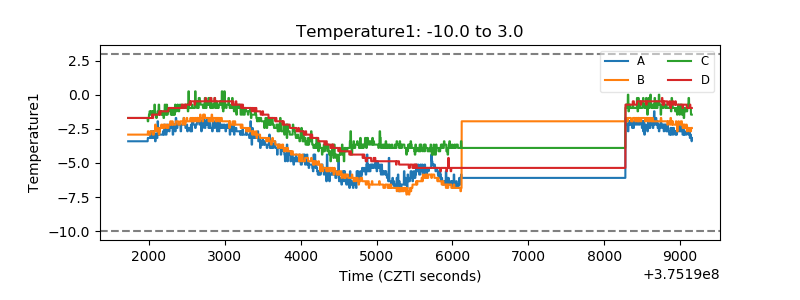 |
| Veto HV Monitor | 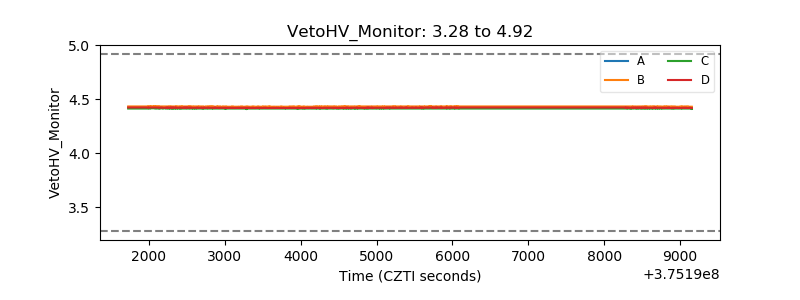 |
| Veto LLD | 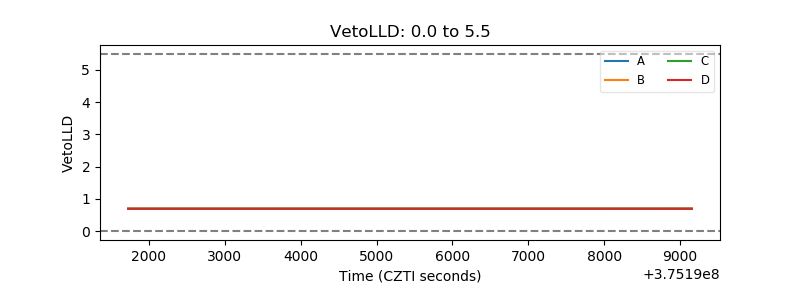 |
| Alpha Counter | 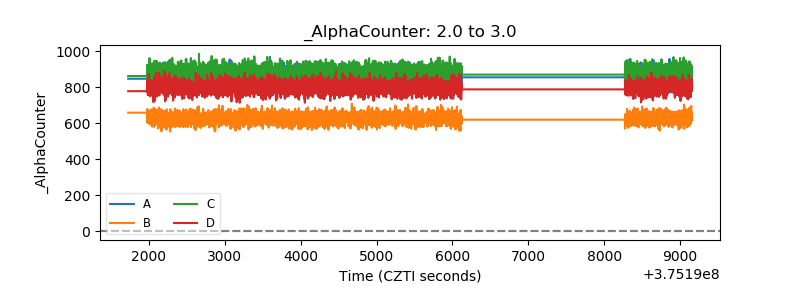 |
| _CPM_Rate | 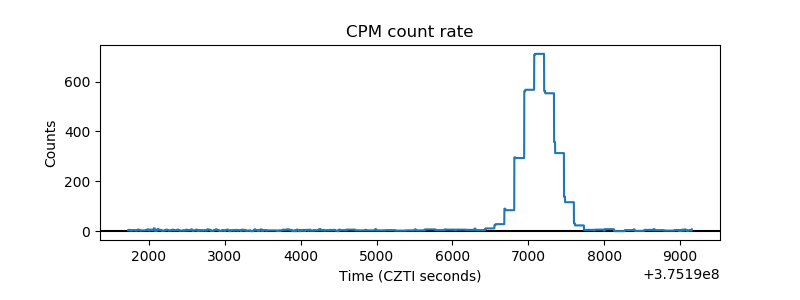 |
| CZT Counter | 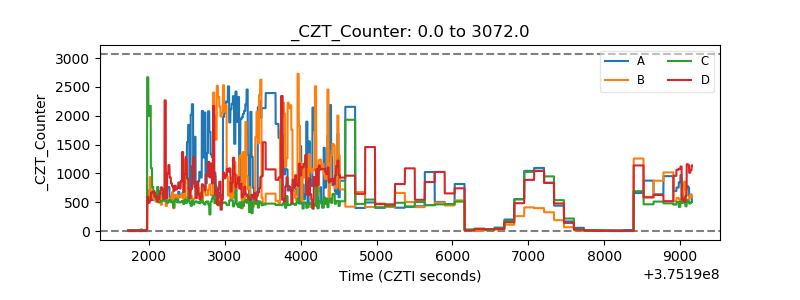 |
| +2.5 Volts monitor | 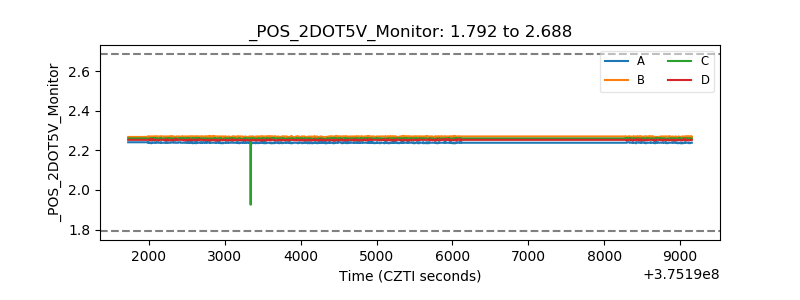 |
| +5 Volts monitor |  |
| _ROLL_ROT | 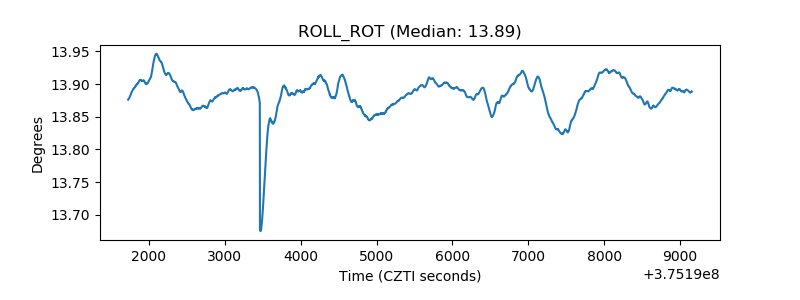 |
| _Roll_DEC | 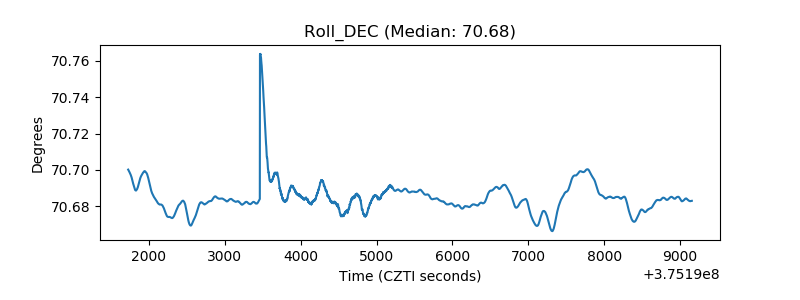 |
| _Roll_RA | 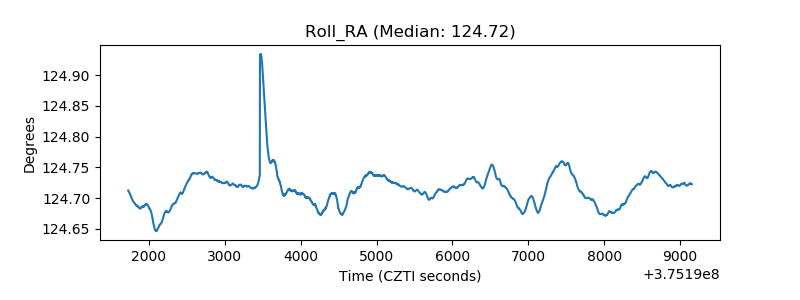 |
| Veto Counter | 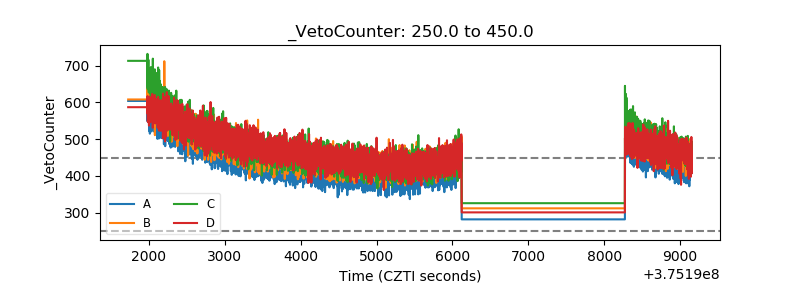 |