| Param | Original file | Final file |
|---|---|---|
| Filename | modeM0/AS1A11_046T01_9000004776_33252cztM0_level2.evt | modeM0/AS1A11_046T01_9000004776_33252cztM0_level2_quad_clean.evt |
| Size (bytes) | 246,582,720 | 55,981,440 |
| Size | 235.2 MB | 53.4 MB |
| Events in quadrant A | 1,667,730 | 386,684 |
| Events in quadrant B | 2,143,089 | 372,868 |
| Events in quadrant C | 1,438,537 | 373,194 |
| Events in quadrant D | 2,027,035 | 362,588 |
| Mode SS | |||
|---|---|---|---|
| Quadrant | BADHDUFLAG | Total packets | Discarded packets |
| A | 0 | 56 | 0 |
| B | 0 | 56 | 0 |
| C | 0 | 56 | 0 |
| D | 0 | 56 | 0 |
| Mode M0 | |||
|---|---|---|---|
| Quadrant | BADHDUFLAG | Total packets | Discarded packets |
| A | 0 | 6835 | 1 |
| B | 0 | 8267 | 1 |
| C | 0 | 6031 | 1 |
| D | 0 | 7843 | 1 |
| Mode M9 | |||
|---|---|---|---|
| Quadrant | BADHDUFLAG | Total packets | Discarded packets |
| A | 0 | 4 | 0 |
| B | 0 | 4 | 0 |
| C | 0 | 4 | 0 |
| D | 0 | 5 | 0 |
| Quadrant | Total seconds | Saturated seconds | Saturation percentage |
|---|---|---|---|
| A | 2794 | 7 | 0.250537% |
| B | 2794 | 158 | 5.654975% |
| C | 2794 | 37 | 1.324266% |
| D | 2794 | 16 | 0.572656% |
Noise dominated data is calculated using 1-second bins in cleaned event files. If a bin has >2000 counts, and if more than 50% of those come from <1% of pixels, then it is considered to be noise-dominated and hence unusable.
| Quadrant | # 1 sec bins | Bins with >0 counts | Bins with >2000 counts | High rate bins dominated by noise | Noise dominated (total time) | Noise dominated (detector-on time) | Marked lightcurve |
|---|---|---|---|---|---|---|---|
| A | 2794 | 2794 | 2 | 2 | 0.07% | 0.07% | 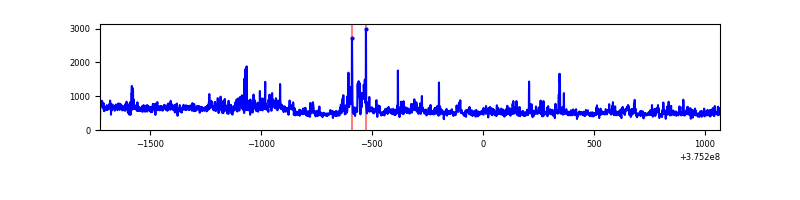 |
| B | 2794 | 2794 | 120 | 120 | 4.29% | 4.29% | 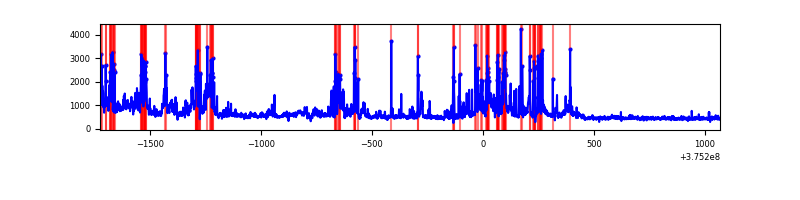 |
| C | 2794 | 2794 | 24 | 24 | 0.86% | 0.86% | 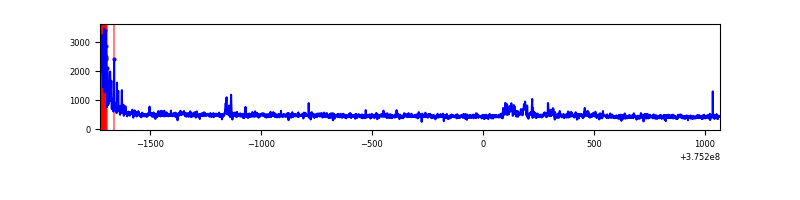 |
| D | 2794 | 2794 | 16 | 16 | 0.57% | 0.57% | 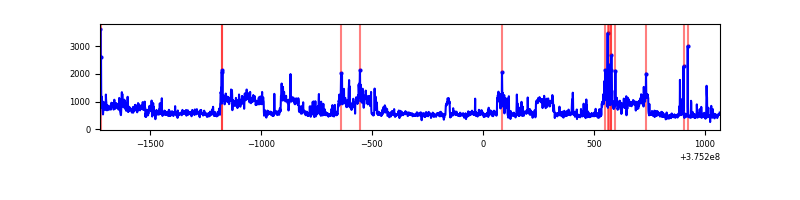 |
Top three noisy pixels from each quadrant. If the there are fewer than three noisy pixels in the level2.evt file, extra rows are filled as -1
| Pixel properties | Quadrant properties | ||||||
|---|---|---|---|---|---|---|---|
| Quadrant | DetID | PixID | Counts | Sigma | Mean | Median | Sigma |
| A | 15 | 169 | 390299 | 5937.76 | 328 | 322 | 65.7 |
| A | 13 | 6 | 7578 | 110.48 | 328 | 322 | 65.7 |
| A | 13 | 254 | 4935 | 70.24 | 328 | 322 | 65.7 |
| B | 5 | 172 | 526609 | 8689.99 | 319 | 311 | 60.6 |
| B | 0 | 219 | 125229 | 2062.59 | 319 | 311 | 60.6 |
| B | 5 | 200 | 85888 | 1413.01 | 319 | 311 | 60.6 |
| C | 0 | 10 | 123520 | 1656.71 | 321 | 322 | 74.4 |
| C | 10 | 49 | 47972 | 640.77 | 321 | 322 | 74.4 |
| C | 14 | 254 | 9143 | 118.62 | 321 | 322 | 74.4 |
| D | 8 | 195 | 590865 | 6942.95 | 322 | 315 | 85.1 |
| D | 2 | 250 | 74960 | 877.58 | 322 | 315 | 85.1 |
| D | 12 | 218 | 19368 | 224.0 | 322 | 315 | 85.1 |
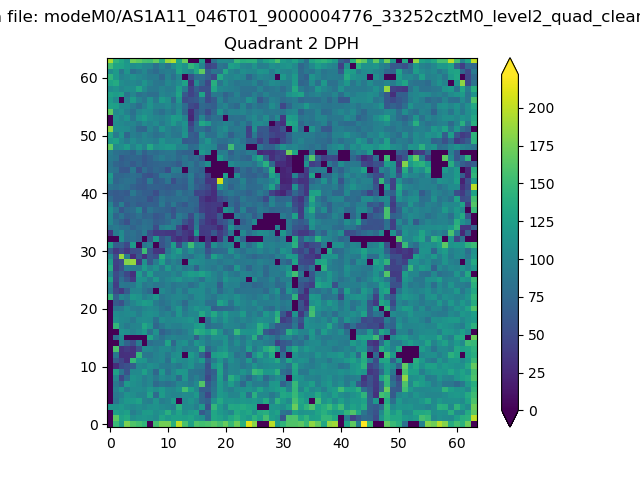
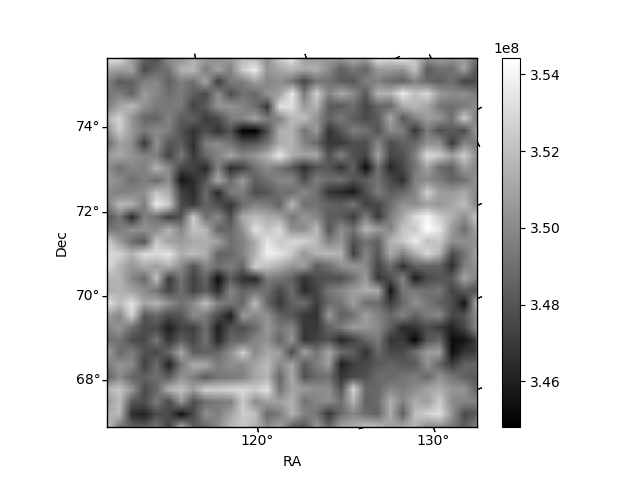
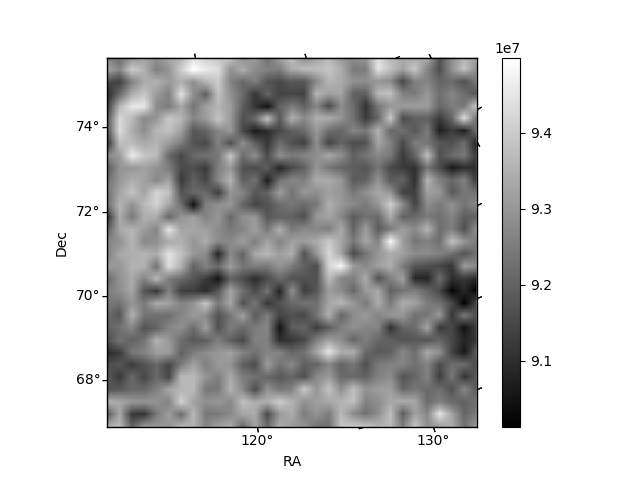
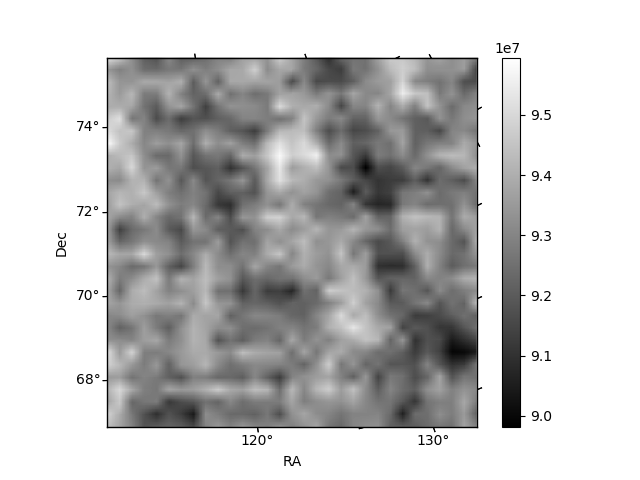
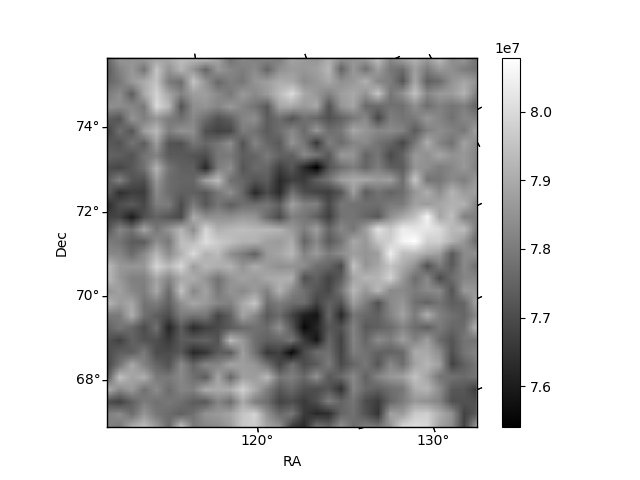
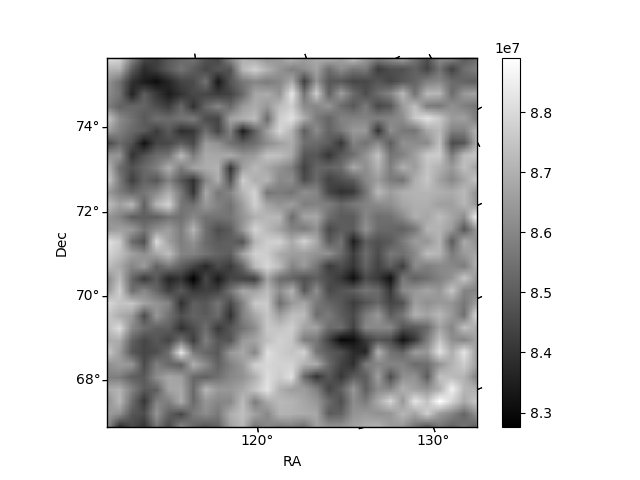
Histogram calculated using DETX and DETY for each event in the final _common_clean file
| Quadrant A | 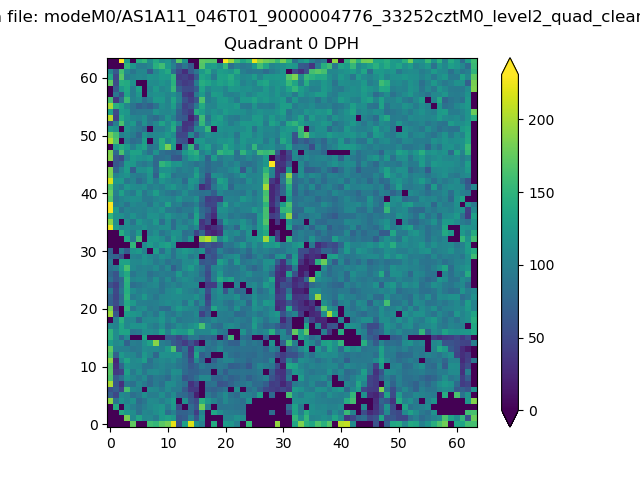 |
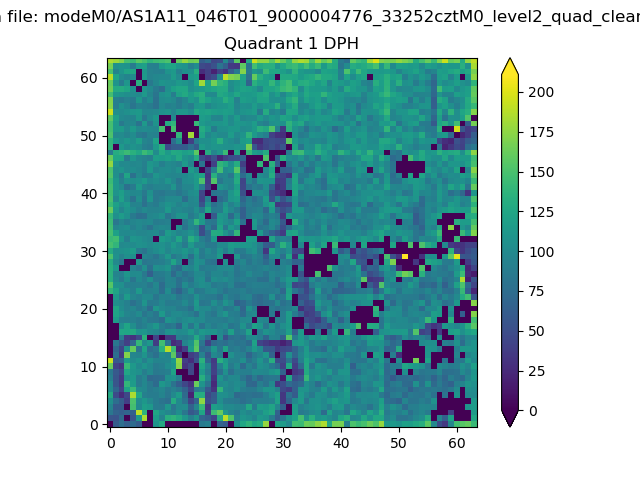 |
Quadrant B |
|---|---|---|---|
| Quadrant D | 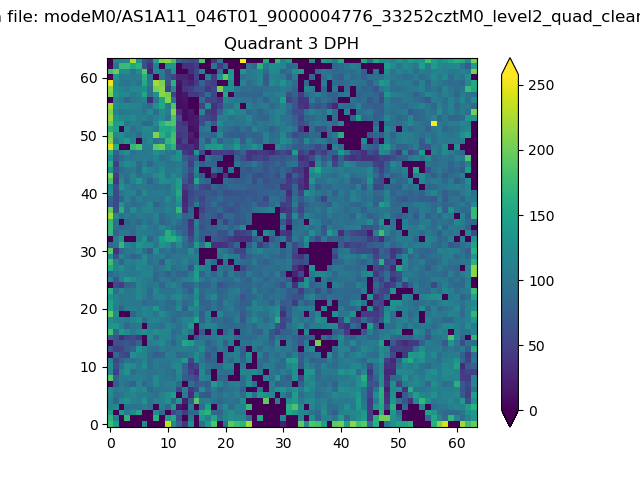 |
 |
Quadrant C |
| Plot type | Count rate plots | Images |
|---|---|---|
| Comparison with Poisson distribution Blue bars denote a histogram of data divided into 1 sec bins. Red curve is a Poisson curve with rate = median count rate of data. |
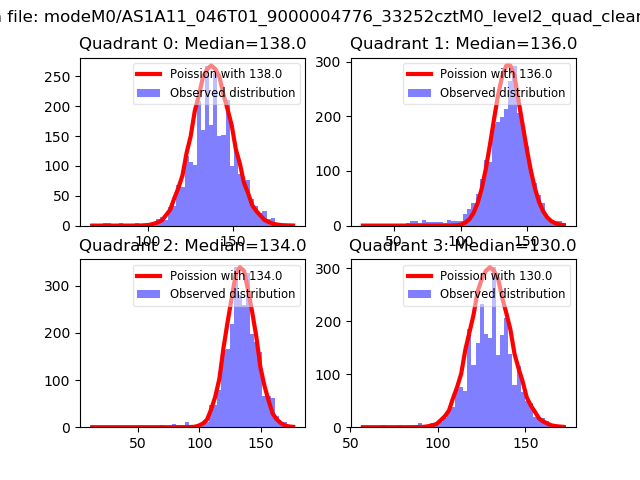 |
 |
| Quadrant-wise count rates Data is divided into 100 sec bins |
 |
|
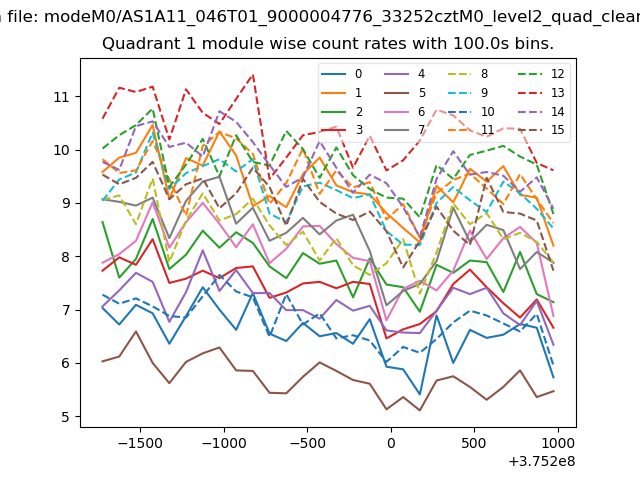
| Module-wise count rates for Quadrant A Data is divided into 100 sec bins |
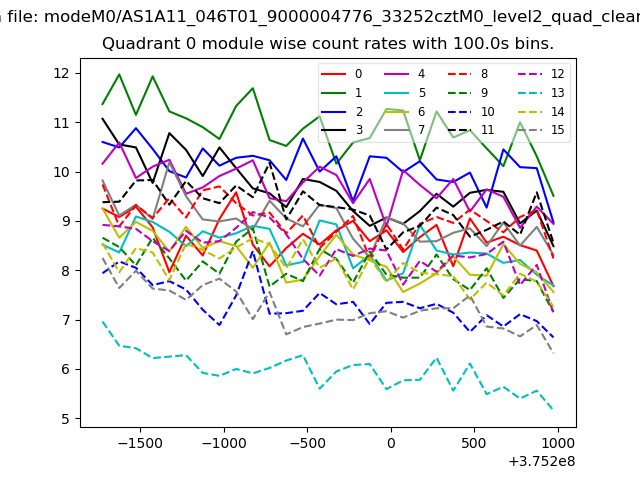 |
 |
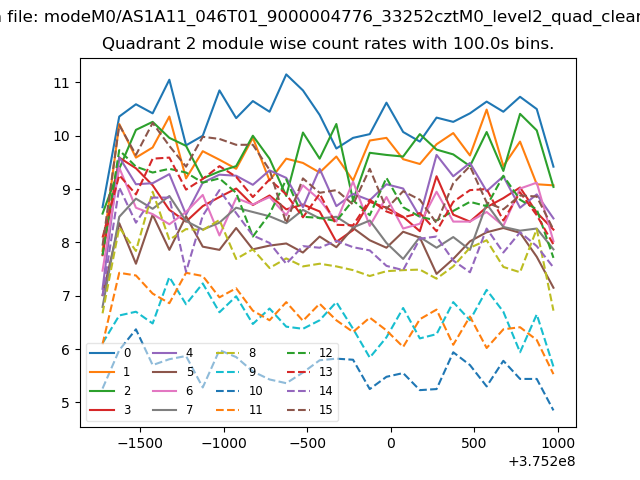
| Module-wise count rates for Quadrant B Data is divided into 100 sec bins |
 |
 |
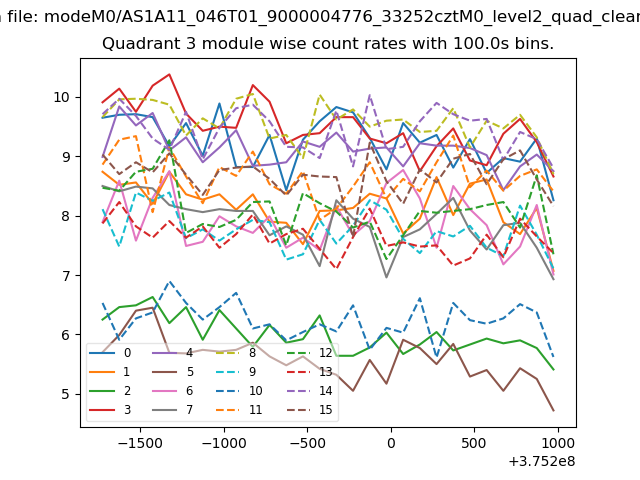
| Module-wise count rates for Quadrant C Data is divided into 100 sec bins |
 |
 |
| Module-wise count rates for Quadrant D Data is divided into 100 sec bins |
 |
 |
| Parameter | Plot |
|---|---|
| CZT HV Monitor | 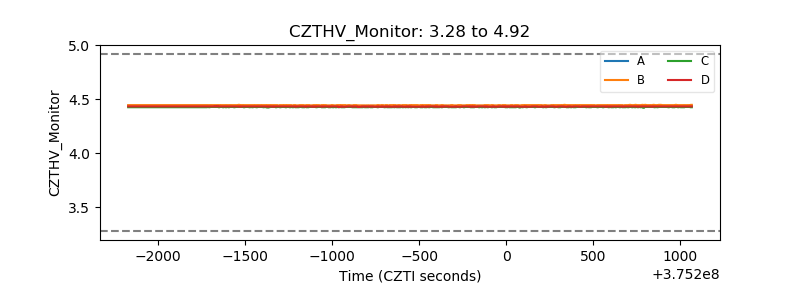 |
| D_VDD | 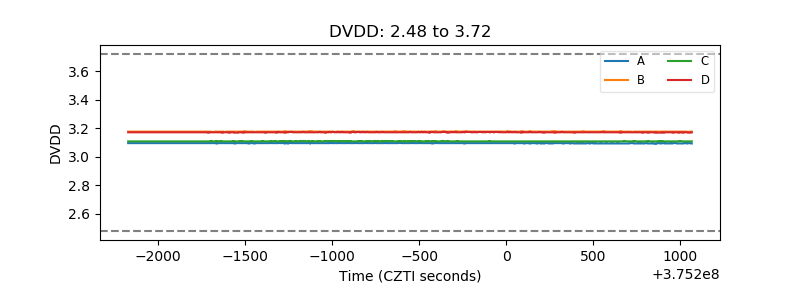 |
| Temperature 1 | 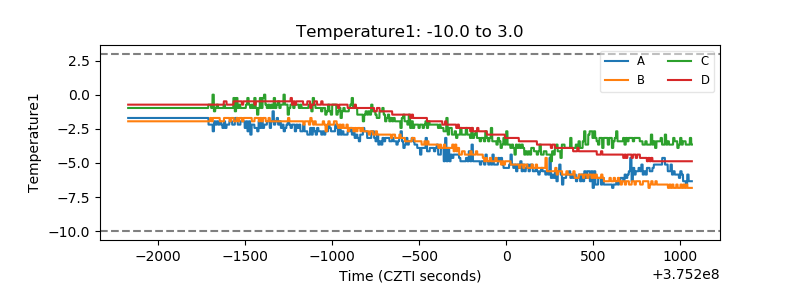 |
| Veto HV Monitor | 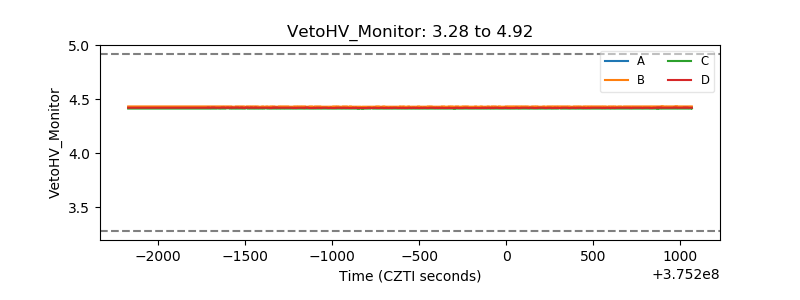 |
| Veto LLD | 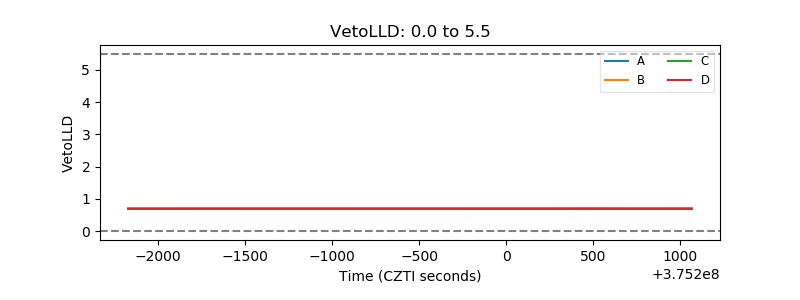 |
| Alpha Counter |  |
| _CPM_Rate | 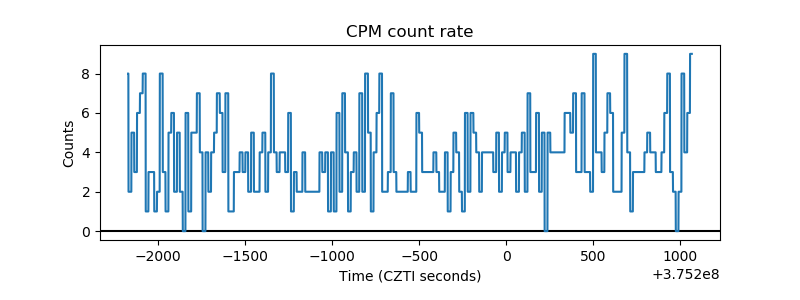 |
| CZT Counter | 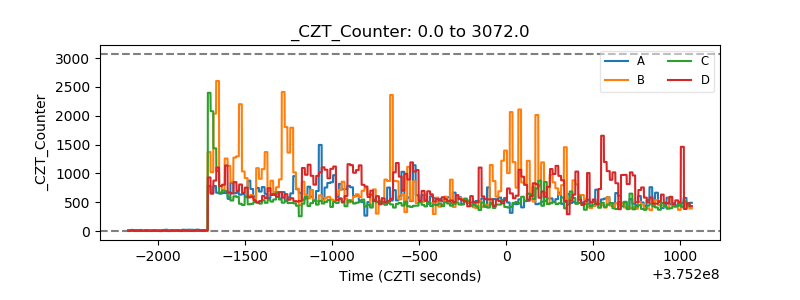 |
| +2.5 Volts monitor |  |
| +5 Volts monitor |  |
| _ROLL_ROT | 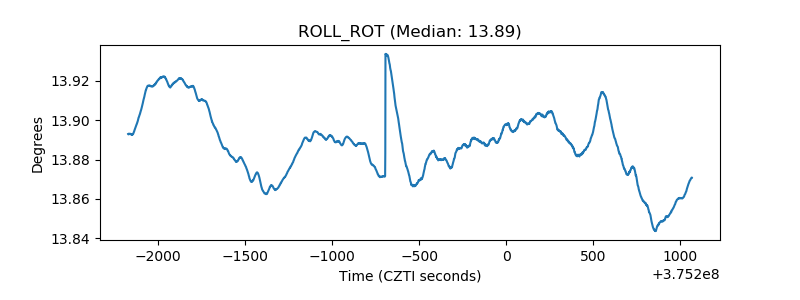 |
| _Roll_DEC | 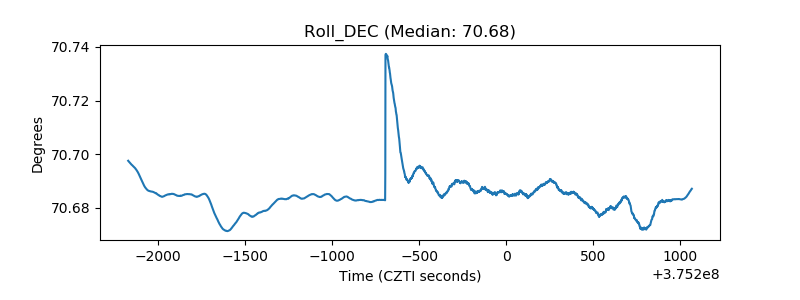 |
| _Roll_RA | 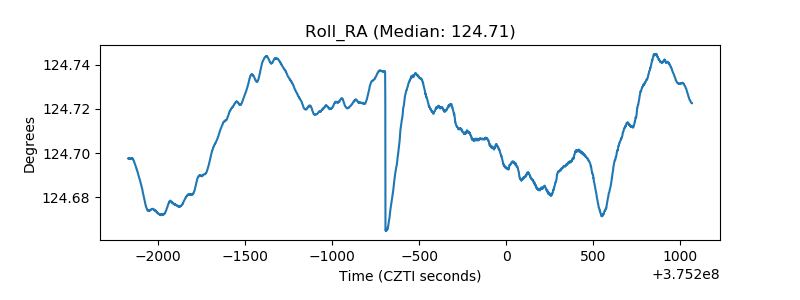 |
| Veto Counter | 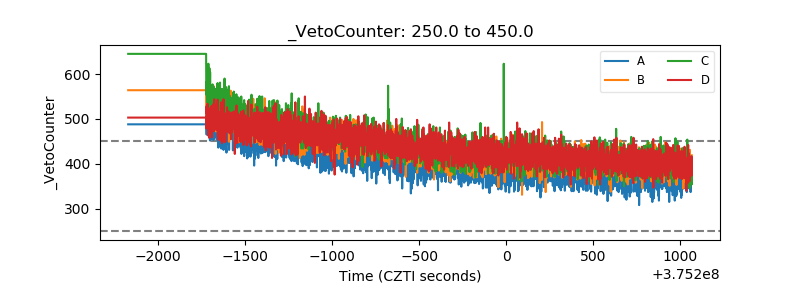 |