| Param | Original file | Final file |
|---|---|---|
| Filename | modeM0/AS1A11_047T10_9000004778cztM0_level2.fits | modeM0/AS1A11_047T10_9000004778cztM0_level2_quad_clean.evt |
| Size (bytes) | 847,313,280 | 895,544,640 |
| Size | 808.1 MB | 854.1 MB |
| Events in quadrant A | 5,193,788 | 5,259,803 |
| Events in quadrant B | 4,820,718 | 5,458,841 |
| Events in quadrant C | 5,137,060 | 5,392,933 |
| Events in quadrant D | 4,324,566 | 4,833,497 |
| Mode M0 | |||
|---|---|---|---|
| Quadrant | BADHDUFLAG | Total packets | Discarded packets |
| A | 0 | 245278 | 0 |
| B | 0 | 256107 | 0 |
| C | 0 | 196321 | 0 |
| D | 0 | 308629 | 0 |
| Mode SS | |||
|---|---|---|---|
| Quadrant | BADHDUFLAG | Total packets | Discarded packets |
| A | 0 | 1840 | 0 |
| B | 0 | 1842 | 0 |
| C | 0 | 1842 | 0 |
| D | 0 | 1844 | 0 |
| Mode M9 | |||
|---|---|---|---|
| Quadrant | BADHDUFLAG | Total packets | Discarded packets |
| A | 0 | 329 | 0 |
| B | 0 | 329 | 0 |
| C | 0 | 329 | 0 |
| D | 0 | 330 | 0 |
| Quadrant | Total seconds | Saturated seconds | Saturation percentage |
|---|---|---|---|
| A | 90112 | 7451 | 8.268599% |
| B | 90107 | 7541 | 8.368939% |
| C | 90106 | 746 | 0.827914% |
| D | 90092 | 5478 | 6.080451% |
Noise dominated data is calculated using 1-second bins in cleaned event files. If a bin has >2000 counts, and if more than 50% of those come from <1% of pixels, then it is considered to be noise-dominated and hence unusable.
| Quadrant | # 1 sec bins | Bins with >0 counts | Bins with >2000 counts | High rate bins dominated by noise | Noise dominated (total time) | Noise dominated (detector-on time) | Marked lightcurve |
|---|---|---|---|---|---|---|---|
| A | 123321 | 90118 | 0 | 0 | 0.00% | 0.00% | 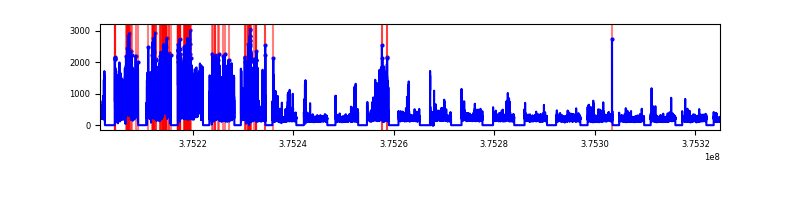 |
| B | 123321 | 90045 | 0 | 0 | 0.00% | 0.00% | 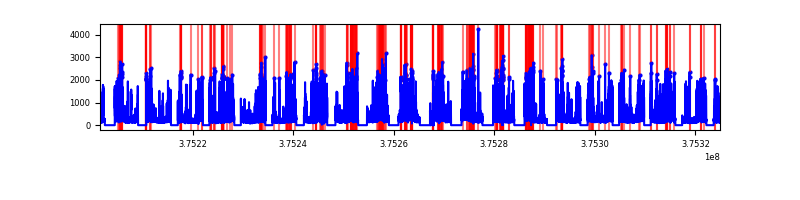 |
| C | 123321 | 90119 | 0 | 0 | 0.00% | 0.00% | 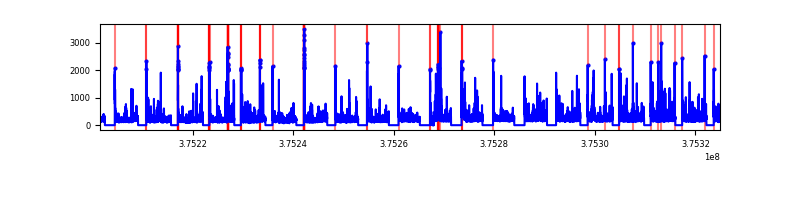 |
| D | 123321 | 90057 | 0 | 0 | 0.00% | 0.00% | 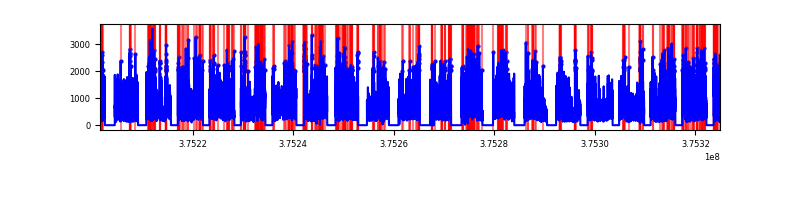 |
Top three noisy pixels from each quadrant. If the there are fewer than three noisy pixels in the level2.evt file, extra rows are filled as -1
| Pixel properties | Quadrant properties | ||||||
|---|---|---|---|---|---|---|---|
| Quadrant | DetID | PixID | Counts | Sigma | Mean | Median | Sigma |
| A | 0 | 29 | 4383 | 9.28 | 1355 | 1276 | 334.8 |
| A | 9 | 19 | 4253 | 8.89 | 1355 | 1276 | 334.8 |
| A | 7 | 110 | 4243 | 8.86 | 1355 | 1276 | 334.8 |
| B | 2 | 9 | 4039 | 11.21 | 1279 | 1224 | 251.2 |
| B | 3 | 80 | 3724 | 9.95 | 1279 | 1224 | 251.2 |
| B | 3 | 17 | 3357 | 8.49 | 1279 | 1224 | 251.2 |
| C | 1 | 81 | 4311 | 8.89 | 1360 | 1284 | 340.6 |
| C | 1 | 80 | 4243 | 8.69 | 1360 | 1284 | 340.6 |
| C | 3 | 187 | 3518 | 6.56 | 1360 | 1284 | 340.6 |
| D | 10 | 189 | 3265 | 6.48 | 1241 | 1135 | 328.4 |
| D | 4 | 160 | 3173 | 6.2 | 1241 | 1135 | 328.4 |
| D | 6 | 38 | 3123 | 6.05 | 1241 | 1135 | 328.4 |
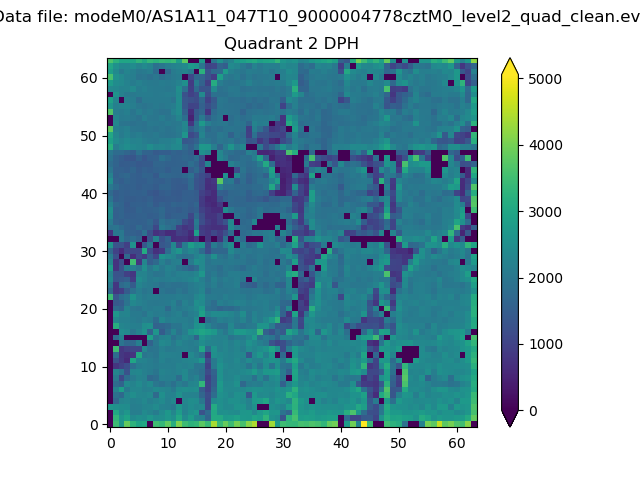
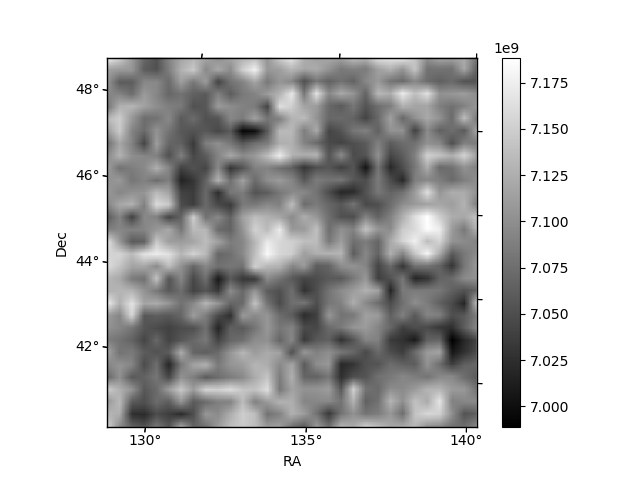
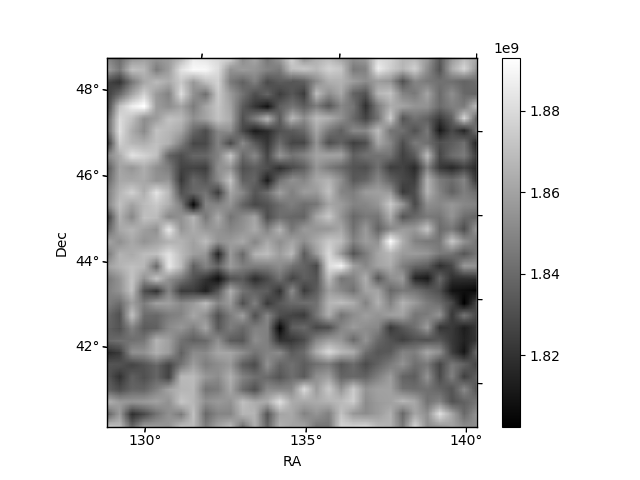
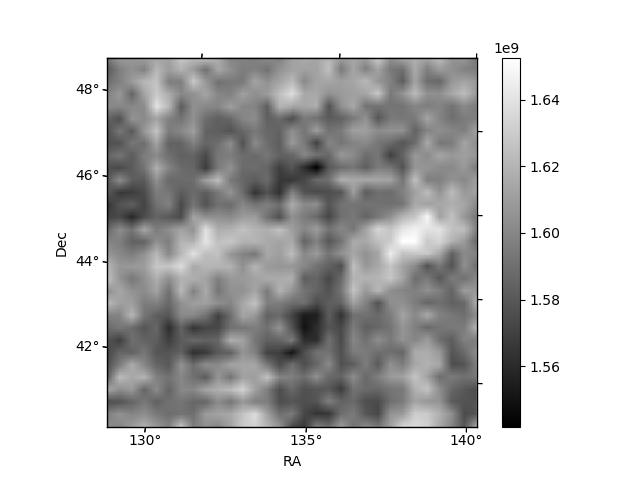
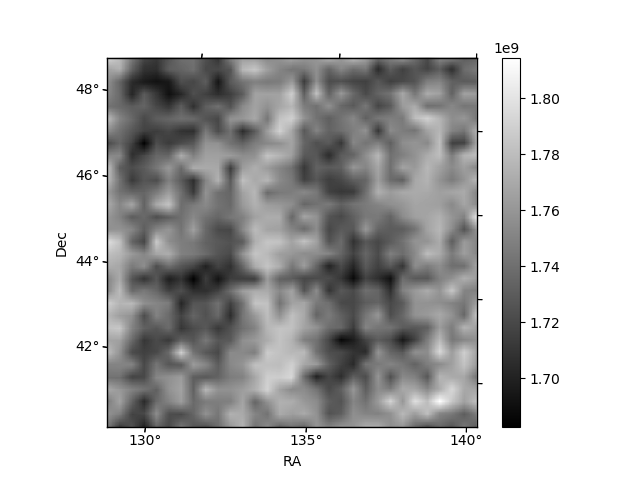
Histogram calculated using DETX and DETY for each event in the final _common_clean file
| Quadrant A | 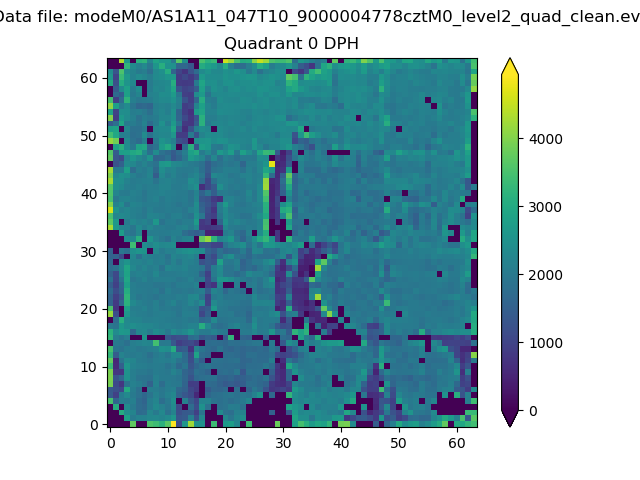 |
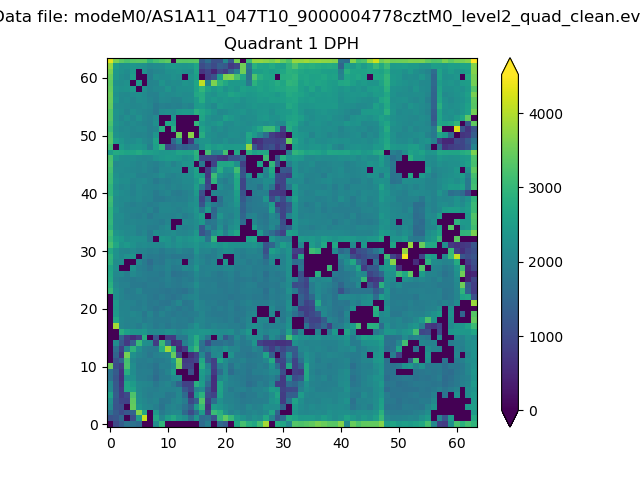 |
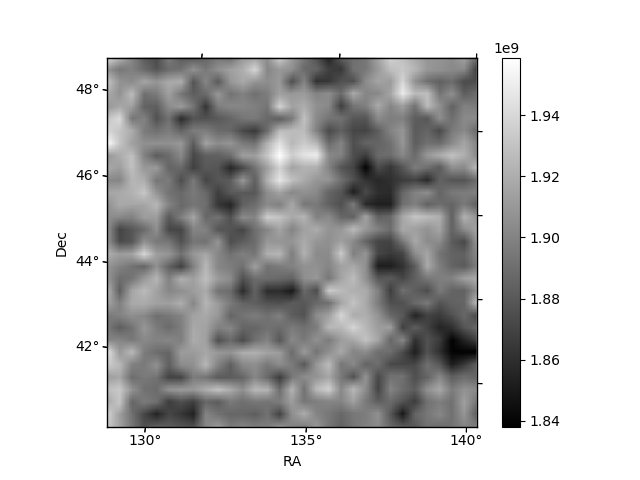
Quadrant B |
|---|---|---|---|
| Quadrant D | 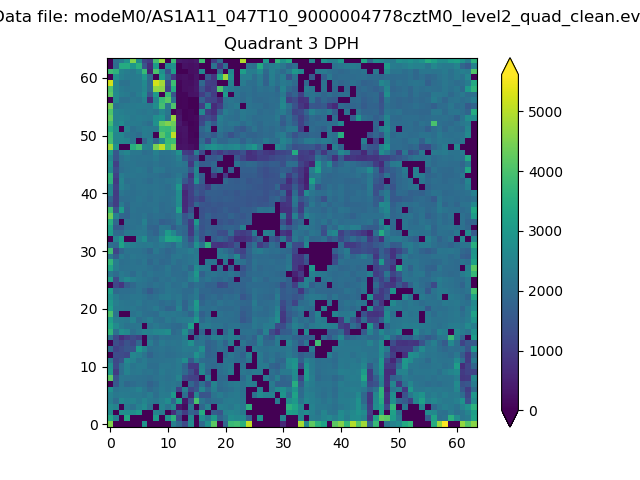 |
 |
Quadrant C |
| Plot type | Count rate plots | Images |
|---|---|---|
| Comparison with Poisson distribution Blue bars denote a histogram of data divided into 1 sec bins. Red curve is a Poisson curve with rate = median count rate of data. |
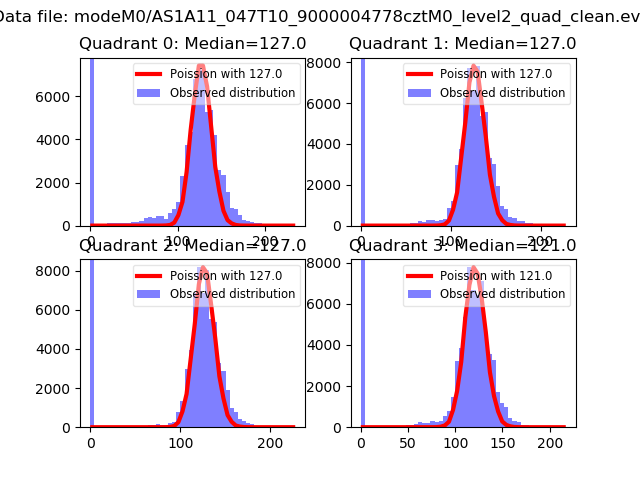 |
 |
| Quadrant-wise count rates Data is divided into 100 sec bins |
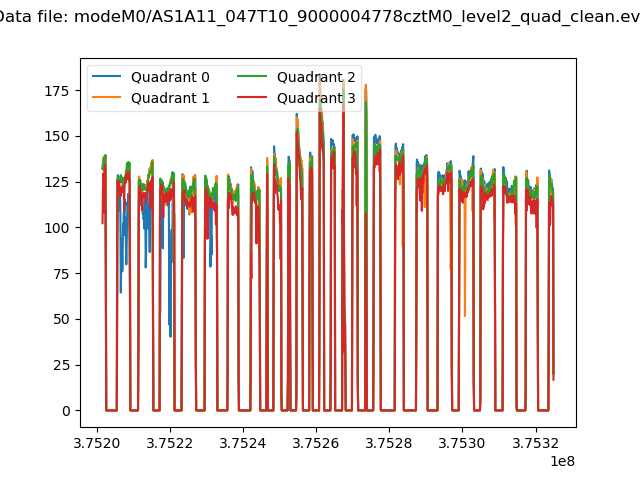 |
|
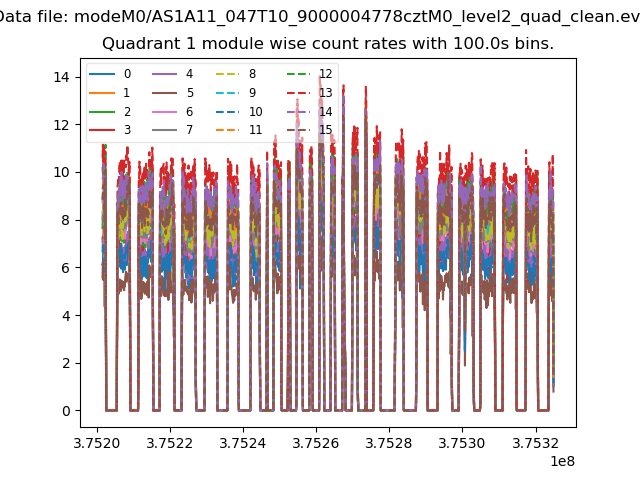
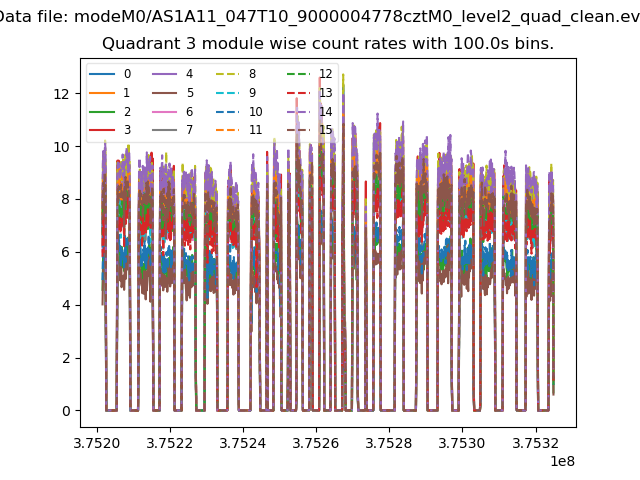
| Module-wise count rates for Quadrant A Data is divided into 100 sec bins |
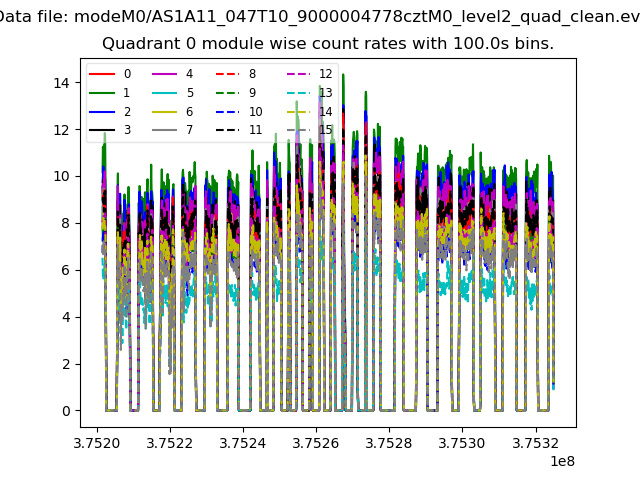 |
 |
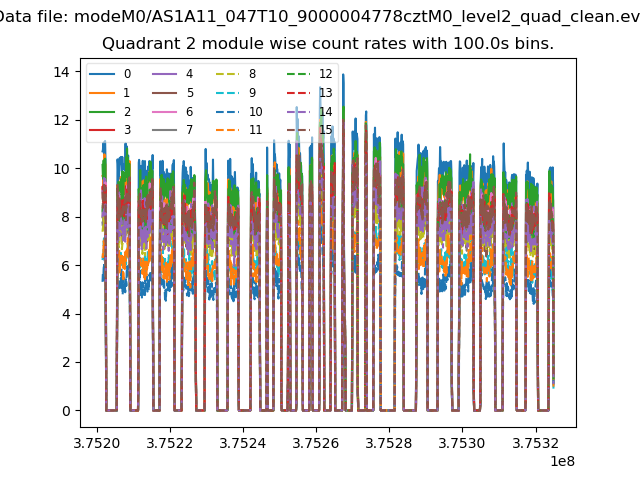
| Module-wise count rates for Quadrant B Data is divided into 100 sec bins |
 |
 |
| Module-wise count rates for Quadrant C Data is divided into 100 sec bins |
 |
 |
| Module-wise count rates for Quadrant D Data is divided into 100 sec bins |
 |
 |
| Parameter | Plot |
|---|---|
| CZT HV Monitor |  |
| D_VDD | 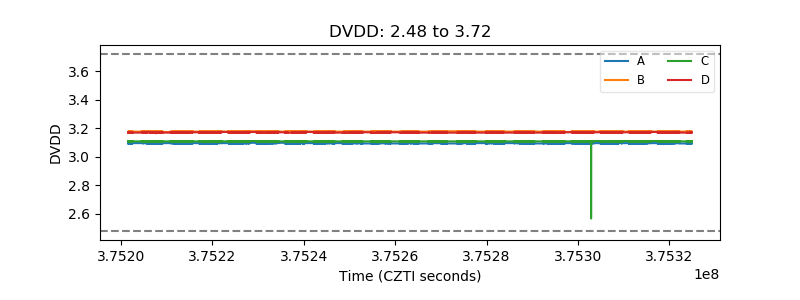 |
| Temperature 1 | 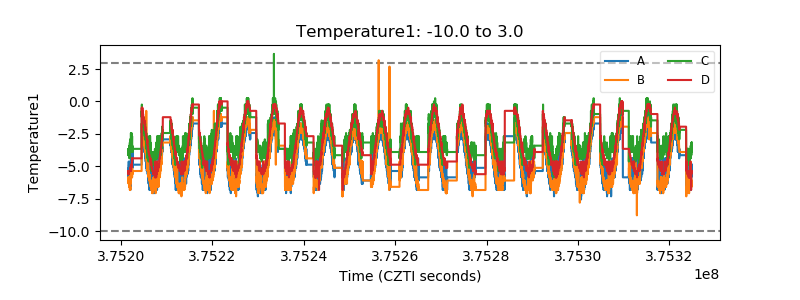 |
| Veto HV Monitor | 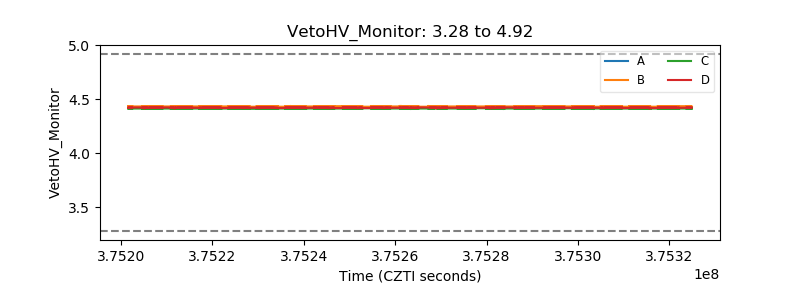 |
| Veto LLD | 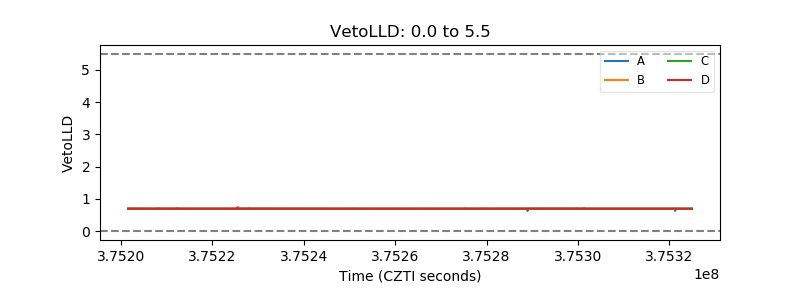 |
| Alpha Counter | 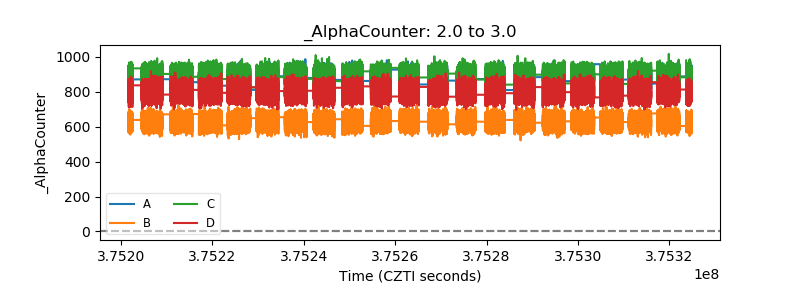 |
| _CPM_Rate | 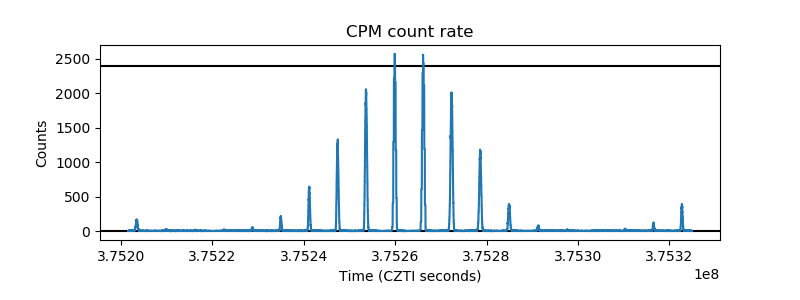 |
| CZT Counter | 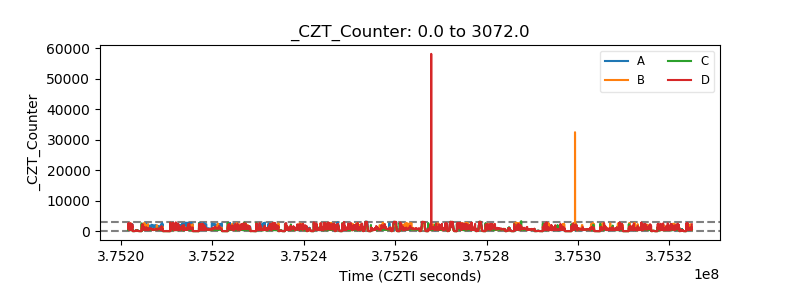 |
| +2.5 Volts monitor | 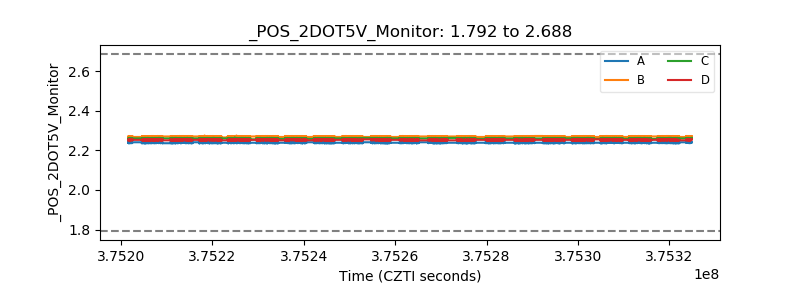 |
| +5 Volts monitor | 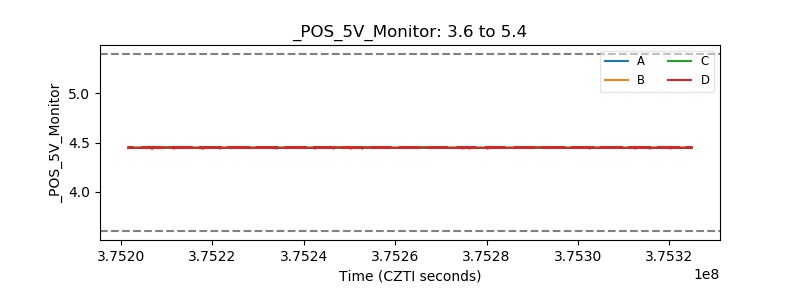 |
| _ROLL_ROT | 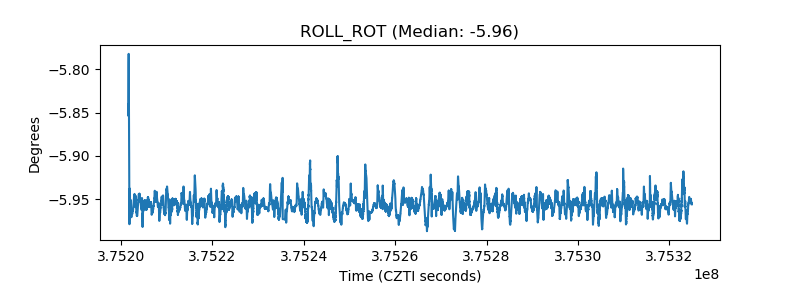 |
| _Roll_DEC | 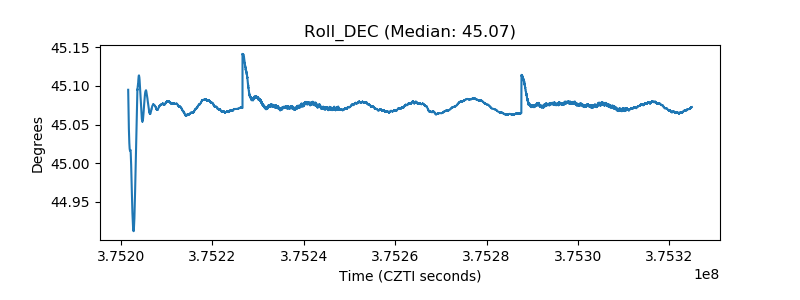 |
| _Roll_RA | 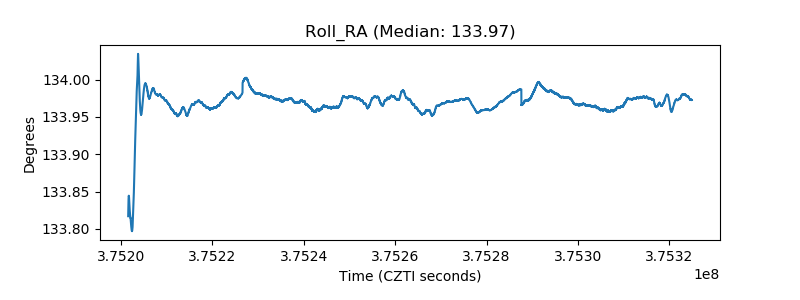 |
| Veto Counter | 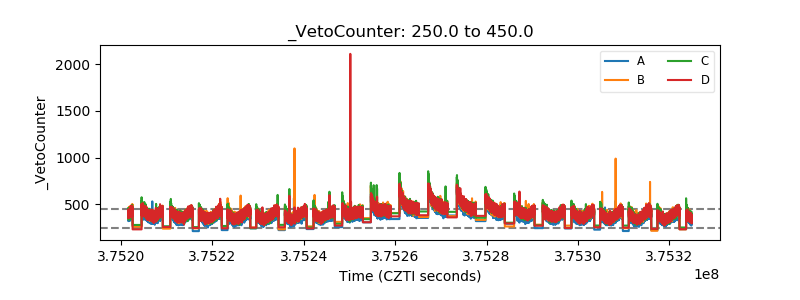 |