| Param | Original file | Final file |
|---|---|---|
| Filename | modeM0/AS1A11_047T10_9000004778_33252cztM0_level2.evt | modeM0/AS1A11_047T10_9000004778_33252cztM0_level2_quad_clean.evt |
| Size (bytes) | 224,107,200 | 21,358,080 |
| Size | 213.7 MB | 20.4 MB |
| Events in quadrant A | 2,241,252 | 129,241 |
| Events in quadrant B | 1,648,240 | 128,376 |
| Events in quadrant C | 990,618 | 130,952 |
| Events in quadrant D | 1,775,999 | 118,962 |
| Mode M0 | |||
|---|---|---|---|
| Quadrant | BADHDUFLAG | Total packets | Discarded packets |
| A | 0 | 8002 | 2 |
| B | 0 | 6146 | 1 |
| C | 0 | 4136 | 1 |
| D | 0 | 6523 | 1 |
| Mode SS | |||
|---|---|---|---|
| Quadrant | BADHDUFLAG | Total packets | Discarded packets |
| A | 0 | 42 | 0 |
| B | 0 | 42 | 0 |
| C | 0 | 42 | 0 |
| D | 0 | 42 | 0 |
| Mode M9 | |||
|---|---|---|---|
| Quadrant | BADHDUFLAG | Total packets | Discarded packets |
| A | 0 | 19 | 0 |
| B | 0 | 19 | 0 |
| C | 0 | 19 | 0 |
| D | 0 | 19 | 0 |
| Quadrant | Total seconds | Saturated seconds | Saturation percentage |
|---|---|---|---|
| A | 1894 | 555 | 29.303062% |
| B | 1894 | 275 | 14.519535% |
| C | 1894 | 32 | 1.689546% |
| D | 1894 | 151 | 7.972545% |
Noise dominated data is calculated using 1-second bins in cleaned event files. If a bin has >2000 counts, and if more than 50% of those come from <1% of pixels, then it is considered to be noise-dominated and hence unusable.
| Quadrant | # 1 sec bins | Bins with >0 counts | Bins with >2000 counts | High rate bins dominated by noise | Noise dominated (total time) | Noise dominated (detector-on time) | Marked lightcurve |
|---|---|---|---|---|---|---|---|
| A | 3867 | 1895 | 332 | 332 | 8.59% | 17.52% | 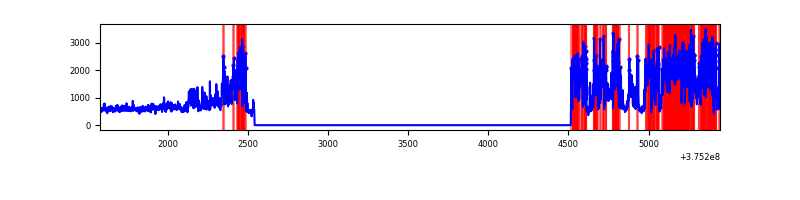 |
| B | 3867 | 1895 | 201 | 201 | 5.20% | 10.61% | 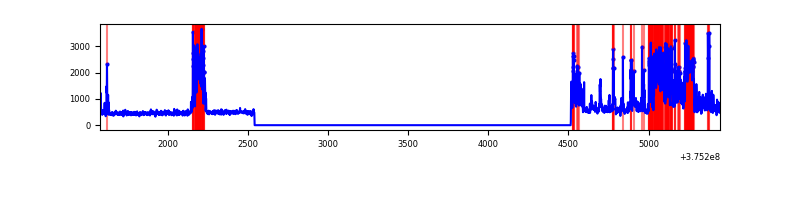 |
| C | 3867 | 1895 | 26 | 26 | 0.67% | 1.37% | 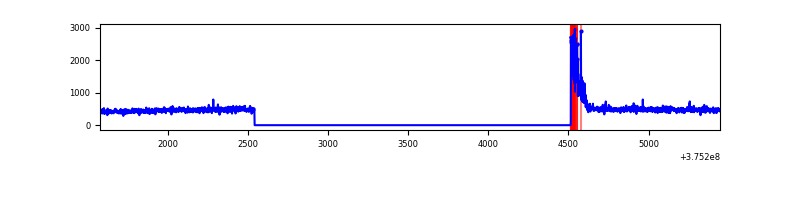 |
| D | 3867 | 1895 | 133 | 133 | 3.44% | 7.02% | 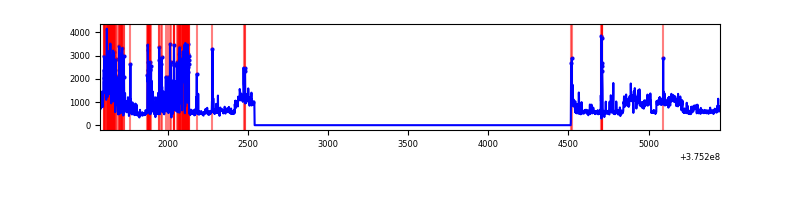 |
Top three noisy pixels from each quadrant. If the there are fewer than three noisy pixels in the level2.evt file, extra rows are filled as -1
| Pixel properties | Quadrant properties | ||||||
|---|---|---|---|---|---|---|---|
| Quadrant | DetID | PixID | Counts | Sigma | Mean | Median | Sigma |
| A | 15 | 169 | 1440594 | 33636.76 | 205 | 201 | 42.8 |
| A | 13 | 6 | 3140 | 68.63 | 205 | 201 | 42.8 |
| A | 13 | 254 | 2911 | 63.29 | 205 | 201 | 42.8 |
| B | 5 | 172 | 690250 | 16308.9 | 216 | 211 | 42.3 |
| B | 5 | 173 | 46782 | 1100.69 | 216 | 211 | 42.3 |
| B | 4 | 170 | 22233 | 520.48 | 216 | 211 | 42.3 |
| C | 0 | 10 | 117041 | 2228.99 | 221 | 222 | 52.4 |
| C | 14 | 254 | 5010 | 91.36 | 221 | 222 | 52.4 |
| C | 14 | 67 | 1642 | 27.09 | 221 | 222 | 52.4 |
| D | 2 | 250 | 462611 | 7759.7 | 218 | 212 | 59.6 |
| D | 8 | 195 | 386072 | 6475.27 | 218 | 212 | 59.6 |
| D | 13 | 249 | 38745 | 646.64 | 218 | 212 | 59.6 |
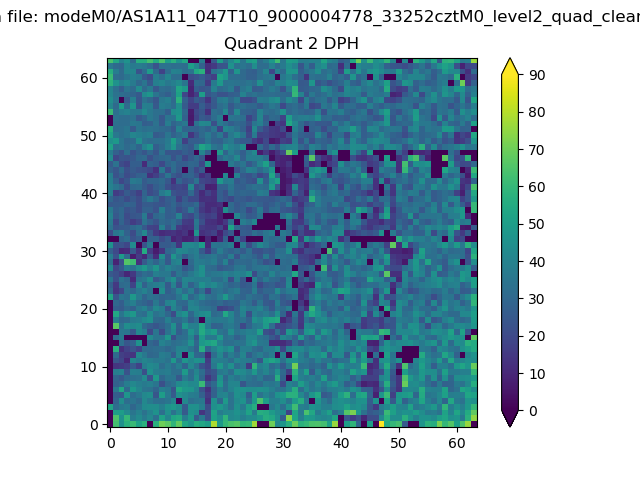
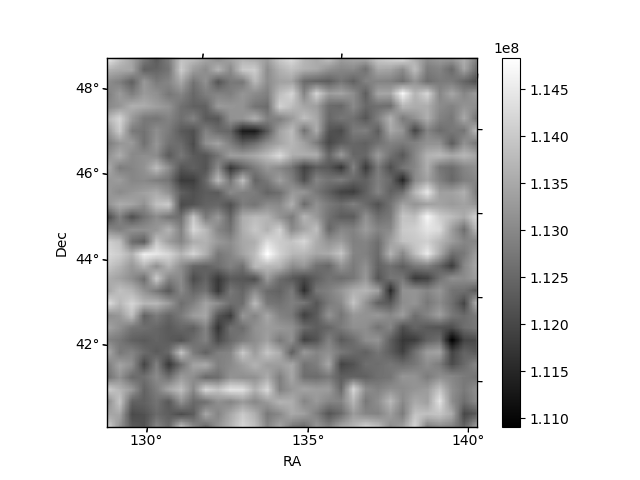
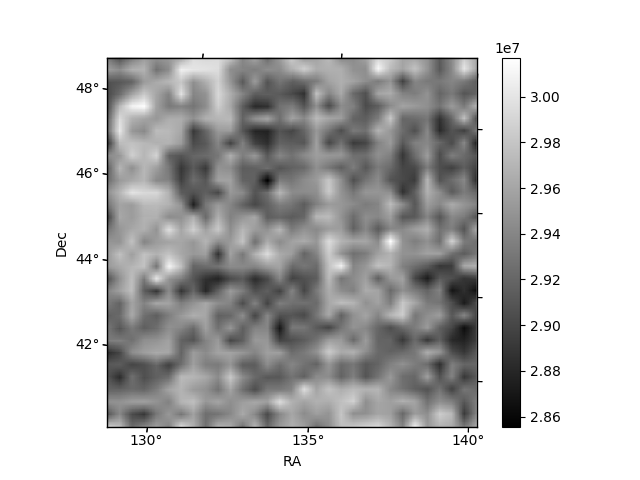
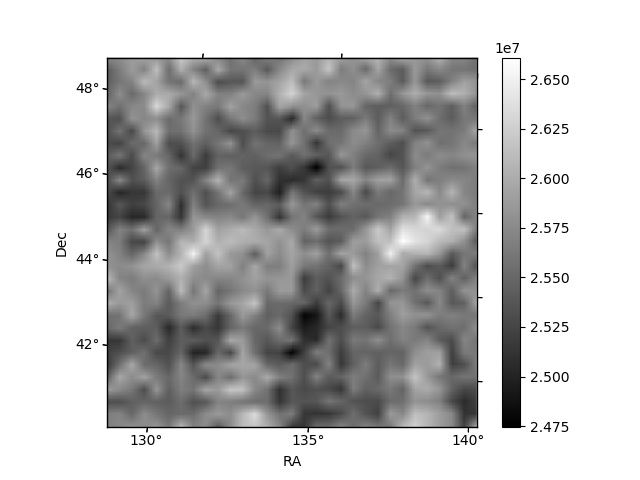
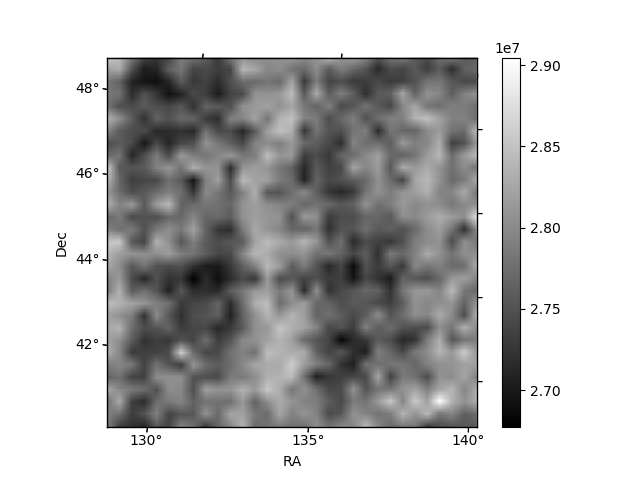
Histogram calculated using DETX and DETY for each event in the final _common_clean file
| Quadrant A | 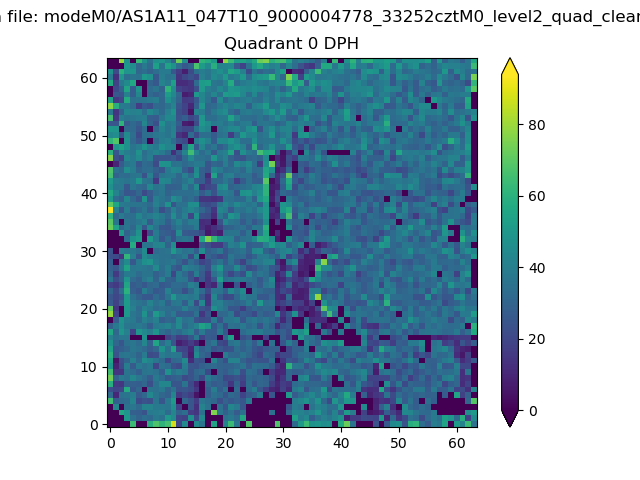 |
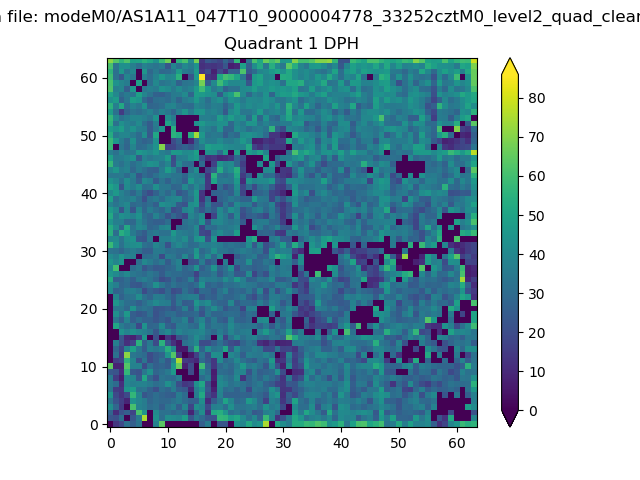 |
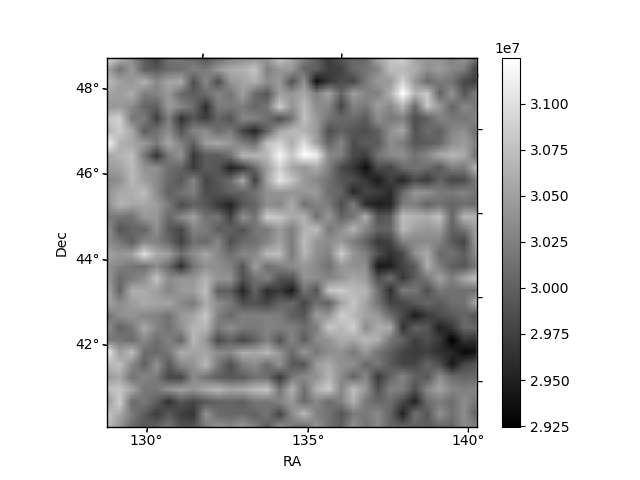
Quadrant B |
|---|---|---|---|
| Quadrant D | 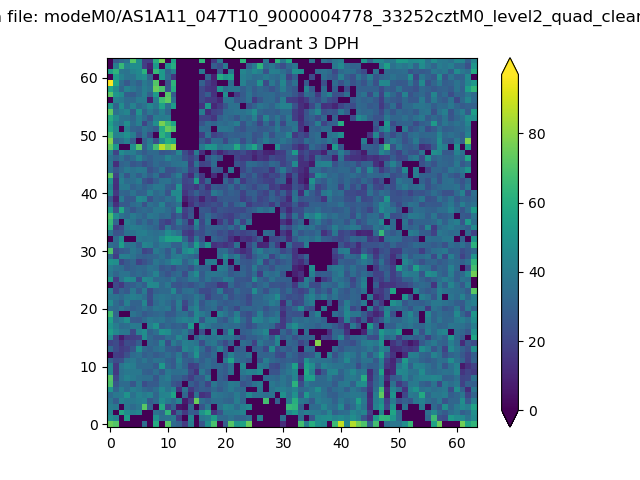 |
 |
Quadrant C |
| Plot type | Count rate plots | Images |
|---|---|---|
| Comparison with Poisson distribution Blue bars denote a histogram of data divided into 1 sec bins. Red curve is a Poisson curve with rate = median count rate of data. |
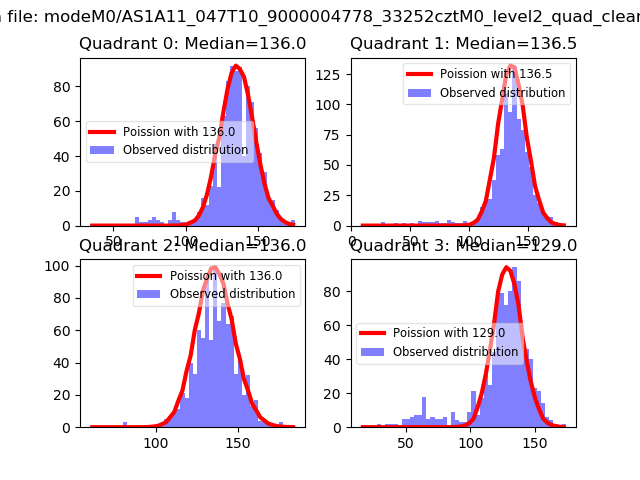 |
 |
| Quadrant-wise count rates Data is divided into 100 sec bins |
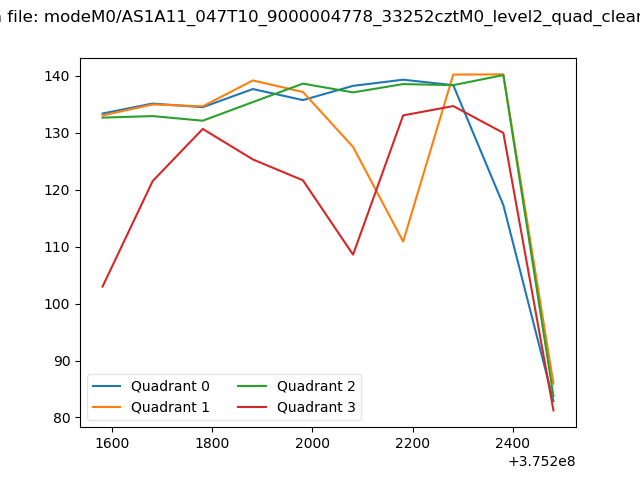 |
|
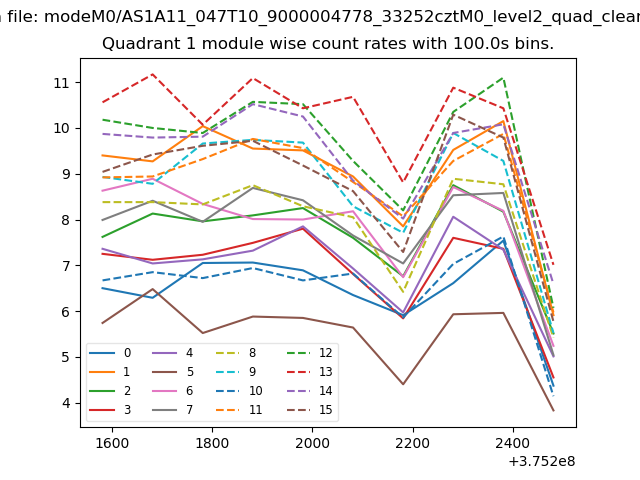
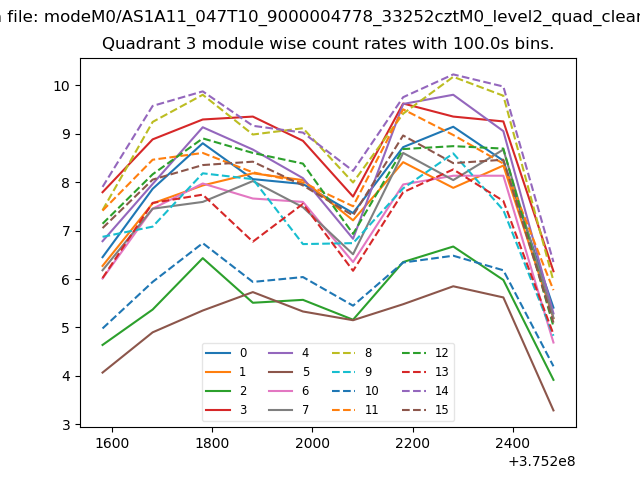
| Module-wise count rates for Quadrant A Data is divided into 100 sec bins |
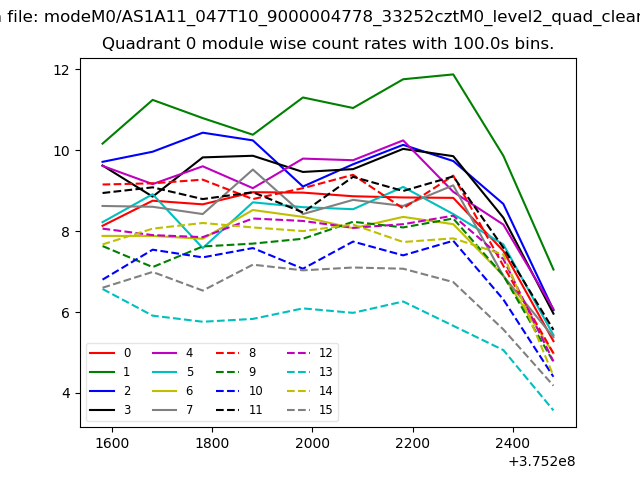 |
 |
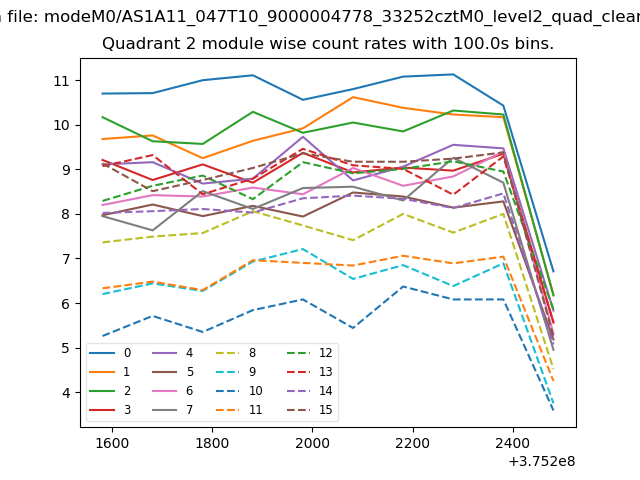
| Module-wise count rates for Quadrant B Data is divided into 100 sec bins |
 |
 |
| Module-wise count rates for Quadrant C Data is divided into 100 sec bins |
 |
 |
| Module-wise count rates for Quadrant D Data is divided into 100 sec bins |
 |
 |
| Parameter | Plot |
|---|---|
| CZT HV Monitor | 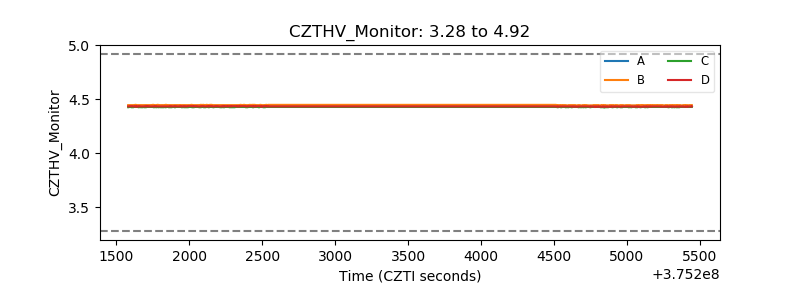 |
| D_VDD | 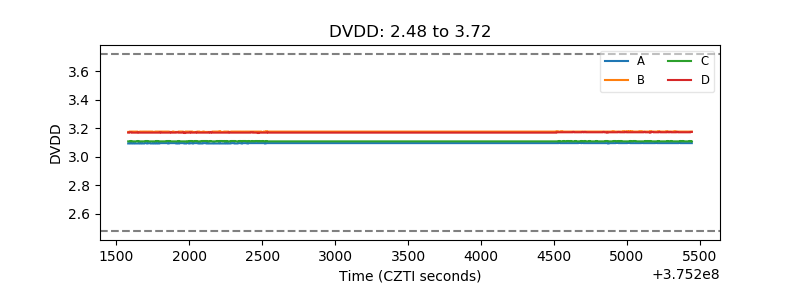 |
| Temperature 1 | 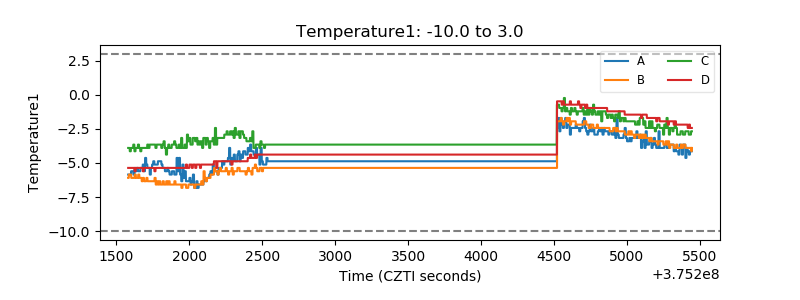 |
| Veto HV Monitor | 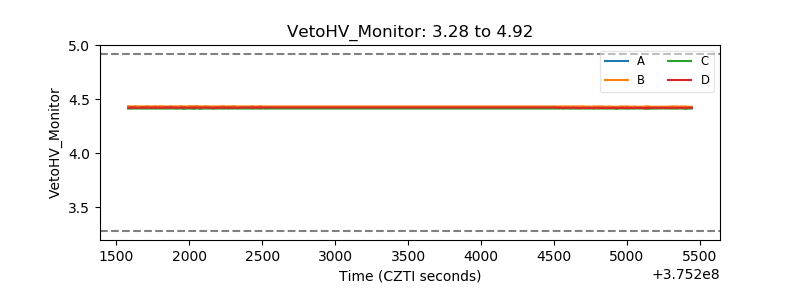 |
| Veto LLD | 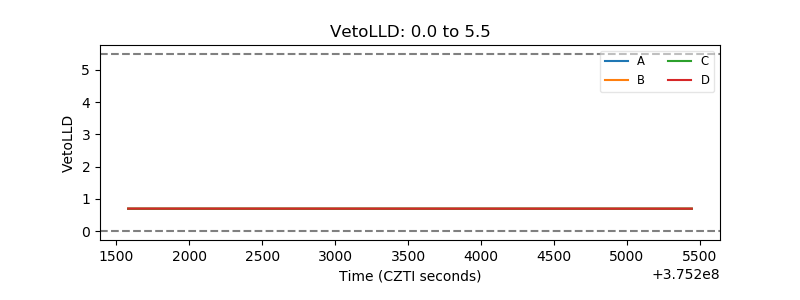 |
| Alpha Counter | 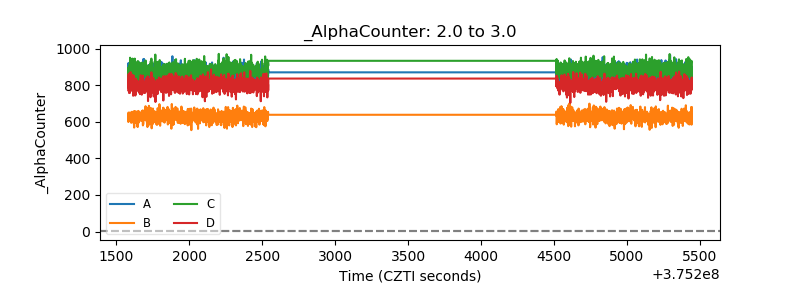 |
| _CPM_Rate | 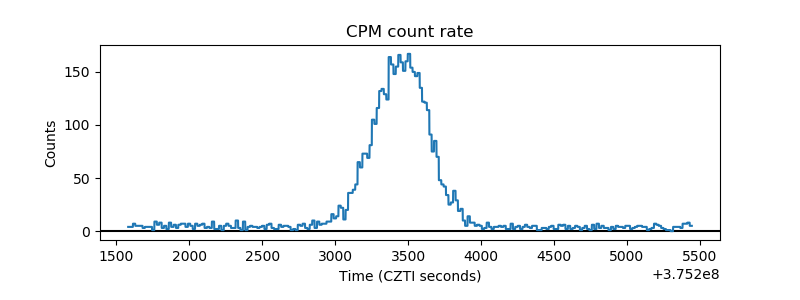 |
| CZT Counter | 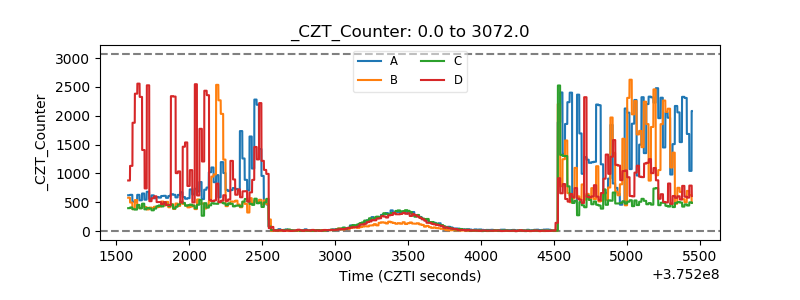 |
| +2.5 Volts monitor |  |
| +5 Volts monitor |  |
| _ROLL_ROT | 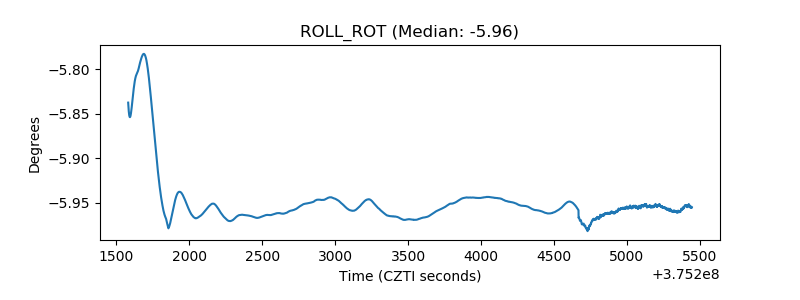 |
| _Roll_DEC | 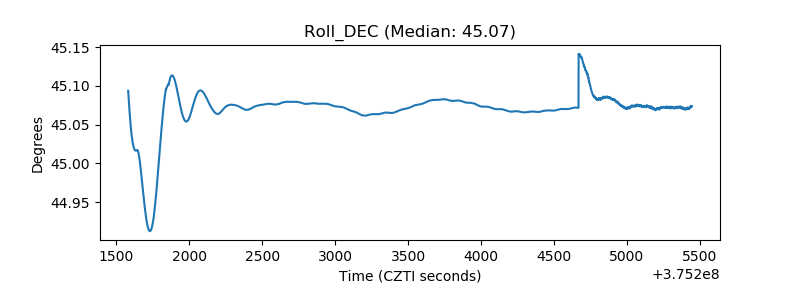 |
| _Roll_RA | 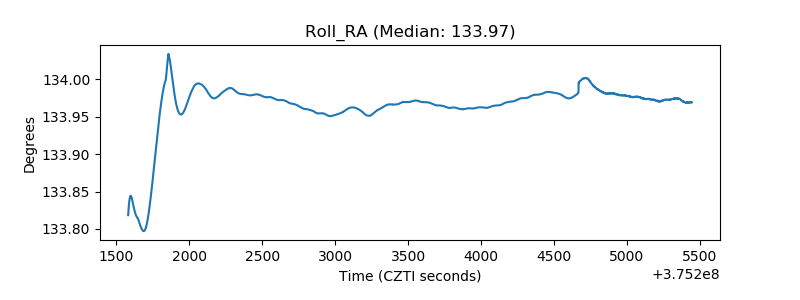 |
| Veto Counter | 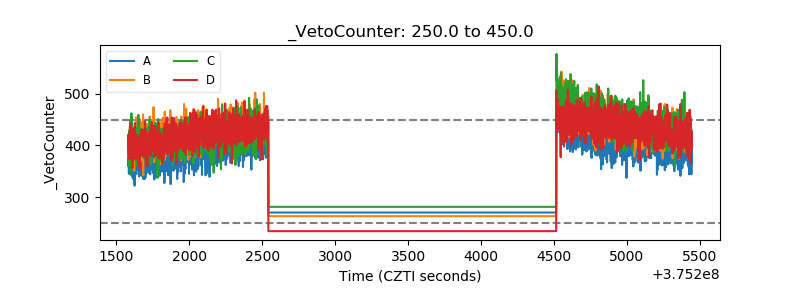 |