| Param | Original file | Final file |
|---|---|---|
| Filename | modeM0/AS1A11_047T10_9000004778_33253cztM0_level2.evt | modeM0/AS1A11_047T10_9000004778_33253cztM0_level2_quad_clean.evt |
| Size (bytes) | 646,050,240 | 69,975,360 |
| Size | 616.1 MB | 66.7 MB |
| Events in quadrant A | 8,554,411 | 369,012 |
| Events in quadrant B | 3,819,940 | 461,309 |
| Events in quadrant C | 2,637,649 | 465,490 |
| Events in quadrant D | 4,191,568 | 447,826 |
| Mode M0 | |||
|---|---|---|---|
| Quadrant | BADHDUFLAG | Total packets | Discarded packets |
| A | 0 | 29176 | 2 |
| B | 0 | 14993 | 1 |
| C | 0 | 11371 | 1 |
| D | 0 | 16048 | 1 |
| Mode SS | |||
|---|---|---|---|
| Quadrant | BADHDUFLAG | Total packets | Discarded packets |
| A | 0 | 110 | 0 |
| B | 0 | 110 | 0 |
| C | 0 | 110 | 0 |
| D | 0 | 110 | 0 |
| Mode M9 | |||
|---|---|---|---|
| Quadrant | BADHDUFLAG | Total packets | Discarded packets |
| A | 0 | 16 | 0 |
| B | 0 | 16 | 0 |
| C | 0 | 16 | 0 |
| D | 0 | 16 | 0 |
| Quadrant | Total seconds | Saturated seconds | Saturation percentage |
|---|---|---|---|
| A | 5341 | 2763 | 51.731885% |
| B | 5341 | 384 | 7.189665% |
| C | 5341 | 53 | 0.992324% |
| D | 5341 | 239 | 4.474817% |
Noise dominated data is calculated using 1-second bins in cleaned event files. If a bin has >2000 counts, and if more than 50% of those come from <1% of pixels, then it is considered to be noise-dominated and hence unusable.
| Quadrant | # 1 sec bins | Bins with >0 counts | Bins with >2000 counts | High rate bins dominated by noise | Noise dominated (total time) | Noise dominated (detector-on time) | Marked lightcurve |
|---|---|---|---|---|---|---|---|
| A | 6983 | 5340 | 1317 | 1317 | 18.86% | 24.66% | 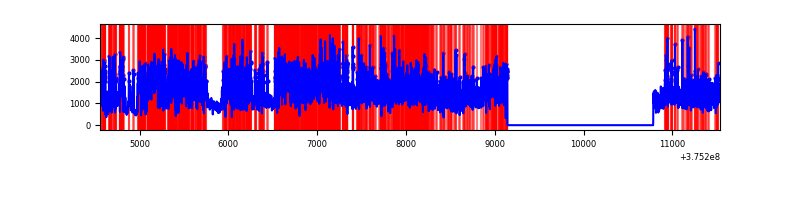 |
| B | 6984 | 5342 | 266 | 266 | 3.81% | 4.98% | 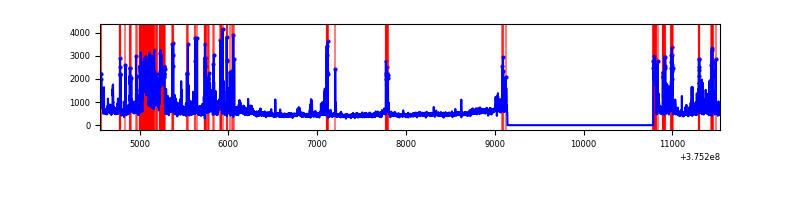 |
| C | 6984 | 5342 | 40 | 40 | 0.57% | 0.75% | 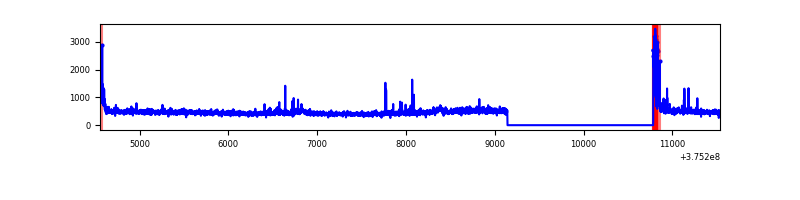 |
| D | 6984 | 5342 | 189 | 189 | 2.71% | 3.54% | 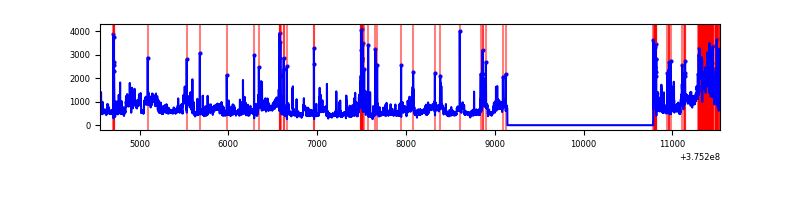 |
Top three noisy pixels from each quadrant. If the there are fewer than three noisy pixels in the level2.evt file, extra rows are filled as -1
| Pixel properties | Quadrant properties | ||||||
|---|---|---|---|---|---|---|---|
| Quadrant | DetID | PixID | Counts | Sigma | Mean | Median | Sigma |
| A | 15 | 169 | 6565974 | 64154.51 | 509 | 498 | 102.3 |
| A | 13 | 6 | 13892 | 130.88 | 509 | 498 | 102.3 |
| A | 13 | 254 | 7837 | 71.71 | 509 | 498 | 102.3 |
| B | 5 | 172 | 1043504 | 9109.19 | 602 | 587 | 114.5 |
| B | 5 | 173 | 151859 | 1321.26 | 602 | 587 | 114.5 |
| B | 0 | 219 | 106917 | 928.72 | 602 | 587 | 114.5 |
| C | 0 | 10 | 155418 | 1110.64 | 602 | 606 | 139.4 |
| C | 14 | 67 | 54044 | 383.37 | 602 | 606 | 139.4 |
| C | 14 | 254 | 25867 | 181.23 | 602 | 606 | 139.4 |
| D | 8 | 195 | 972892 | 6233.76 | 597 | 582 | 156.0 |
| D | 7 | 204 | 177003 | 1131.09 | 597 | 582 | 156.0 |
| D | 2 | 250 | 161418 | 1031.17 | 597 | 582 | 156.0 |
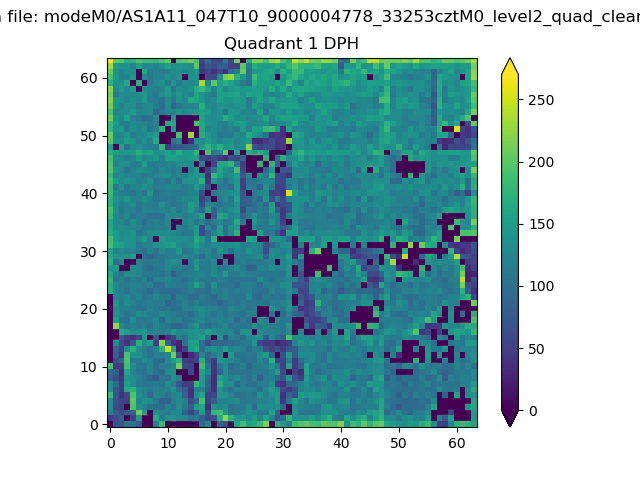
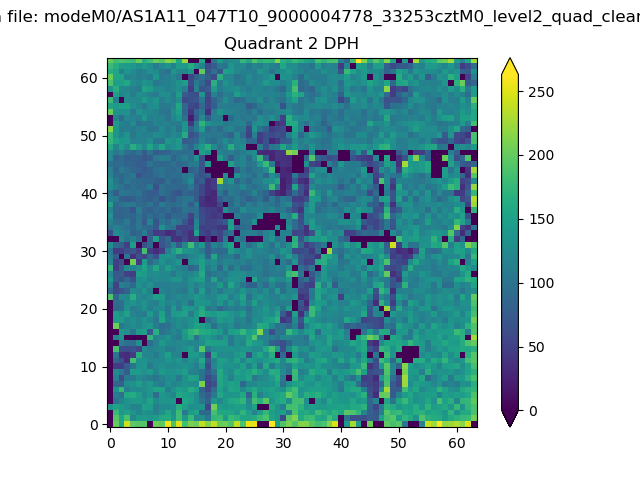
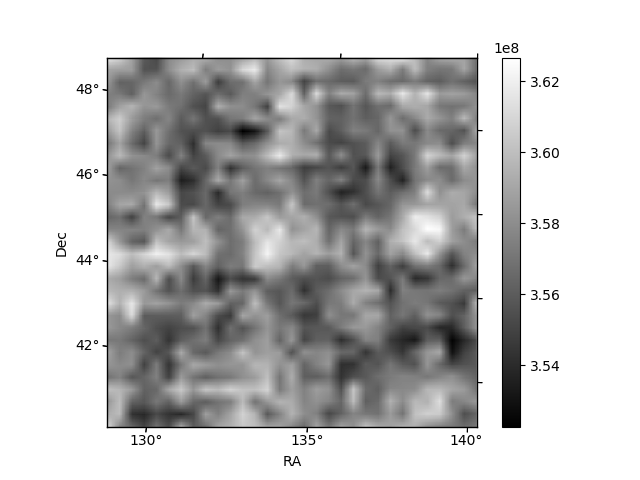
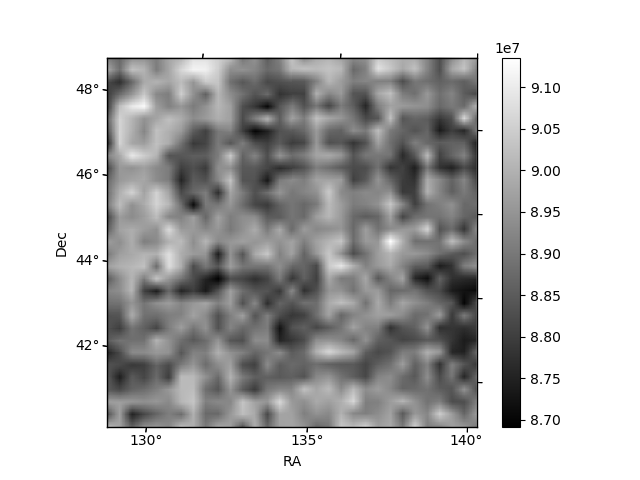
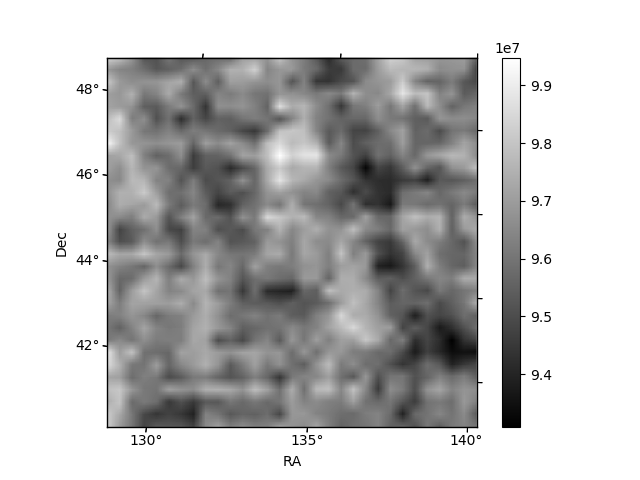
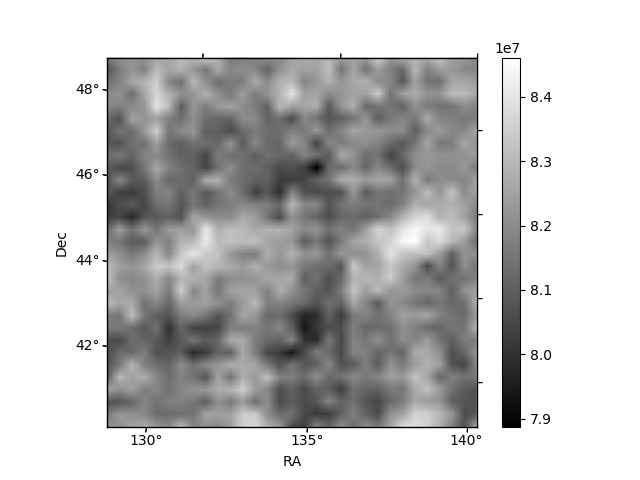
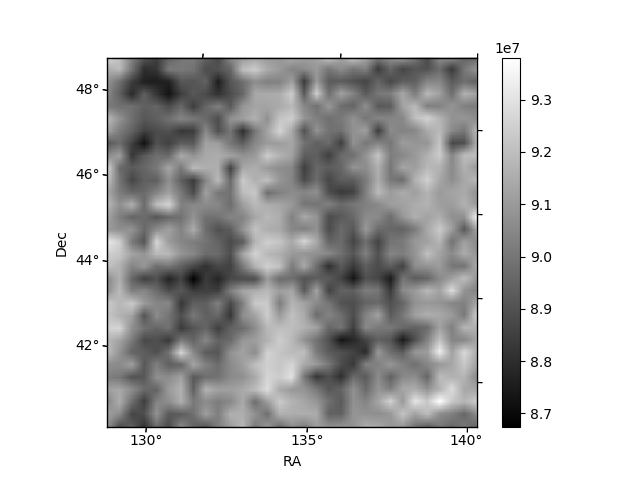
Histogram calculated using DETX and DETY for each event in the final _common_clean file
| Quadrant A |  |
 |
Quadrant B |
|---|---|---|---|
| Quadrant D | 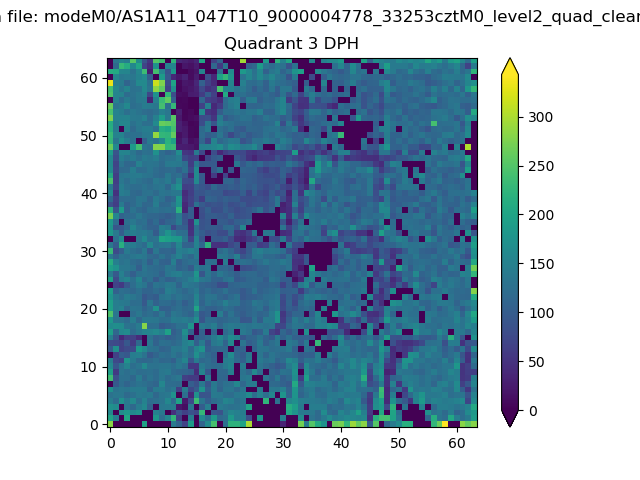 |
 |
Quadrant C |
| Plot type | Count rate plots | Images |
|---|---|---|
| Comparison with Poisson distribution Blue bars denote a histogram of data divided into 1 sec bins. Red curve is a Poisson curve with rate = median count rate of data. |
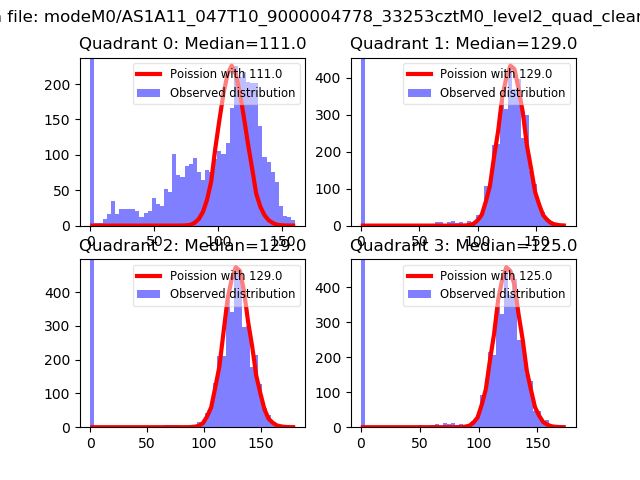 |
 |
| Quadrant-wise count rates Data is divided into 100 sec bins |
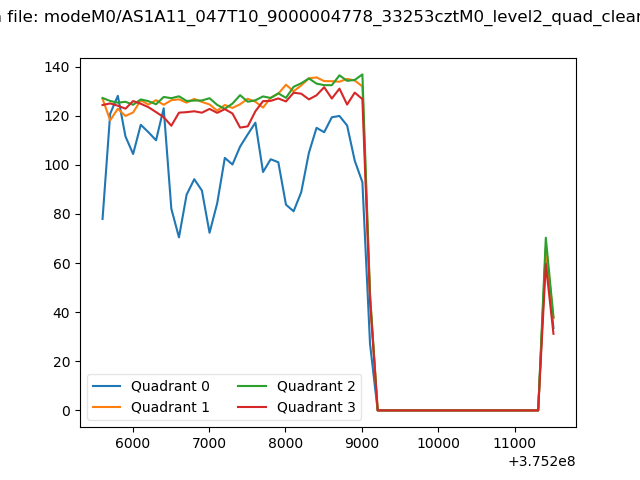 |
|
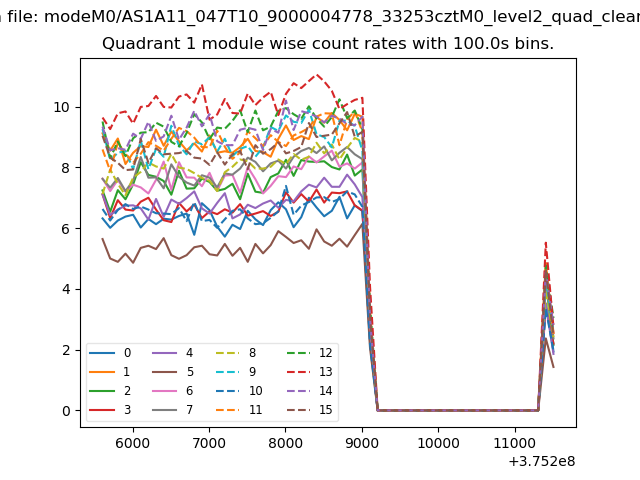
| Module-wise count rates for Quadrant A Data is divided into 100 sec bins |
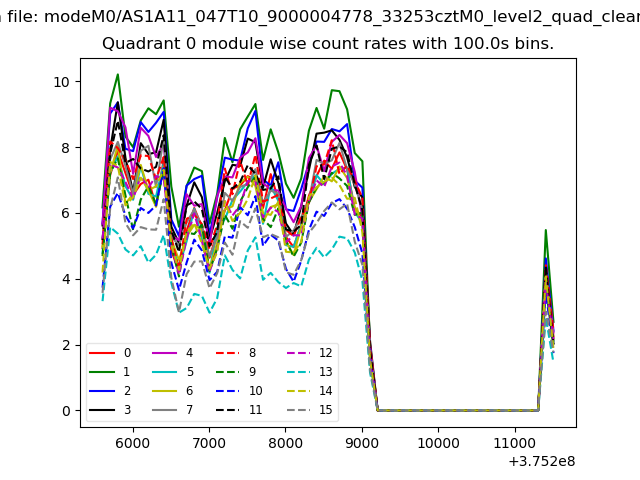 |
 |
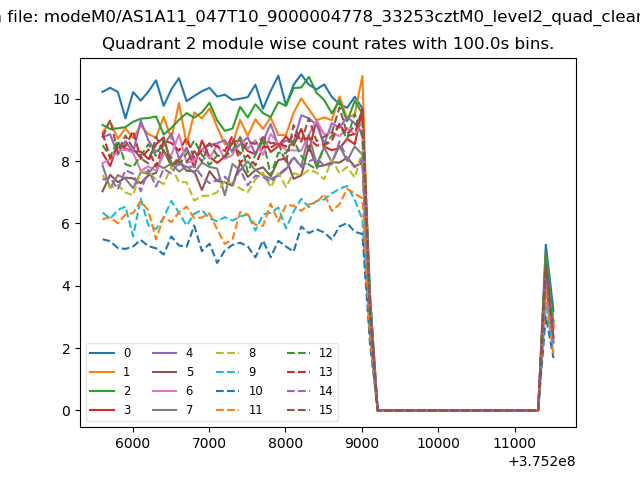
| Module-wise count rates for Quadrant B Data is divided into 100 sec bins |
 |
 |
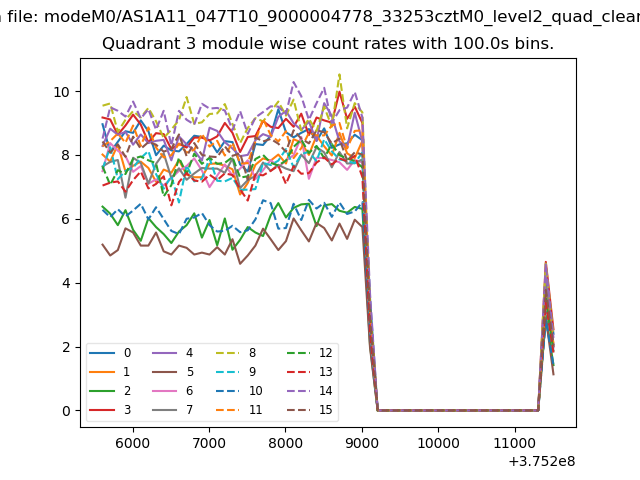
| Module-wise count rates for Quadrant C Data is divided into 100 sec bins |
 |
 |
| Module-wise count rates for Quadrant D Data is divided into 100 sec bins |
 |
 |
| Parameter | Plot |
|---|---|
| CZT HV Monitor | 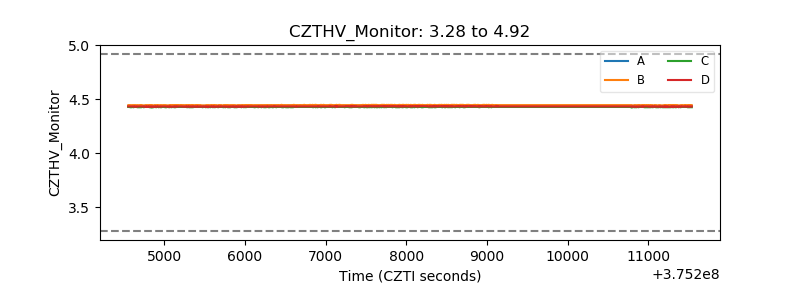 |
| D_VDD | 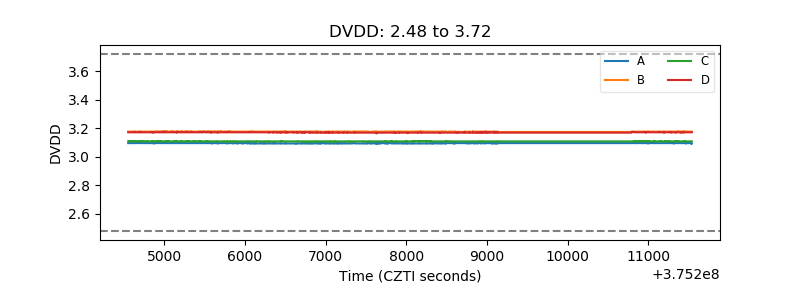 |
| Temperature 1 |  |
| Veto HV Monitor |  |
| Veto LLD | 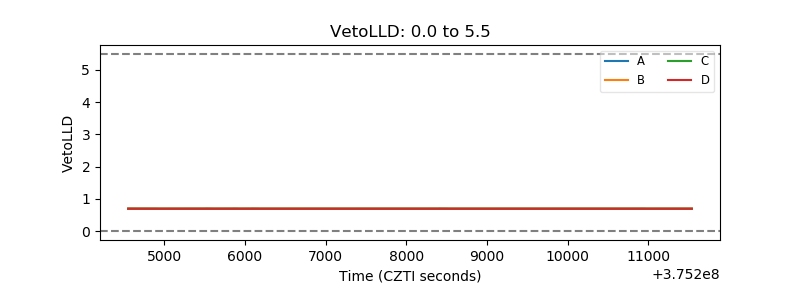 |
| Alpha Counter | 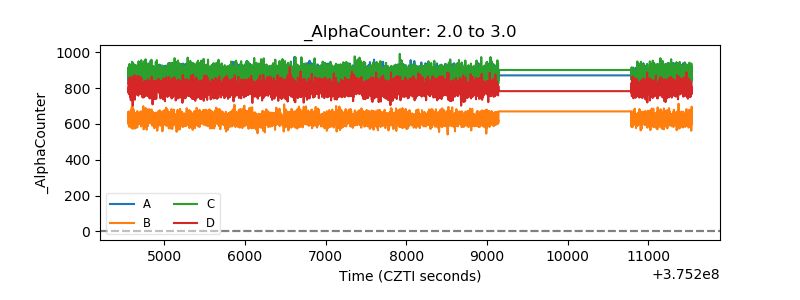 |
| _CPM_Rate | 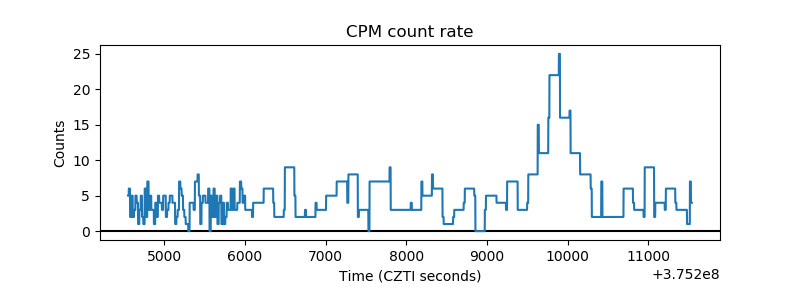 |
| CZT Counter | 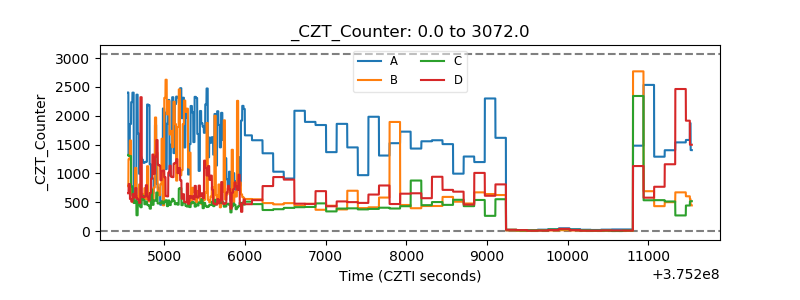 |
| +2.5 Volts monitor | 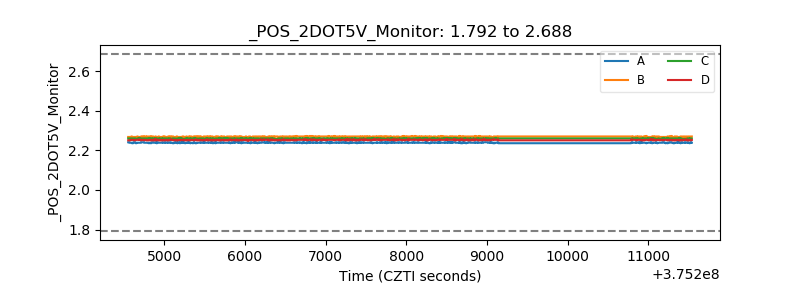 |
| +5 Volts monitor |  |
| _ROLL_ROT | 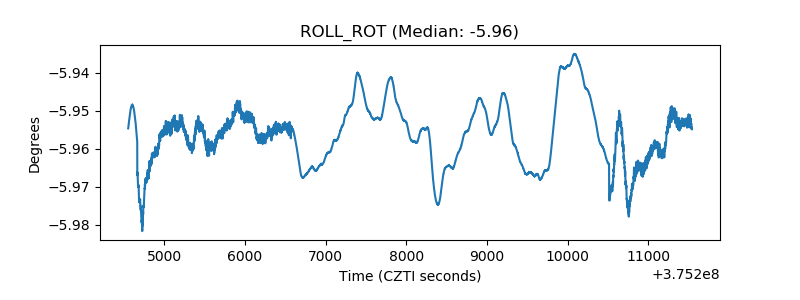 |
| _Roll_DEC | 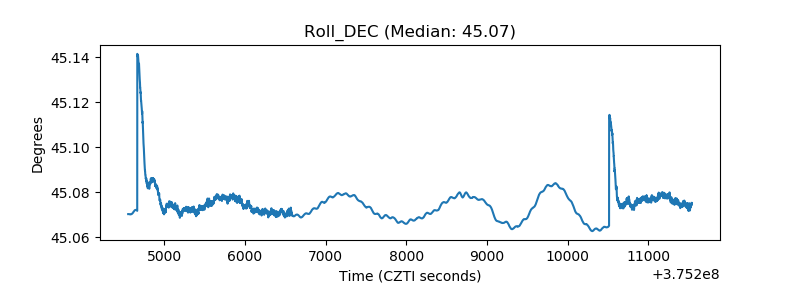 |
| _Roll_RA | 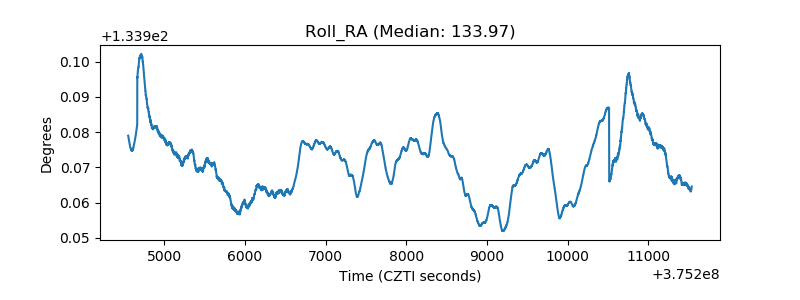 |
| Veto Counter | 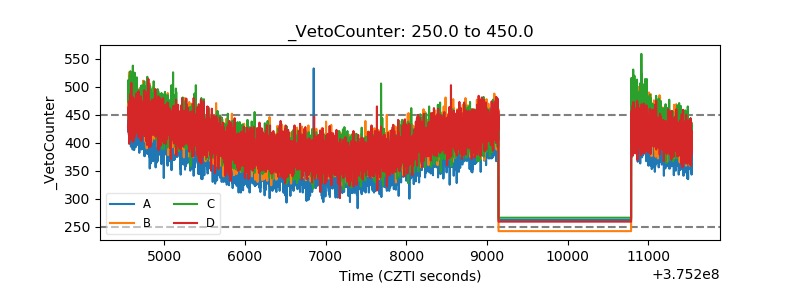 |