| Param | Original file | Final file |
|---|---|---|
| Filename | modeM0/AS1A11_047T10_9000004778_33254cztM0_level2.evt | modeM0/AS1A11_047T10_9000004778_33254cztM0_level2_quad_clean.evt |
| Size (bytes) | 697,691,520 | 86,152,320 |
| Size | 665.4 MB | 82.2 MB |
| Events in quadrant A | 8,710,705 | 500,668 |
| Events in quadrant B | 3,665,233 | 576,813 |
| Events in quadrant C | 2,942,388 | 577,372 |
| Events in quadrant D | 5,421,428 | 549,644 |
| Mode M0 | |||
|---|---|---|---|
| Quadrant | BADHDUFLAG | Total packets | Discarded packets |
| A | 0 | 29931 | 3 |
| B | 0 | 14729 | 2 |
| C | 0 | 12565 | 2 |
| D | 0 | 19977 | 2 |
| Mode SS | |||
|---|---|---|---|
| Quadrant | BADHDUFLAG | Total packets | Discarded packets |
| A | 0 | 118 | 0 |
| B | 0 | 118 | 0 |
| C | 0 | 118 | 0 |
| D | 0 | 118 | 0 |
| Mode M9 | |||
|---|---|---|---|
| Quadrant | BADHDUFLAG | Total packets | Discarded packets |
| A | 0 | 29 | 0 |
| B | 0 | 29 | 0 |
| C | 0 | 29 | 0 |
| D | 0 | 29 | 0 |
| Quadrant | Total seconds | Saturated seconds | Saturation percentage |
|---|---|---|---|
| A | 5771 | 2254 | 39.057356% |
| B | 5771 | 209 | 3.621556% |
| C | 5771 | 92 | 1.594178% |
| D | 5771 | 351 | 6.082135% |
Noise dominated data is calculated using 1-second bins in cleaned event files. If a bin has >2000 counts, and if more than 50% of those come from <1% of pixels, then it is considered to be noise-dominated and hence unusable.
| Quadrant | # 1 sec bins | Bins with >0 counts | Bins with >2000 counts | High rate bins dominated by noise | Noise dominated (total time) | Noise dominated (detector-on time) | Marked lightcurve |
|---|---|---|---|---|---|---|---|
| A | 7144 | 5772 | 1226 | 1226 | 17.16% | 21.24% | 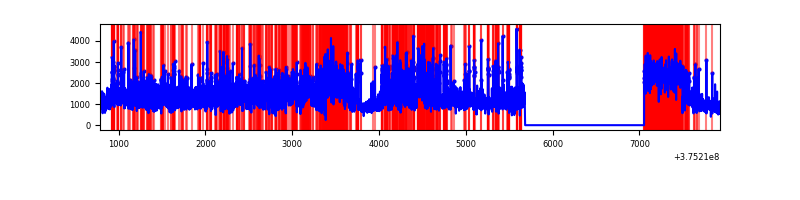 |
| B | 7144 | 5772 | 124 | 124 | 1.74% | 2.15% | 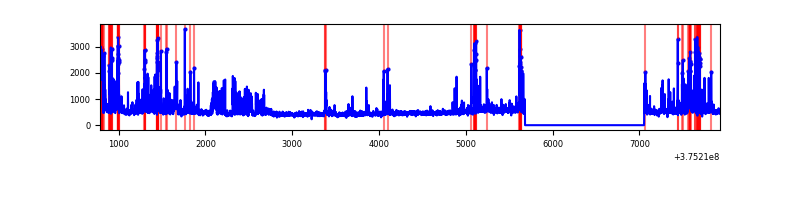 |
| C | 7144 | 5772 | 74 | 74 | 1.04% | 1.28% | 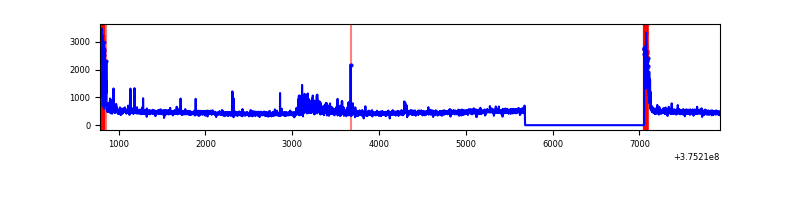 |
| D | 7144 | 5772 | 297 | 297 | 4.16% | 5.15% | 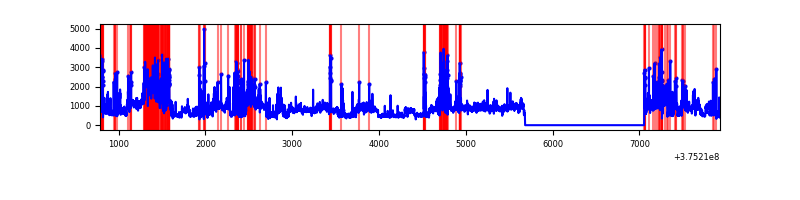 |
Top three noisy pixels from each quadrant. If the there are fewer than three noisy pixels in the level2.evt file, extra rows are filled as -1
| Pixel properties | Quadrant properties | ||||||
|---|---|---|---|---|---|---|---|
| Quadrant | DetID | PixID | Counts | Sigma | Mean | Median | Sigma |
| A | 15 | 169 | 6462098 | 55463.53 | 577 | 566 | 116.5 |
| A | 13 | 6 | 11718 | 95.72 | 577 | 566 | 116.5 |
| A | 13 | 254 | 8928 | 71.78 | 577 | 566 | 116.5 |
| B | 5 | 172 | 575008 | 4567.33 | 656 | 638 | 125.8 |
| B | 0 | 219 | 288294 | 2287.41 | 656 | 638 | 125.8 |
| B | 5 | 173 | 43811 | 343.31 | 656 | 638 | 125.8 |
| C | 0 | 10 | 242910 | 1622.45 | 644 | 649 | 149.3 |
| C | 10 | 49 | 115140 | 766.76 | 644 | 649 | 149.3 |
| C | 0 | 207 | 17633 | 113.74 | 644 | 649 | 149.3 |
| D | 8 | 195 | 1582821 | 9608.2 | 636 | 619 | 164.7 |
| D | 12 | 218 | 314394 | 1905.45 | 636 | 619 | 164.7 |
| D | 2 | 250 | 273134 | 1654.89 | 636 | 619 | 164.7 |
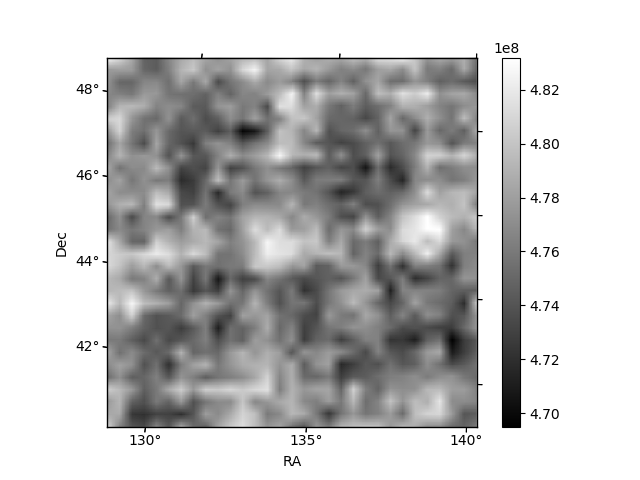
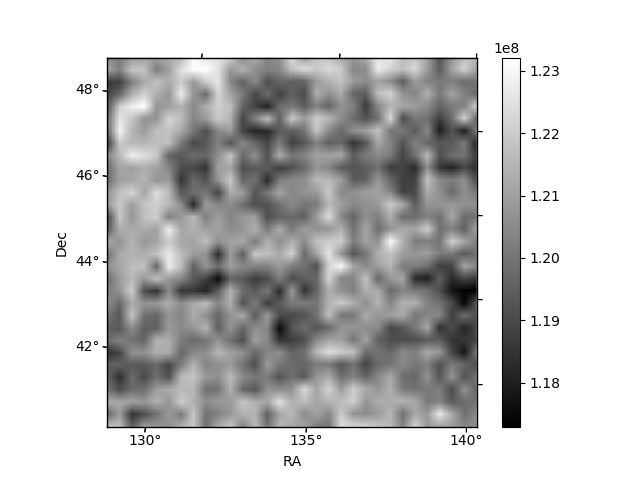
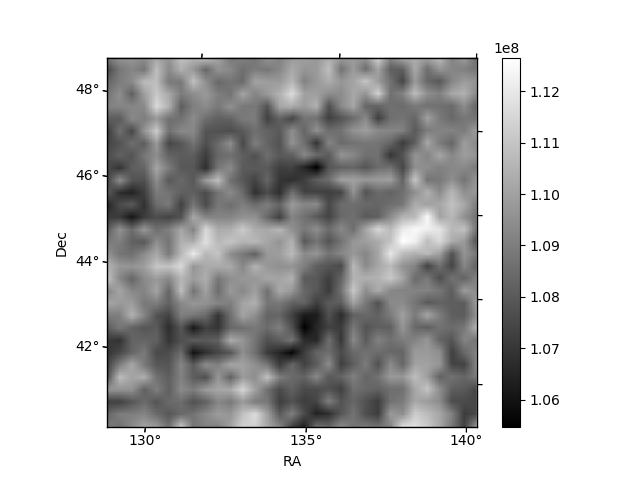
Histogram calculated using DETX and DETY for each event in the final _common_clean file
| Quadrant A | 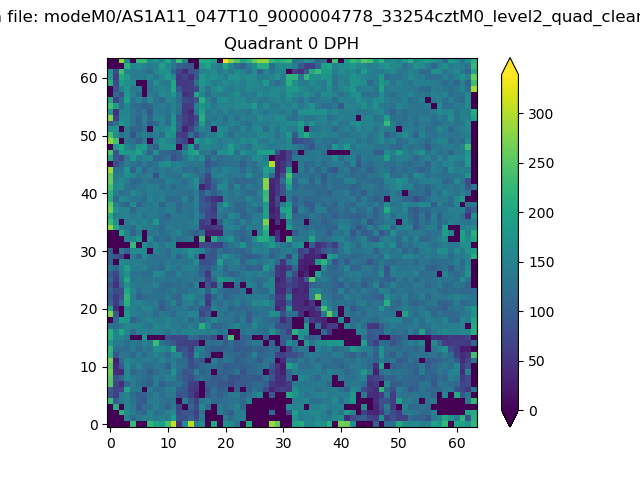 |
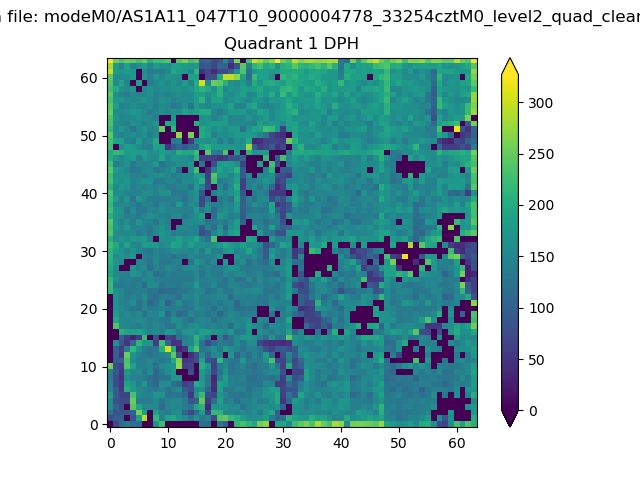 |
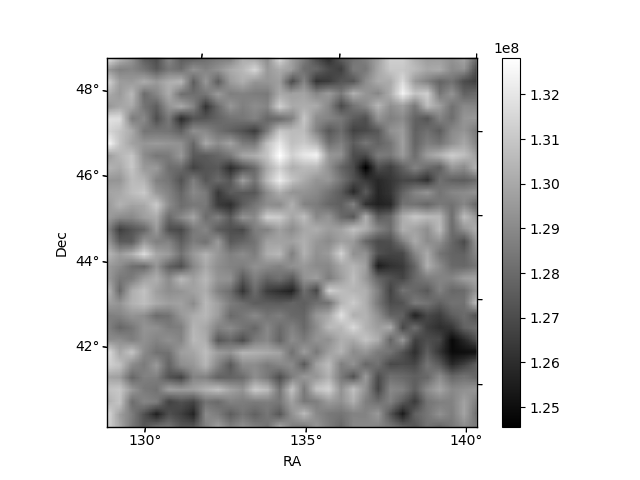
Quadrant B |
|---|---|---|---|
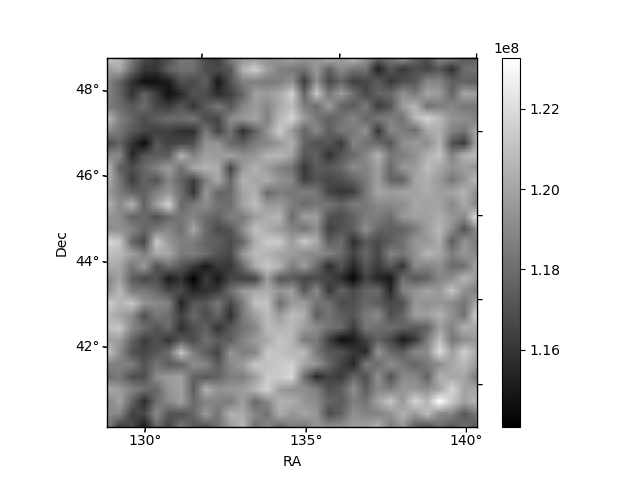
| Quadrant D | 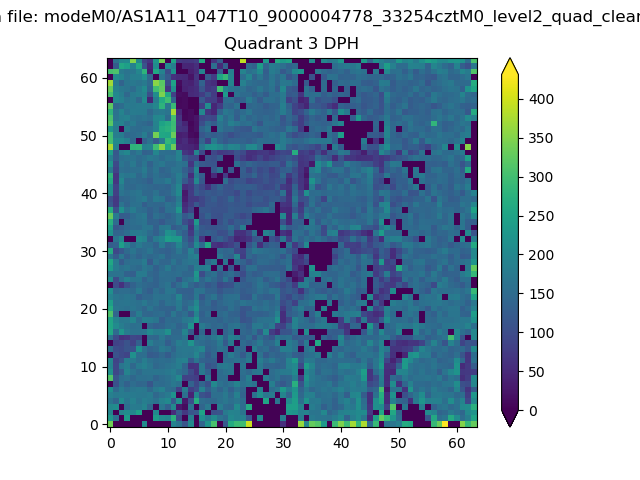 |
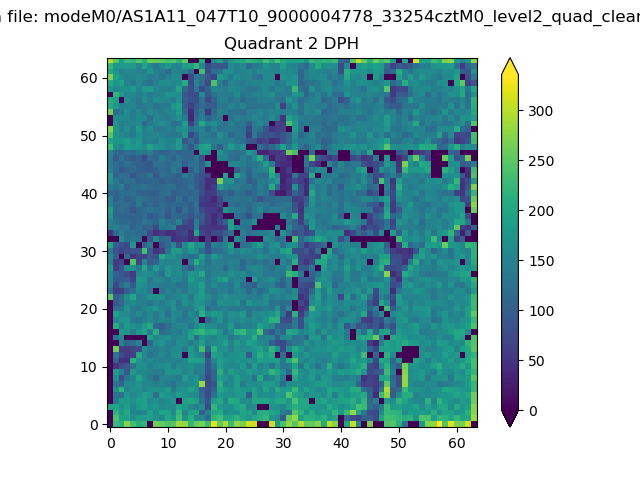 |
Quadrant C |
| Plot type | Count rate plots | Images |
|---|---|---|
| Comparison with Poisson distribution Blue bars denote a histogram of data divided into 1 sec bins. Red curve is a Poisson curve with rate = median count rate of data. |
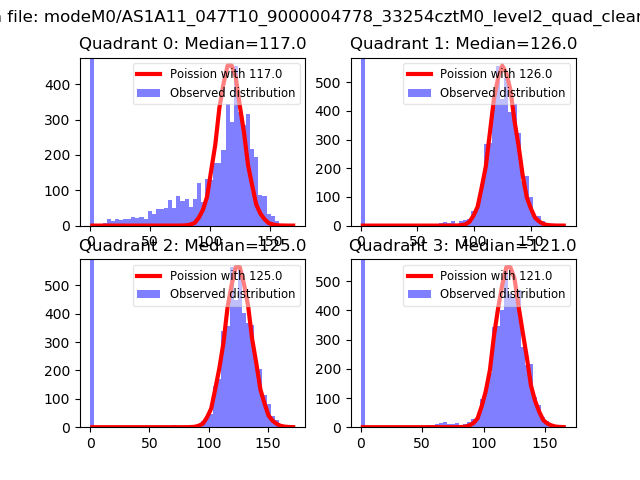 |
 |
| Quadrant-wise count rates Data is divided into 100 sec bins |
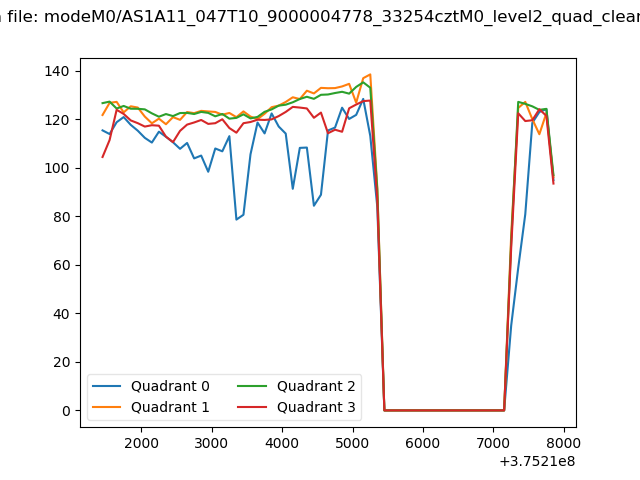 |
|
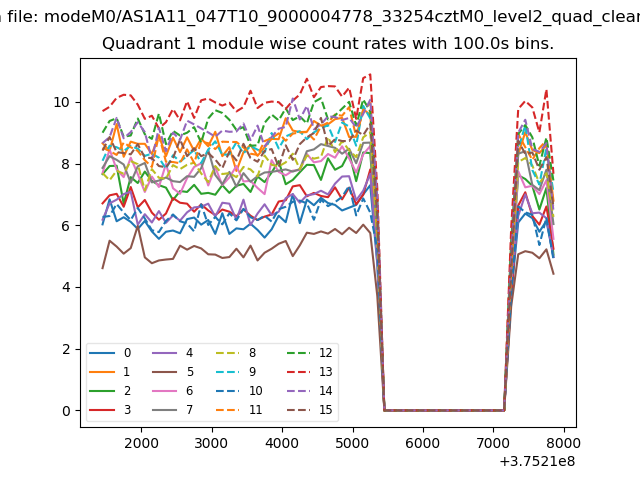
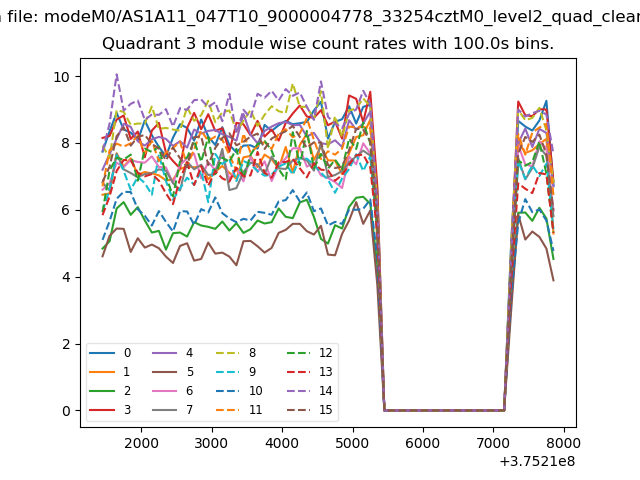
| Module-wise count rates for Quadrant A Data is divided into 100 sec bins |
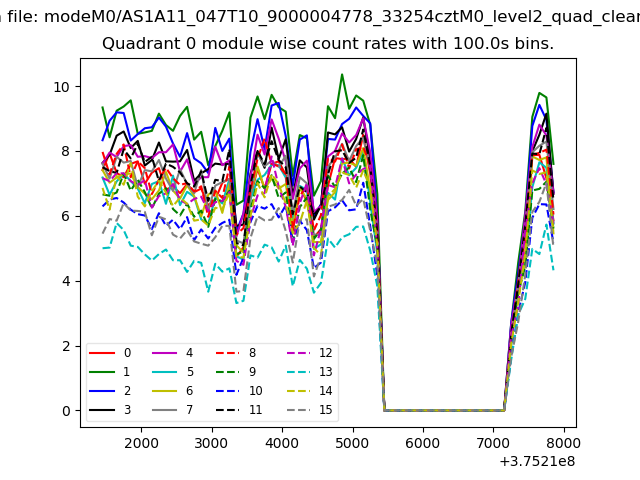 |
 |
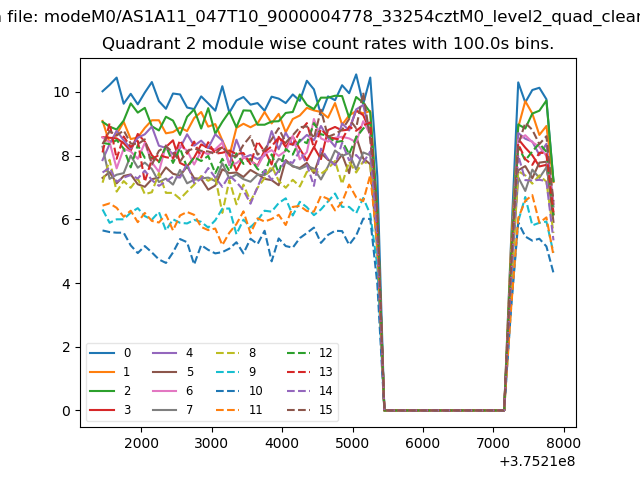
| Module-wise count rates for Quadrant B Data is divided into 100 sec bins |
 |
 |
| Module-wise count rates for Quadrant C Data is divided into 100 sec bins |
 |
 |
| Module-wise count rates for Quadrant D Data is divided into 100 sec bins |
 |
 |
| Parameter | Plot |
|---|---|
| CZT HV Monitor | 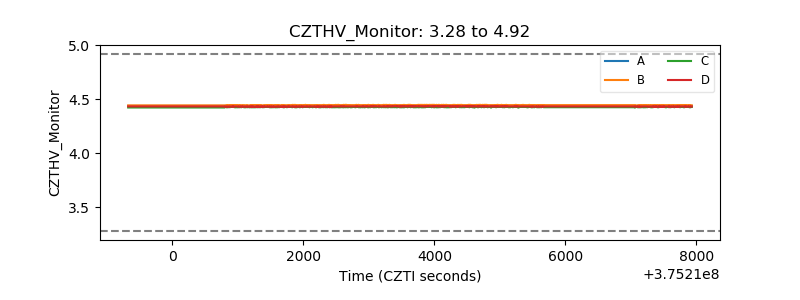 |
| D_VDD |  |
| Temperature 1 | 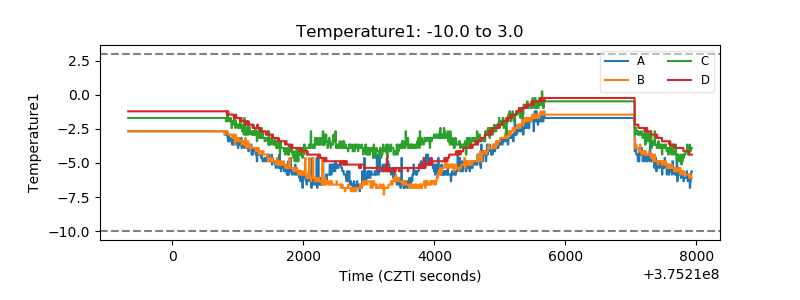 |
| Veto HV Monitor | 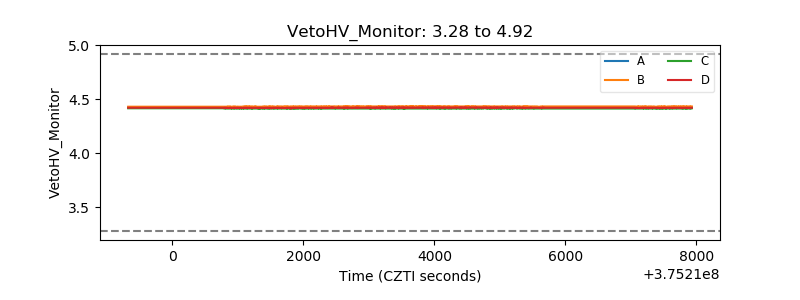 |
| Veto LLD |  |
| Alpha Counter | 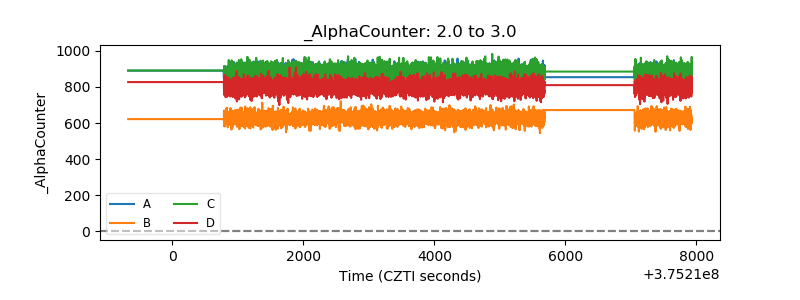 |
| _CPM_Rate | 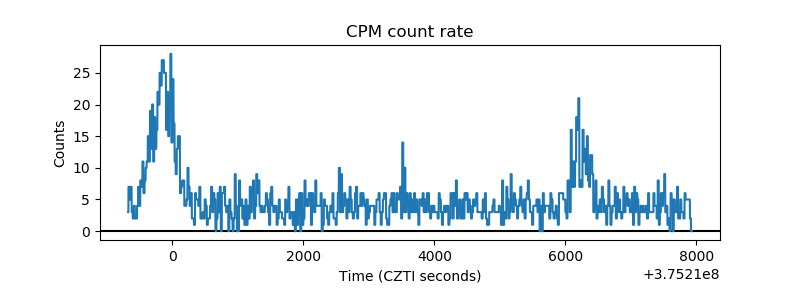 |
| CZT Counter | 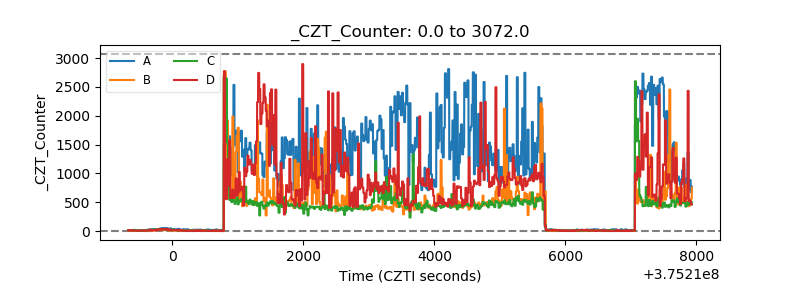 |
| +2.5 Volts monitor | 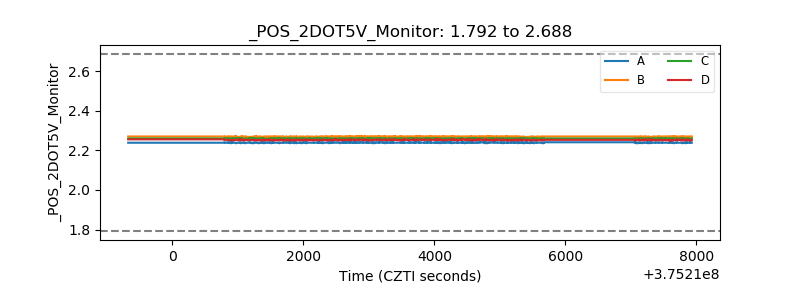 |
| +5 Volts monitor |  |
| _ROLL_ROT | 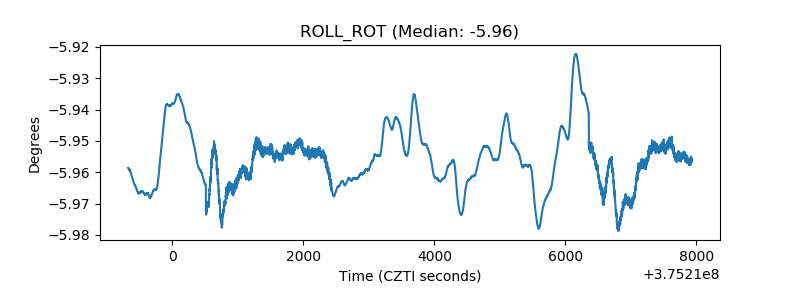 |
| _Roll_DEC | 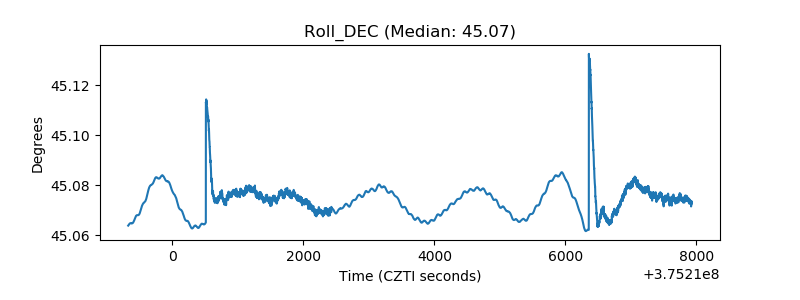 |
| _Roll_RA | 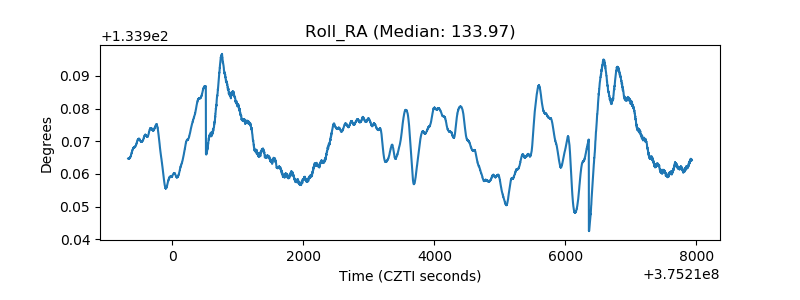 |
| Veto Counter | 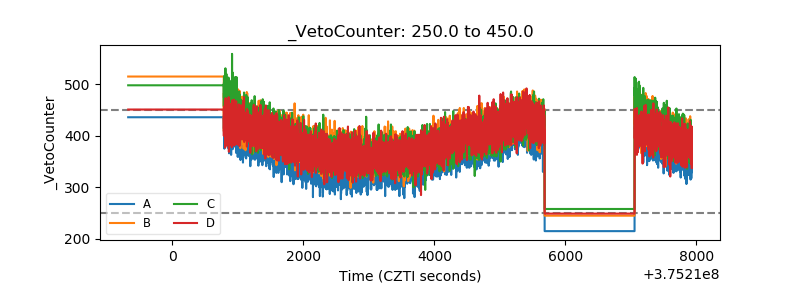 |