| Param | Original file | Final file |
|---|---|---|
| Filename | modeM0/AS1A11_047T10_9000004778_33255cztM0_level2.evt | modeM0/AS1A11_047T10_9000004778_33255cztM0_level2_quad_clean.evt |
| Size (bytes) | 727,568,640 | 93,634,560 |
| Size | 693.9 MB | 89.3 MB |
| Events in quadrant A | 8,753,438 | 546,012 |
| Events in quadrant B | 3,925,045 | 620,999 |
| Events in quadrant C | 3,150,232 | 625,601 |
| Events in quadrant D | 5,775,991 | 598,332 |
| Mode M0 | |||
|---|---|---|---|
| Quadrant | BADHDUFLAG | Total packets | Discarded packets |
| A | 0 | 30480 | 2 |
| B | 0 | 15981 | 1 |
| C | 0 | 13761 | 1 |
| D | 0 | 21612 | 1 |
| Mode SS | |||
|---|---|---|---|
| Quadrant | BADHDUFLAG | Total packets | Discarded packets |
| A | 0 | 130 | 0 |
| B | 0 | 130 | 0 |
| C | 0 | 130 | 0 |
| D | 0 | 130 | 0 |
| Mode M9 | |||
|---|---|---|---|
| Quadrant | BADHDUFLAG | Total packets | Discarded packets |
| A | 0 | 27 | 0 |
| B | 0 | 27 | 0 |
| C | 0 | 27 | 0 |
| D | 0 | 27 | 0 |
| Quadrant | Total seconds | Saturated seconds | Saturation percentage |
|---|---|---|---|
| A | 6365 | 2372 | 37.266300% |
| B | 6365 | 265 | 4.163394% |
| C | 6365 | 102 | 1.602514% |
| D | 6365 | 228 | 3.582090% |
Noise dominated data is calculated using 1-second bins in cleaned event files. If a bin has >2000 counts, and if more than 50% of those come from <1% of pixels, then it is considered to be noise-dominated and hence unusable.
| Quadrant | # 1 sec bins | Bins with >0 counts | Bins with >2000 counts | High rate bins dominated by noise | Noise dominated (total time) | Noise dominated (detector-on time) | Marked lightcurve |
|---|---|---|---|---|---|---|---|
| A | 9021 | 6367 | 1657 | 1657 | 18.37% | 26.02% | 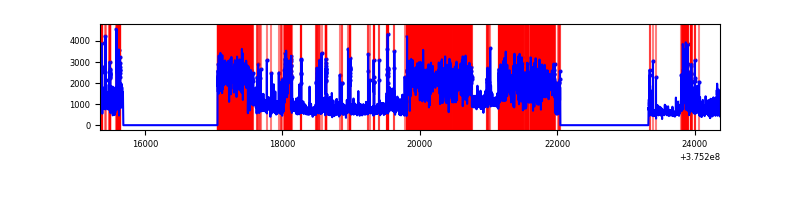 |
| B | 9021 | 6367 | 175 | 175 | 1.94% | 2.75% | 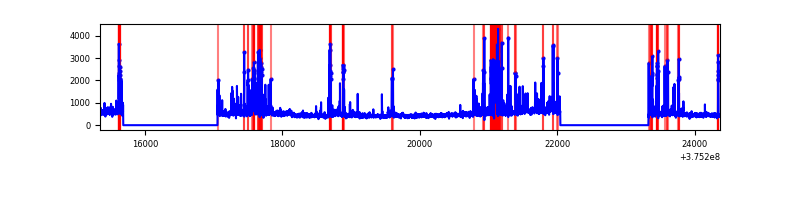 |
| C | 9021 | 6367 | 86 | 86 | 0.95% | 1.35% | 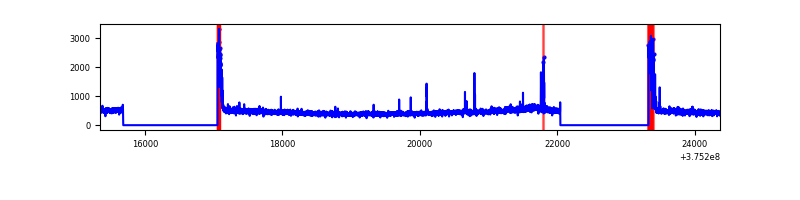 |
| D | 9021 | 6367 | 177 | 177 | 1.96% | 2.78% | 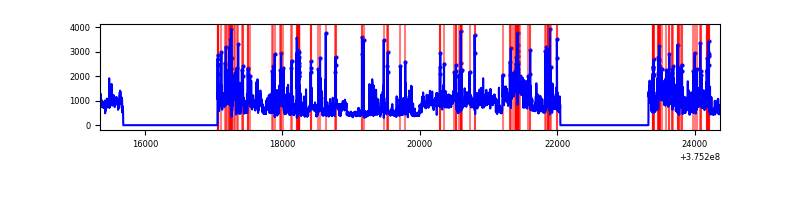 |
Top three noisy pixels from each quadrant. If the there are fewer than three noisy pixels in the level2.evt file, extra rows are filled as -1
| Pixel properties | Quadrant properties | ||||||
|---|---|---|---|---|---|---|---|
| Quadrant | DetID | PixID | Counts | Sigma | Mean | Median | Sigma |
| A | 15 | 169 | 6320782 | 50766.3 | 626 | 613 | 124.5 |
| A | 13 | 6 | 9989 | 75.31 | 626 | 613 | 124.5 |
| A | 13 | 254 | 9688 | 72.89 | 626 | 613 | 124.5 |
| B | 5 | 172 | 637369 | 4640.82 | 720 | 703 | 137.2 |
| B | 5 | 200 | 104317 | 755.27 | 720 | 703 | 137.2 |
| B | 0 | 219 | 82967 | 599.64 | 720 | 703 | 137.2 |
| C | 0 | 10 | 279988 | 1705.9 | 709 | 715 | 163.7 |
| C | 3 | 233 | 41483 | 249.03 | 709 | 715 | 163.7 |
| C | 1 | 23 | 14071 | 81.58 | 709 | 715 | 163.7 |
| D | 8 | 195 | 1748611 | 9377.24 | 703 | 687 | 186.4 |
| D | 7 | 223 | 257040 | 1375.28 | 703 | 687 | 186.4 |
| D | 2 | 249 | 192233 | 1027.6 | 703 | 687 | 186.4 |
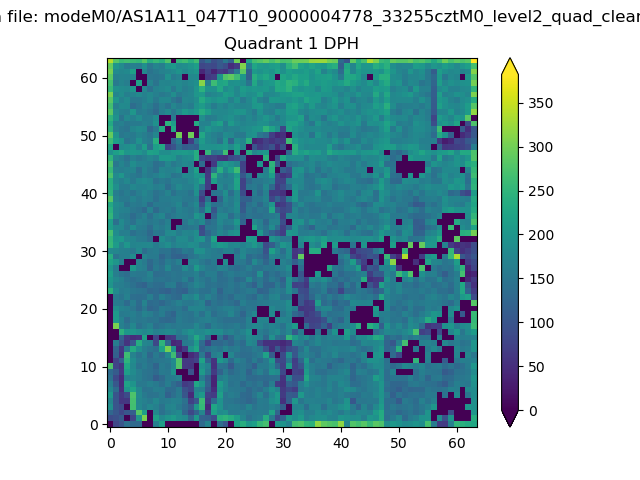
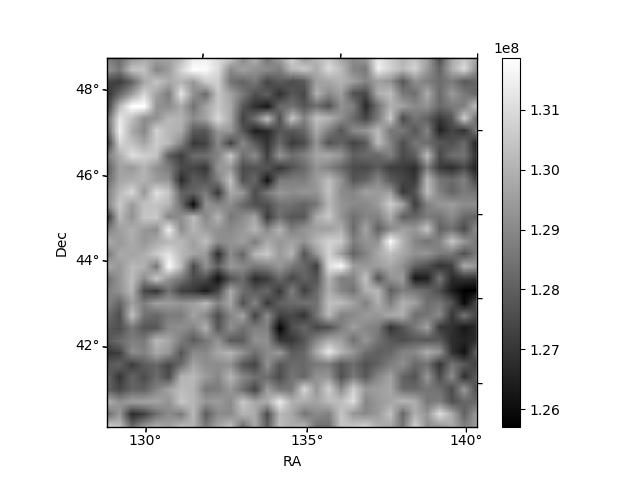
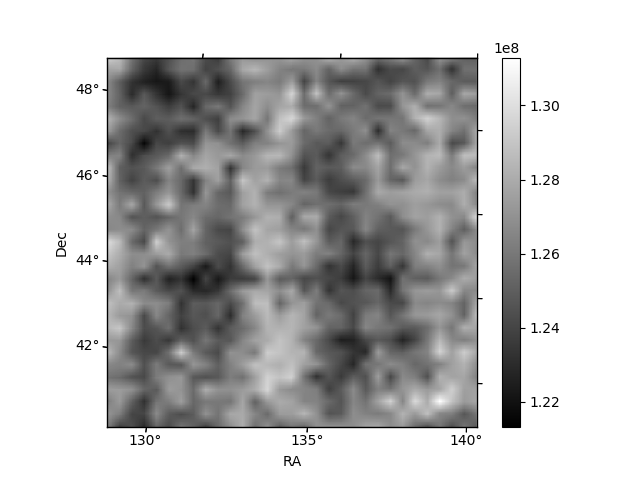
Histogram calculated using DETX and DETY for each event in the final _common_clean file
| Quadrant A |  |
 |
Quadrant B |
|---|---|---|---|
| Quadrant D | 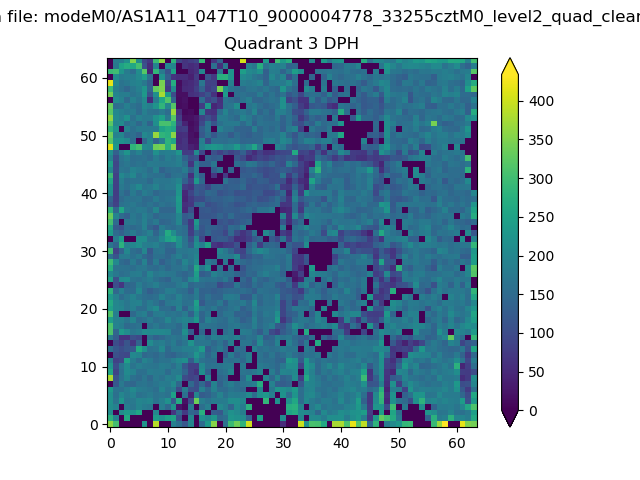 |
 |
Quadrant C |
| Plot type | Count rate plots | Images |
|---|---|---|
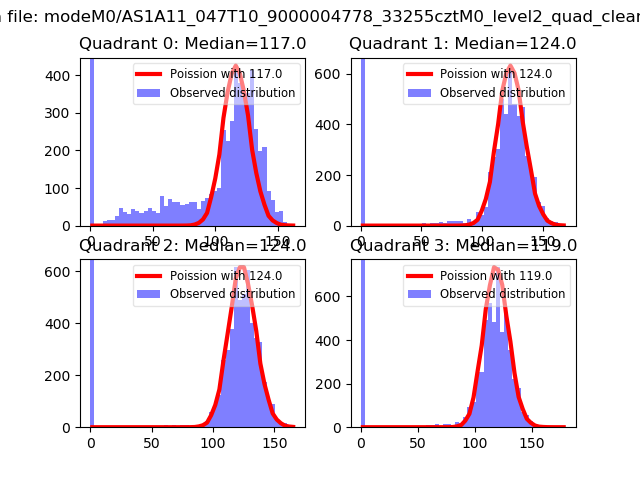
| Comparison with Poisson distribution Blue bars denote a histogram of data divided into 1 sec bins. Red curve is a Poisson curve with rate = median count rate of data. |
 |
 |
| Quadrant-wise count rates Data is divided into 100 sec bins |
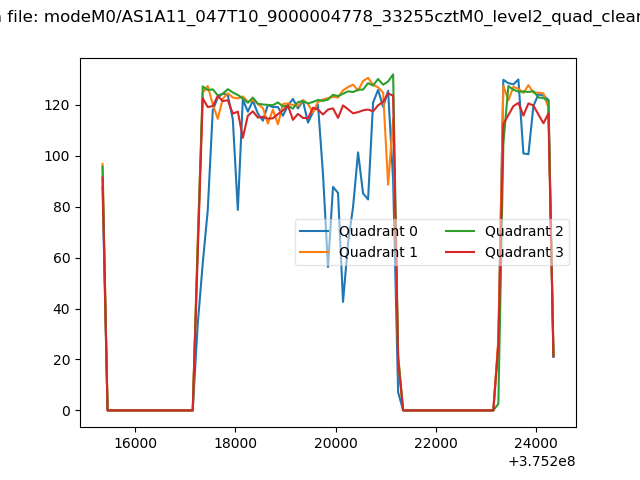 |
|
| Module-wise count rates for Quadrant A Data is divided into 100 sec bins |
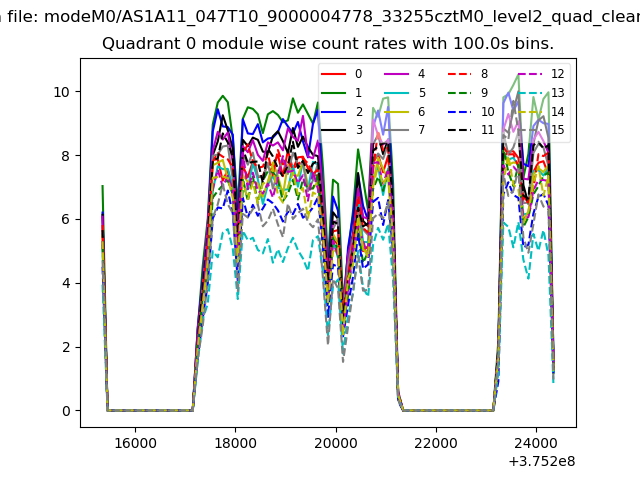 |
 |
| Module-wise count rates for Quadrant B Data is divided into 100 sec bins |
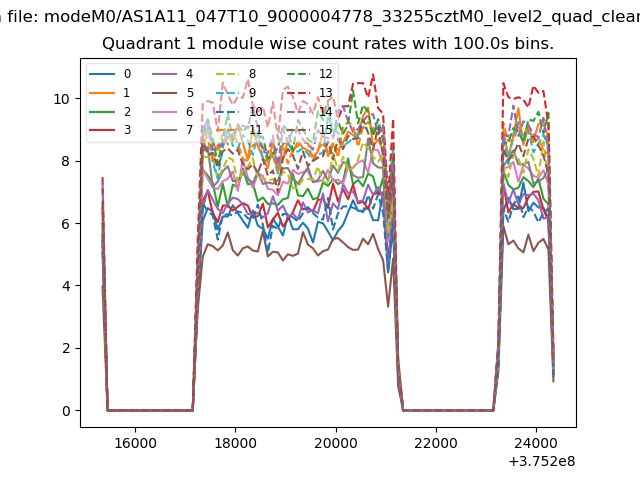 |
 |
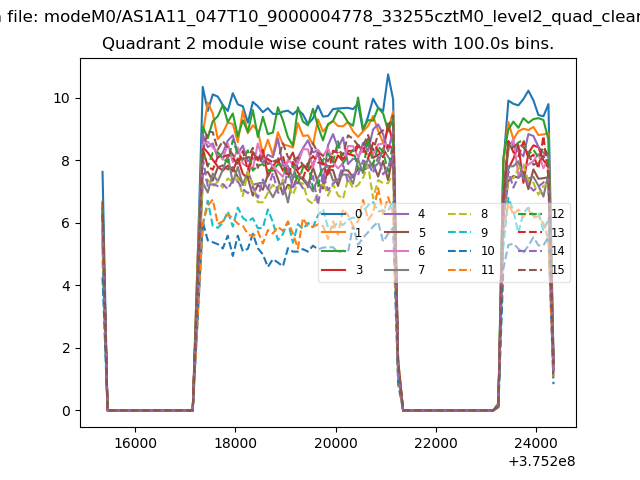
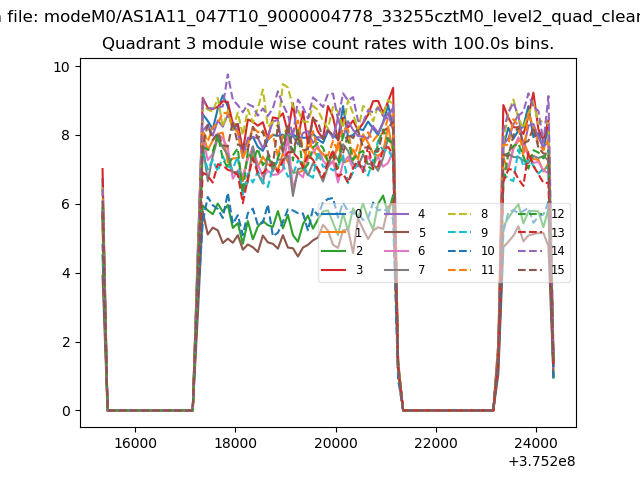
| Module-wise count rates for Quadrant C Data is divided into 100 sec bins |
 |
 |
| Module-wise count rates for Quadrant D Data is divided into 100 sec bins |
 |
 |
| Parameter | Plot |
|---|---|
| CZT HV Monitor | 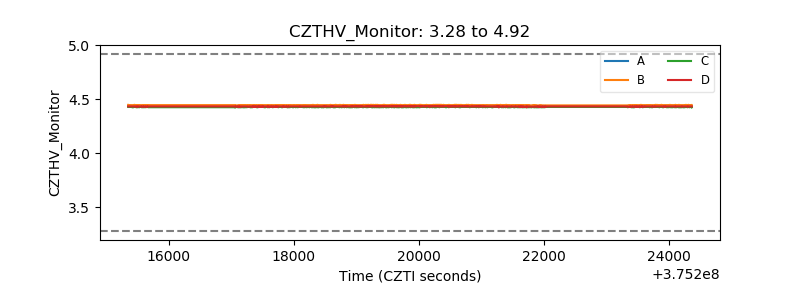 |
| D_VDD | 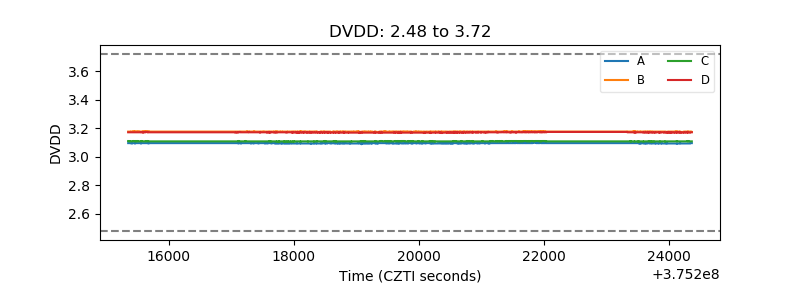 |
| Temperature 1 | 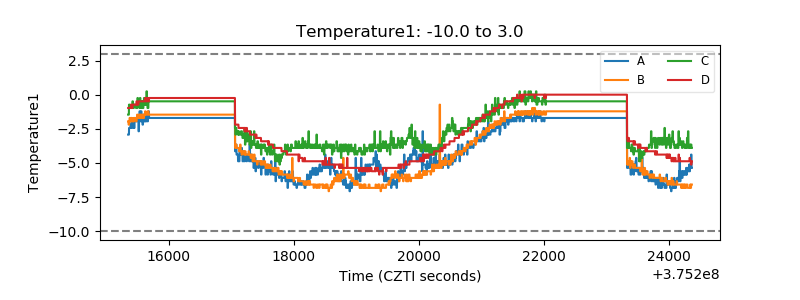 |
| Veto HV Monitor | 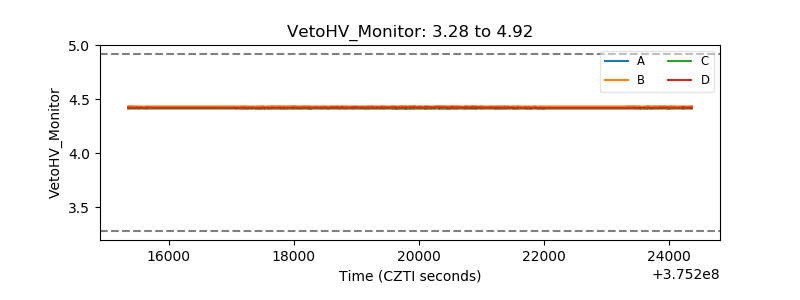 |
| Veto LLD | 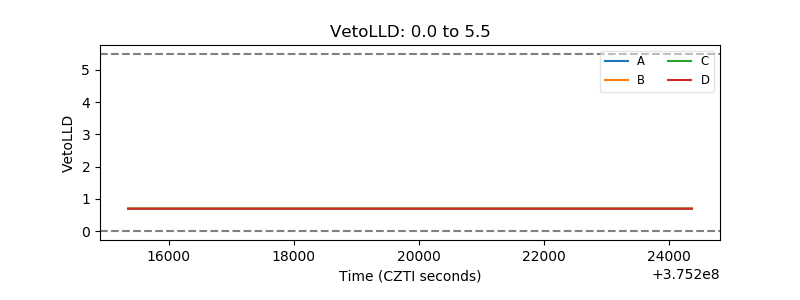 |
| Alpha Counter | 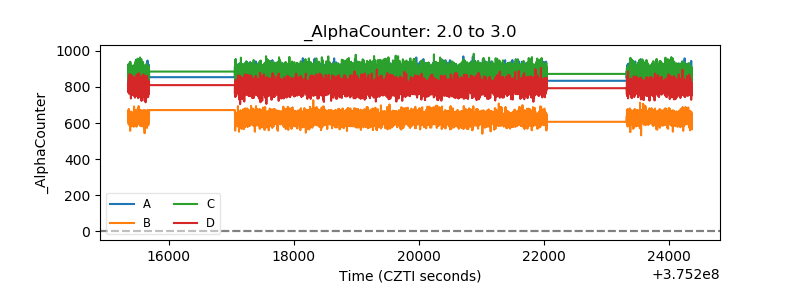 |
| _CPM_Rate | 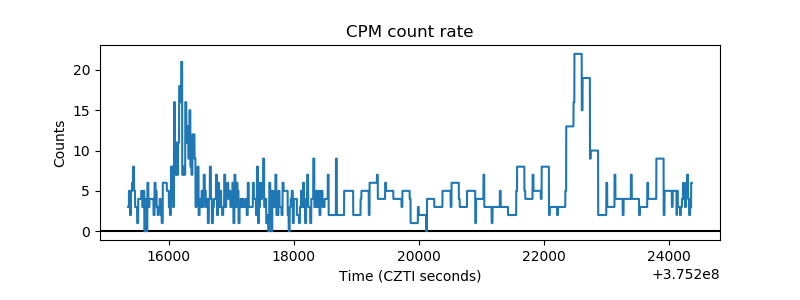 |
| CZT Counter | 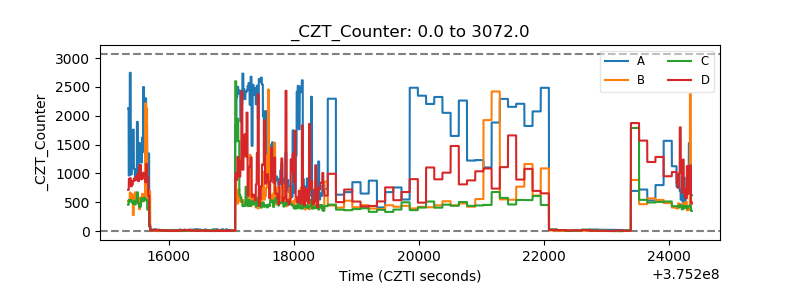 |
| +2.5 Volts monitor |  |
| +5 Volts monitor |  |
| _ROLL_ROT | 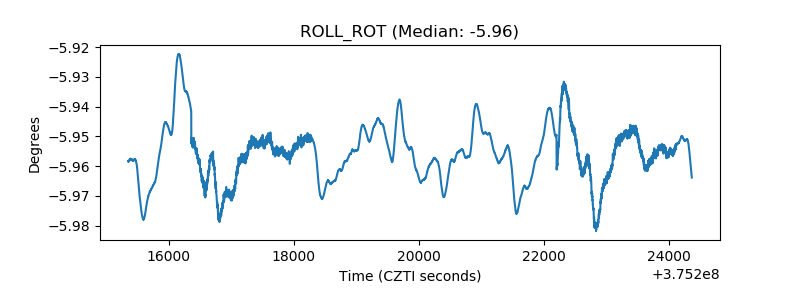 |
| _Roll_DEC | 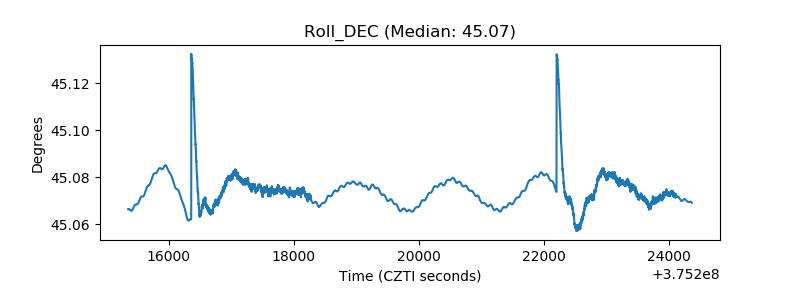 |
| _Roll_RA | 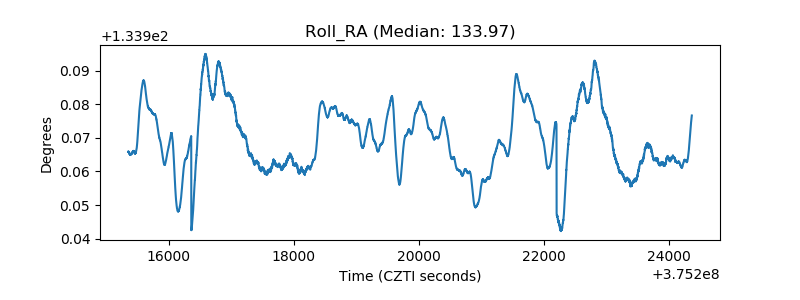 |
| Veto Counter | 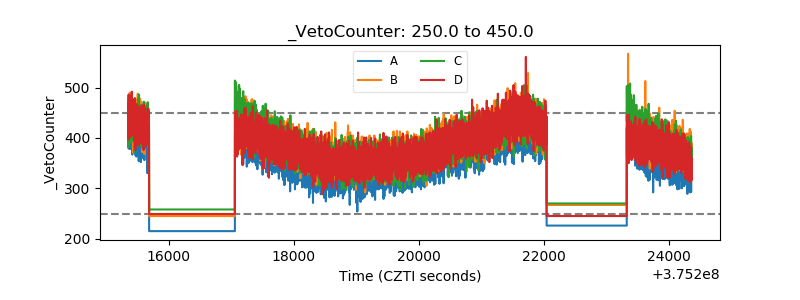 |