| Param | Original file | Final file |
|---|---|---|
| Filename | modeM0/AS1A11_047T10_9000004778_33261cztM0_level2.evt | modeM0/AS1A11_047T10_9000004778_33261cztM0_level2_quad_clean.evt |
| Size (bytes) | 941,368,320 | 130,409,280 |
| Size | 897.8 MB | 124.4 MB |
| Events in quadrant A | 4,820,199 | 839,850 |
| Events in quadrant B | 7,692,353 | 837,918 |
| Events in quadrant C | 4,917,390 | 823,509 |
| Events in quadrant D | 10,391,436 | 741,742 |
| Mode M0 | |||
|---|---|---|---|
| Quadrant | BADHDUFLAG | Total packets | Discarded packets |
| A | 0 | 20977 | 4 |
| B | 0 | 29747 | 3 |
| C | 0 | 21456 | 3 |
| D | 0 | 37894 | 3 |
| Mode SS | |||
|---|---|---|---|
| Quadrant | BADHDUFLAG | Total packets | Discarded packets |
| A | 0 | 208 | 0 |
| B | 0 | 208 | 0 |
| C | 0 | 208 | 0 |
| D | 0 | 208 | 0 |
| Mode M9 | |||
|---|---|---|---|
| Quadrant | BADHDUFLAG | Total packets | Discarded packets |
| A | 0 | 34 | 0 |
| B | 0 | 34 | 0 |
| C | 0 | 34 | 0 |
| D | 0 | 35 | 0 |
| Quadrant | Total seconds | Saturated seconds | Saturation percentage |
|---|---|---|---|
| A | 10190 | 36 | 0.353288% |
| B | 10190 | 999 | 9.803729% |
| C | 10190 | 77 | 0.755643% |
| D | 10190 | 1122 | 11.010795% |
Noise dominated data is calculated using 1-second bins in cleaned event files. If a bin has >2000 counts, and if more than 50% of those come from <1% of pixels, then it is considered to be noise-dominated and hence unusable.
| Quadrant | # 1 sec bins | Bins with >0 counts | Bins with >2000 counts | High rate bins dominated by noise | Noise dominated (total time) | Noise dominated (detector-on time) | Marked lightcurve |
|---|---|---|---|---|---|---|---|
| A | 13596 | 10192 | 21 | 21 | 0.15% | 0.21% | 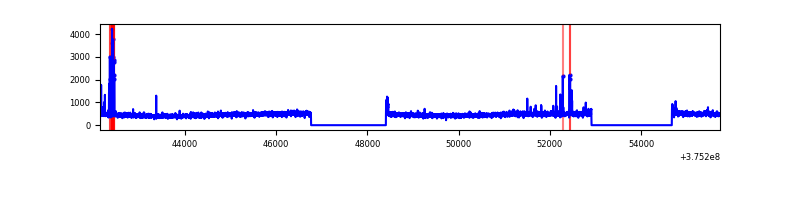 |
| B | 13596 | 10192 | 713 | 713 | 5.24% | 7.00% | 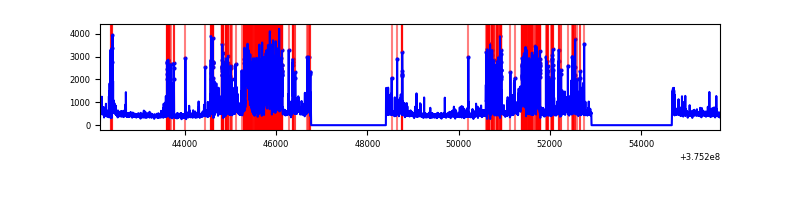 |
| C | 13596 | 10192 | 56 | 56 | 0.41% | 0.55% | 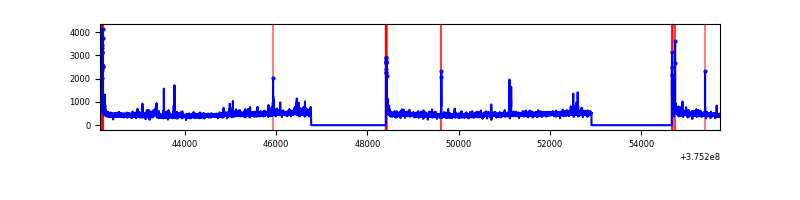 |
| D | 13596 | 10192 | 916 | 916 | 6.74% | 8.99% | 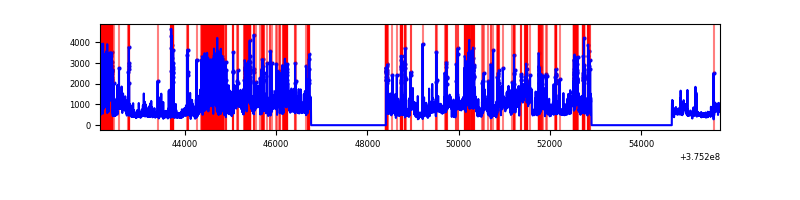 |
Top three noisy pixels from each quadrant. If the there are fewer than three noisy pixels in the level2.evt file, extra rows are filled as -1
| Pixel properties | Quadrant properties | ||||||
|---|---|---|---|---|---|---|---|
| Quadrant | DetID | PixID | Counts | Sigma | Mean | Median | Sigma |
| A | 15 | 169 | 177527 | 747.06 | 1196 | 1172 | 236.1 |
| A | 13 | 254 | 17826 | 70.55 | 1196 | 1172 | 236.1 |
| A | 13 | 6 | 12450 | 47.78 | 1196 | 1172 | 236.1 |
| B | 5 | 172 | 2346279 | 11050.59 | 1130 | 1104 | 212.2 |
| B | 0 | 219 | 564787 | 2656.11 | 1130 | 1104 | 212.2 |
| B | 5 | 200 | 103613 | 483.03 | 1130 | 1104 | 212.2 |
| C | 0 | 10 | 233243 | 884.43 | 1145 | 1153 | 262.4 |
| C | 10 | 49 | 103497 | 390.0 | 1145 | 1153 | 262.4 |
| C | 14 | 254 | 58794 | 219.65 | 1145 | 1153 | 262.4 |
| D | 8 | 195 | 2796464 | 10443.99 | 1100 | 1068 | 267.7 |
| D | 2 | 250 | 1053601 | 3932.41 | 1100 | 1068 | 267.7 |
| D | 12 | 218 | 948882 | 3541.17 | 1100 | 1068 | 267.7 |
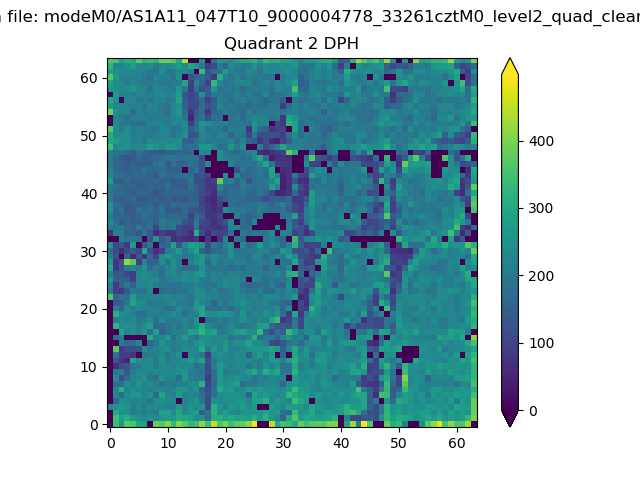
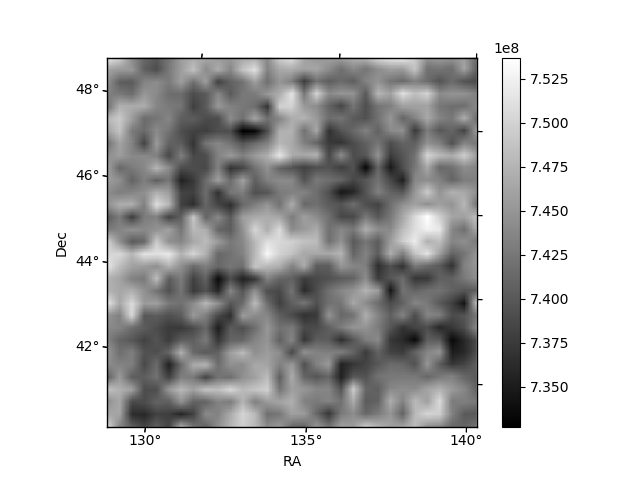
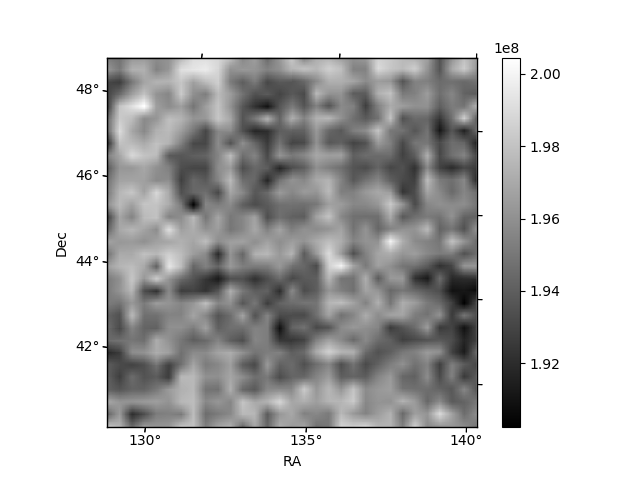
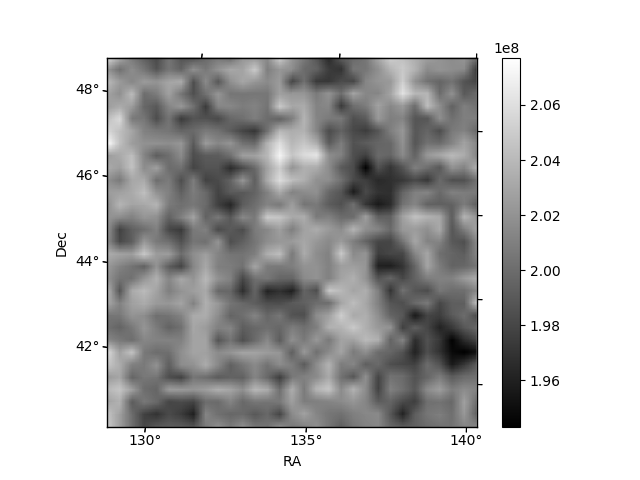
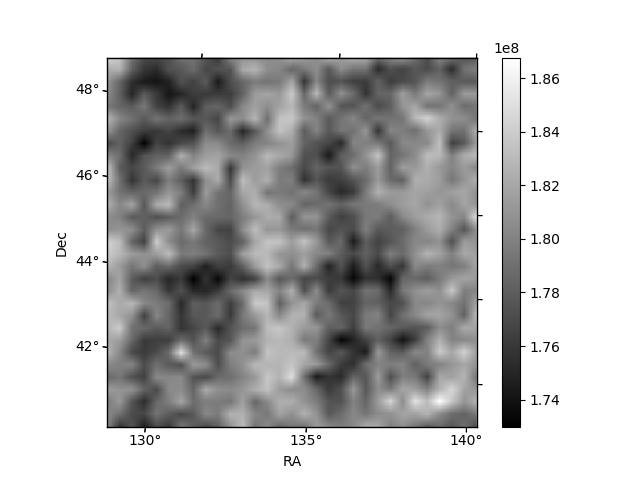
Histogram calculated using DETX and DETY for each event in the final _common_clean file
| Quadrant A | 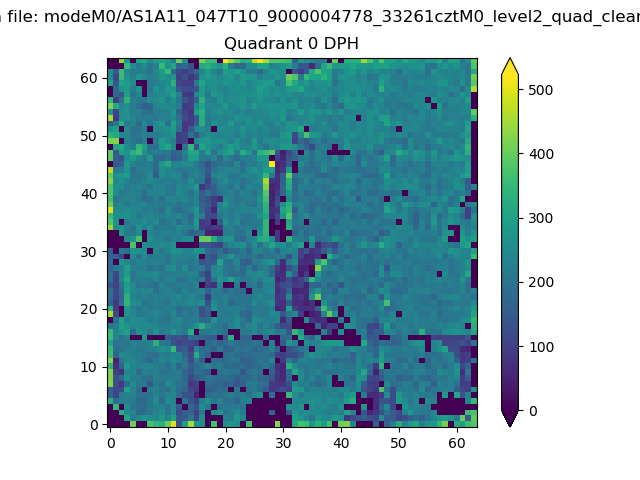 |
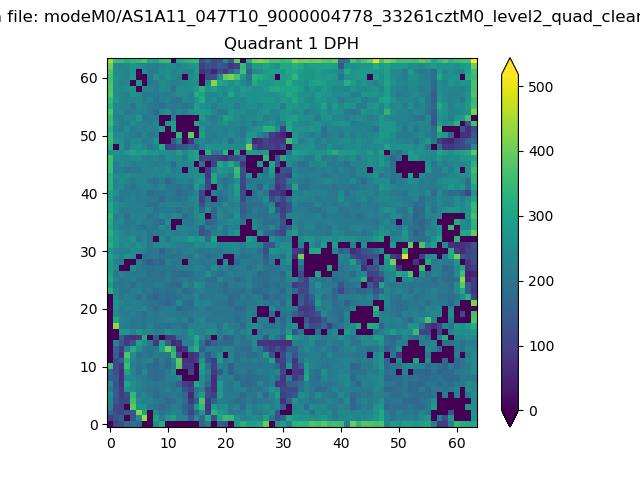 |
Quadrant B |
|---|---|---|---|
| Quadrant D | 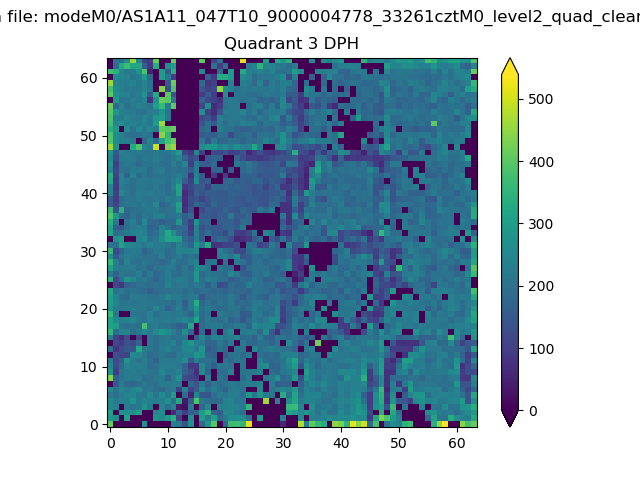 |
 |
Quadrant C |
| Plot type | Count rate plots | Images |
|---|---|---|
| Comparison with Poisson distribution Blue bars denote a histogram of data divided into 1 sec bins. Red curve is a Poisson curve with rate = median count rate of data. |
 |
 |
| Quadrant-wise count rates Data is divided into 100 sec bins |
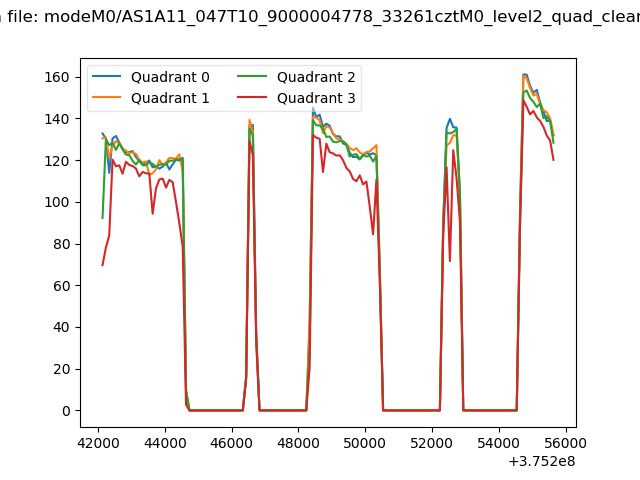 |
|
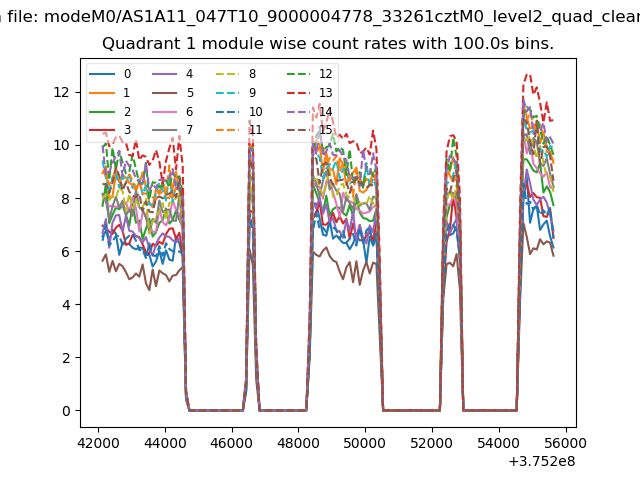
| Module-wise count rates for Quadrant A Data is divided into 100 sec bins |
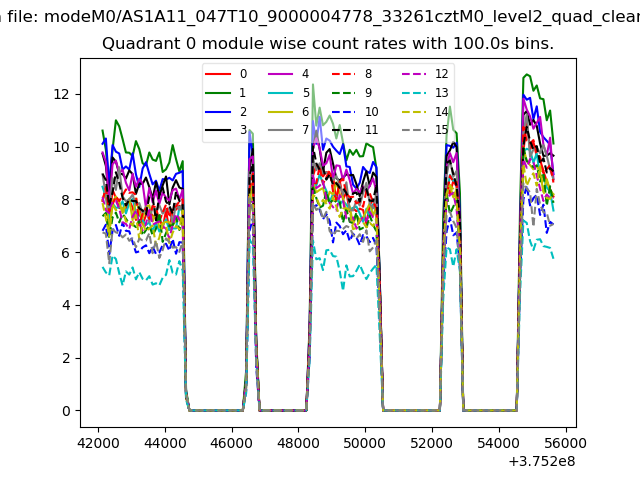 |
 |
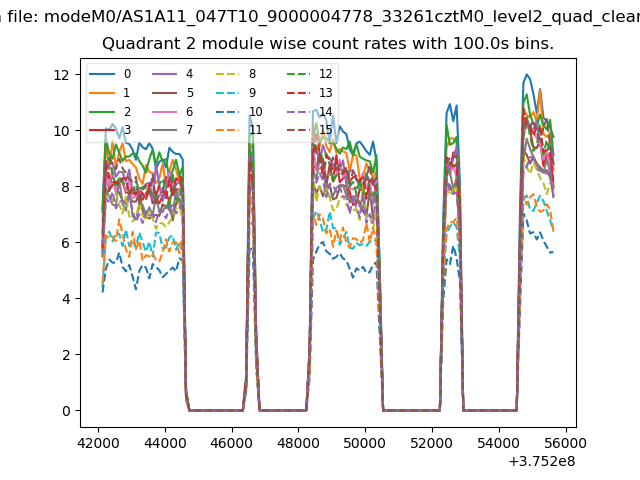
| Module-wise count rates for Quadrant B Data is divided into 100 sec bins |
 |
 |
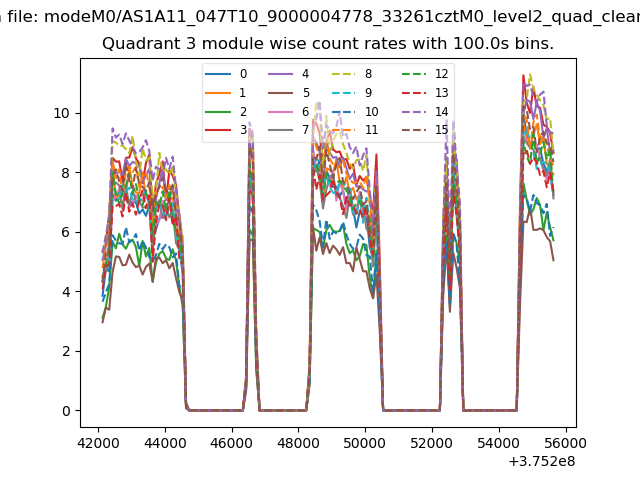
| Module-wise count rates for Quadrant C Data is divided into 100 sec bins |
 |
 |
| Module-wise count rates for Quadrant D Data is divided into 100 sec bins |
 |
 |
| Parameter | Plot |
|---|---|
| CZT HV Monitor | 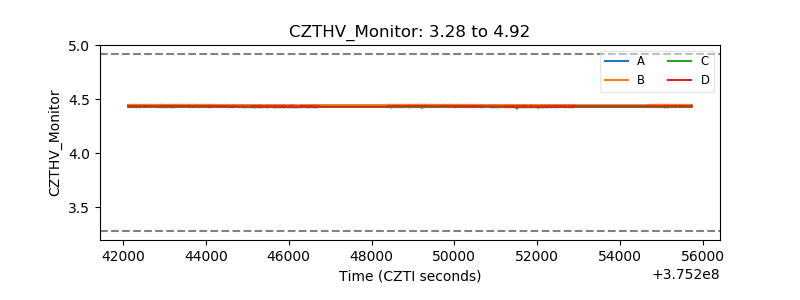 |
| D_VDD | 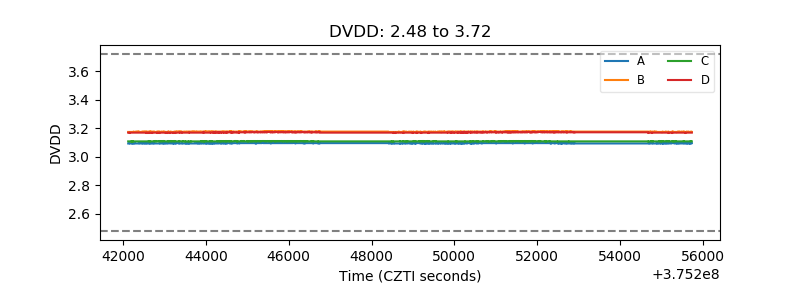 |
| Temperature 1 | 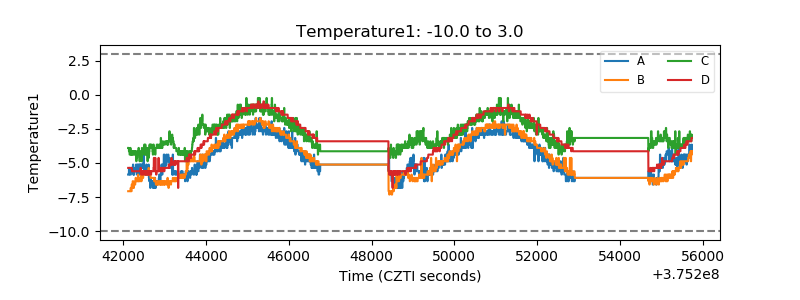 |
| Veto HV Monitor | 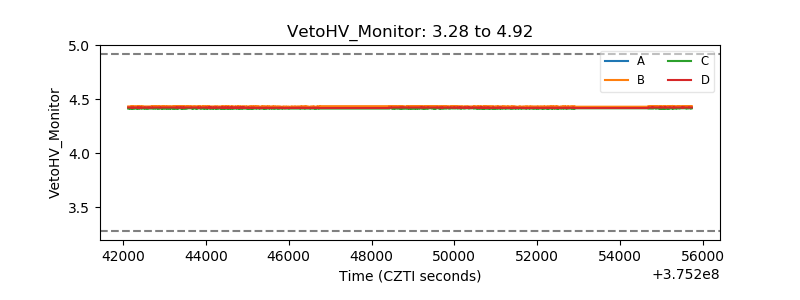 |
| Veto LLD | 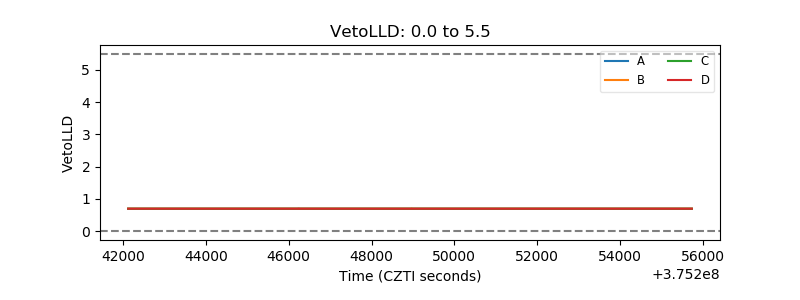 |
| Alpha Counter | 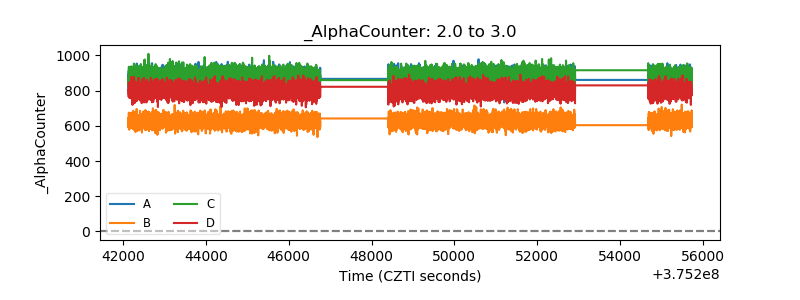 |
| _CPM_Rate | 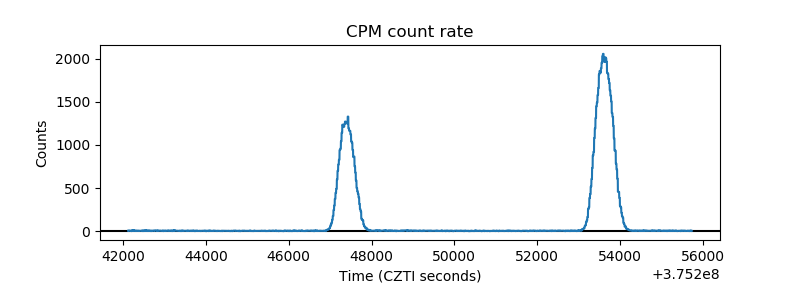 |
| CZT Counter | 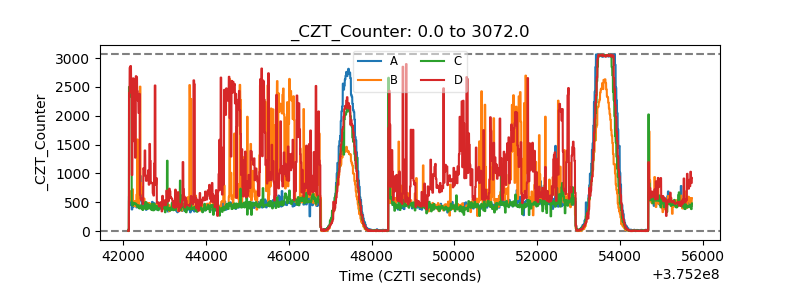 |
| +2.5 Volts monitor | 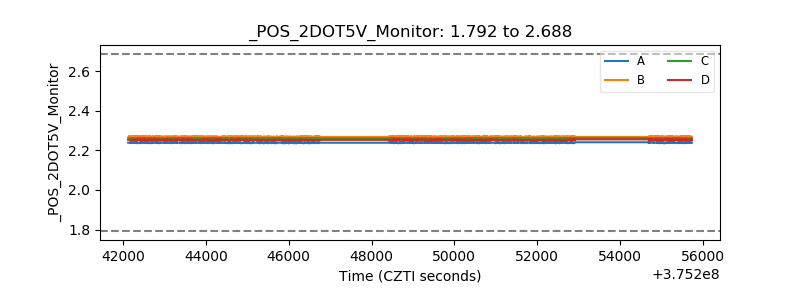 |
| +5 Volts monitor |  |
| _ROLL_ROT | 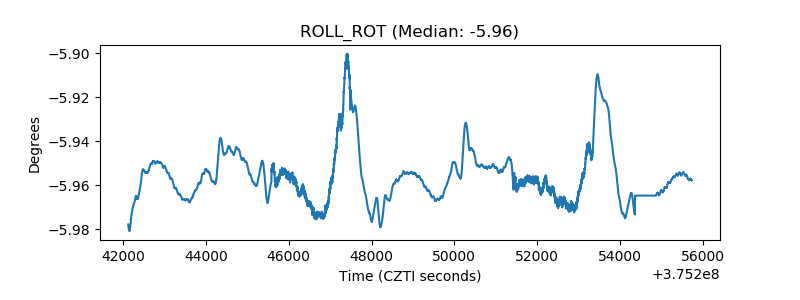 |
| _Roll_DEC | 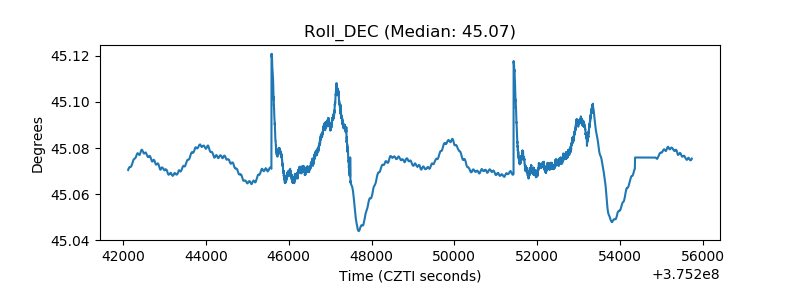 |
| _Roll_RA | 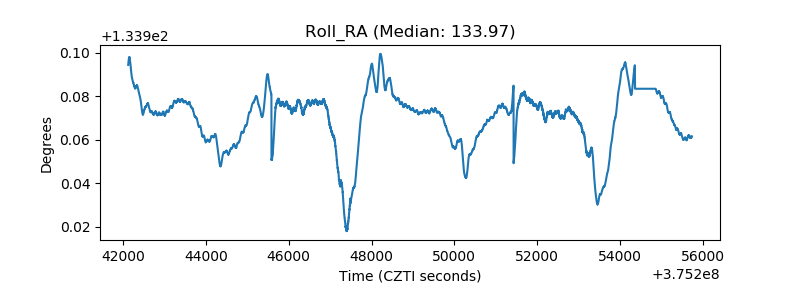 |
| Veto Counter | 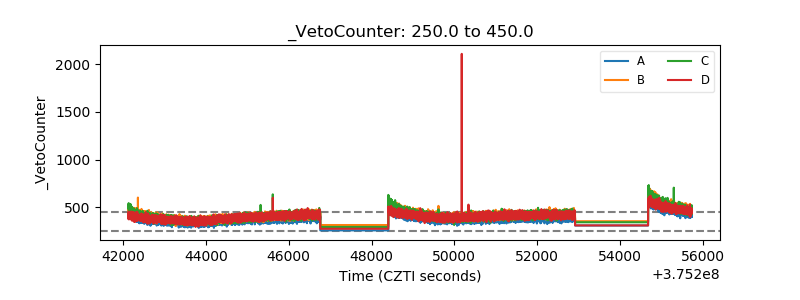 |